Data Handling Assignment: Data Analysis with Excel and Weka Tools
VerifiedAdded on 2023/01/11
|14
|3267
|50
Homework Assignment
AI Summary
This document provides a comprehensive solution to a data handling assignment. Part 1 focuses on data preprocessing using Microsoft Excel, including the application of the IF function, and the creation of charts and graphs for data visualization. Part 2 delves into data mining techniques using the Weka software, specifically demonstrating clustering with the audidealership.csv dataset. The solution also explains common data mining methods applicable in business, providing real-world examples and comparing the advantages and disadvantages of Weka over Excel. The document includes detailed explanations, code snippets, and interpretations of results, offering a practical guide to data analysis and mining concepts. The content covers data storage, recovery, reporting, and research, as well as conditional formatting and security within Excel, alongside the application of clustering algorithms in Weka.

DATA
HANDLING
HANDLING
Paraphrase This Document
Need a fresh take? Get an instant paraphrase of this document with our AI Paraphraser
Contents
PART 1............................................................................................................................................3
1. Use of excel of pre-processing the data...................................................................................3
Use of IF function in Excel......................................................................................................4
Charts and Graphs....................................................................................................................5
PART 2............................................................................................................................................6
2.1 Using the audidealership.csv provided in conjunction with Weka give a specific example
of clustering.................................................................................................................................6
2.2 Explain the most common data mining methods that can be used in business with real
world examples..........................................................................................................................10
2.3 Advantages and disadvantages of Weka over excel............................................................13
REFERENCES..............................................................................................................................14
PART 1
1. Use of excel of pre-processing the data
Enterprises can in Microsoft Excel be listed for clients, company managers, home bosses,
data collection, regular results analysis and Microsoft Excel function (Changhong, Intel IP Corp,
2018). The following functions are included in Microsoft Excel:
ANALYSING AND STORING DATA- Microsoft Excel is a perfect way to manipulate
data and evaluate the system. Information can be written in various rows and columns of
the text. Via maps, charts and graphs, data mining is supported. Information from
different documentation and records is available through Excel. Data are being stored
ordered. It helps one to spend a lot of time in order to fully grasp the exams. The data
processing using the Pivot Table would not be encouraged.
DATA RECOVERY- It is possible to get it from Windows if the data is impaired. In the
MS Excel package, data is extracted
MAKING REPORT- MS Excel and MS Word MS document and MS Excel table format
may be submitted to the prose article. MS Excel can obtain these data. These data. MS
Excel can be used to allow simultaneous device distinctions. MS Excel not only monitors
businesses but also encourages staff to document their success reviews on a daily basis.
Teachers will assist students by utilizing graphs, models, methods and estimates.
RESEARCH- They typically tries levels of accomplishment in the past, but advances
often help us complete our potential research. Why shall we survive for many years in
this manner. Analysis leads to addressing the question of what is and what is not. Users
build possibilities for our potential through different algorithms and historical patterns.
The planning and production was undertaken by organizations according to this research.
CONDITIONAL FORMATTING- All relevant entities may be classified under
conditional coding. Another illustration may also be a conditional model. This also refers
to meanings identification and replication acknowledgement (Shaer, Kanj and Joshi,
2019).
Security- MS Excel provides Excel computer protection primarily, allowing consumers to
manage their data quickly. The two MS Excel files are held in an excellent folder with
⊘ This is a preview!⊘
Do you want full access?
Subscribe today to unlock all pages.
Trusted by 1+ million students worldwide
easy visual programming. In MS Excel, you store your simple details and keep your data
structured to save time. Many people love to protect their records, and MS Excel is really
good to fix this problem. So no one can touch or ruin them.
Use of IF function in Excel
The IF feature or IF declaration in Excel consists of a comma dividing three pieces
• In this case, it is simple to see what points of revenue and income are decreased and on what
date was the purchase by sellers, as well as how the IF feature is done step by phase.
Print and paste the first time in separate sheets tax period, revenue and income.
• Reorganize old details by arranging the quality function sheet for the first time.
Use the 'IF Element' form. • Shape a form code = if (sort of virus: B2>C3),
• Add a cell code to be checked if the requirement is met by the user.
• Pick a comma: • Select "Augment"
• Delete the box; then click Enter if the requirement has not been fulfilled.
When a function reveals B3's significance, then if the importance of B3's is less than the B3's
variable, the B1's parameter will also mean that the IF parameter is more important than B3.'
When this function is seen,
Users should obtain the cell B4 file after you press the Enter key. To see the impact, transfer the
handle from D4 to cell D8400.
If in an application users need to learn well what are H Lookup and V lookup first, they will not
be confused. Whether or not the customers want it is also an important skill. You will consider
anything in detail if you operate for minimal numbers. This would therefore take more longer to
locate everything in the data for the extension of the search.
Lookup Value- The row or base item of the quest. That's the row's basis.
Table series- The required meaning chart. It is difficult to choose from your table what you
want.
Paraphrase This Document
Need a fresh take? Get an instant paraphrase of this document with our AI Paraphraser

Row index number- The number of the target is shown in row sums. The first row is 1.
Range_ lookup]: There are two sets with the same set in the table, one right (1) and another
incorrect (0). The second match of the show.
Demonstration of Look up function on given situation of Superstore Sale:
Using the same excel sheet, the following steps will be taken:
Lookup Value- A column or row area suits a question and returns the same value from the
default behavior of the column or row zone in which LOOKUP overrides these issues
(Chiabrando, Sammartano and Spanò, 2016). For time of request, selling and revenue use Cell
G2, H2 and I2. G3, H3 and I3 can be obtained. Pick the Lookup feature and set the cell H3; using
the Lookup key as G3 cell.
Table series- Choose from A2 to C8400 (A2:C8400) for the whole set.
[Range_ lookup]- Select cell to be purchased, B2 to B8400 (B2:B8400).
Charts and Graphs
Steps:
• Pick a cell that will be rendered for a line graph.
• Choose a line graph to require visibility.
01/01/2009
03/04/2009
04/07/2009
04/10/2009
04/01/2010
06/04/2010
07/07/2010
07/10/2010
07/01/2011
09/04/2011
10/07/2011
10/10/2011
10/01/2012
11/04/2012
12/07/2012
12/10/2012
-20000
0
20000
40000
60000
80000
100000
Sales
Profit
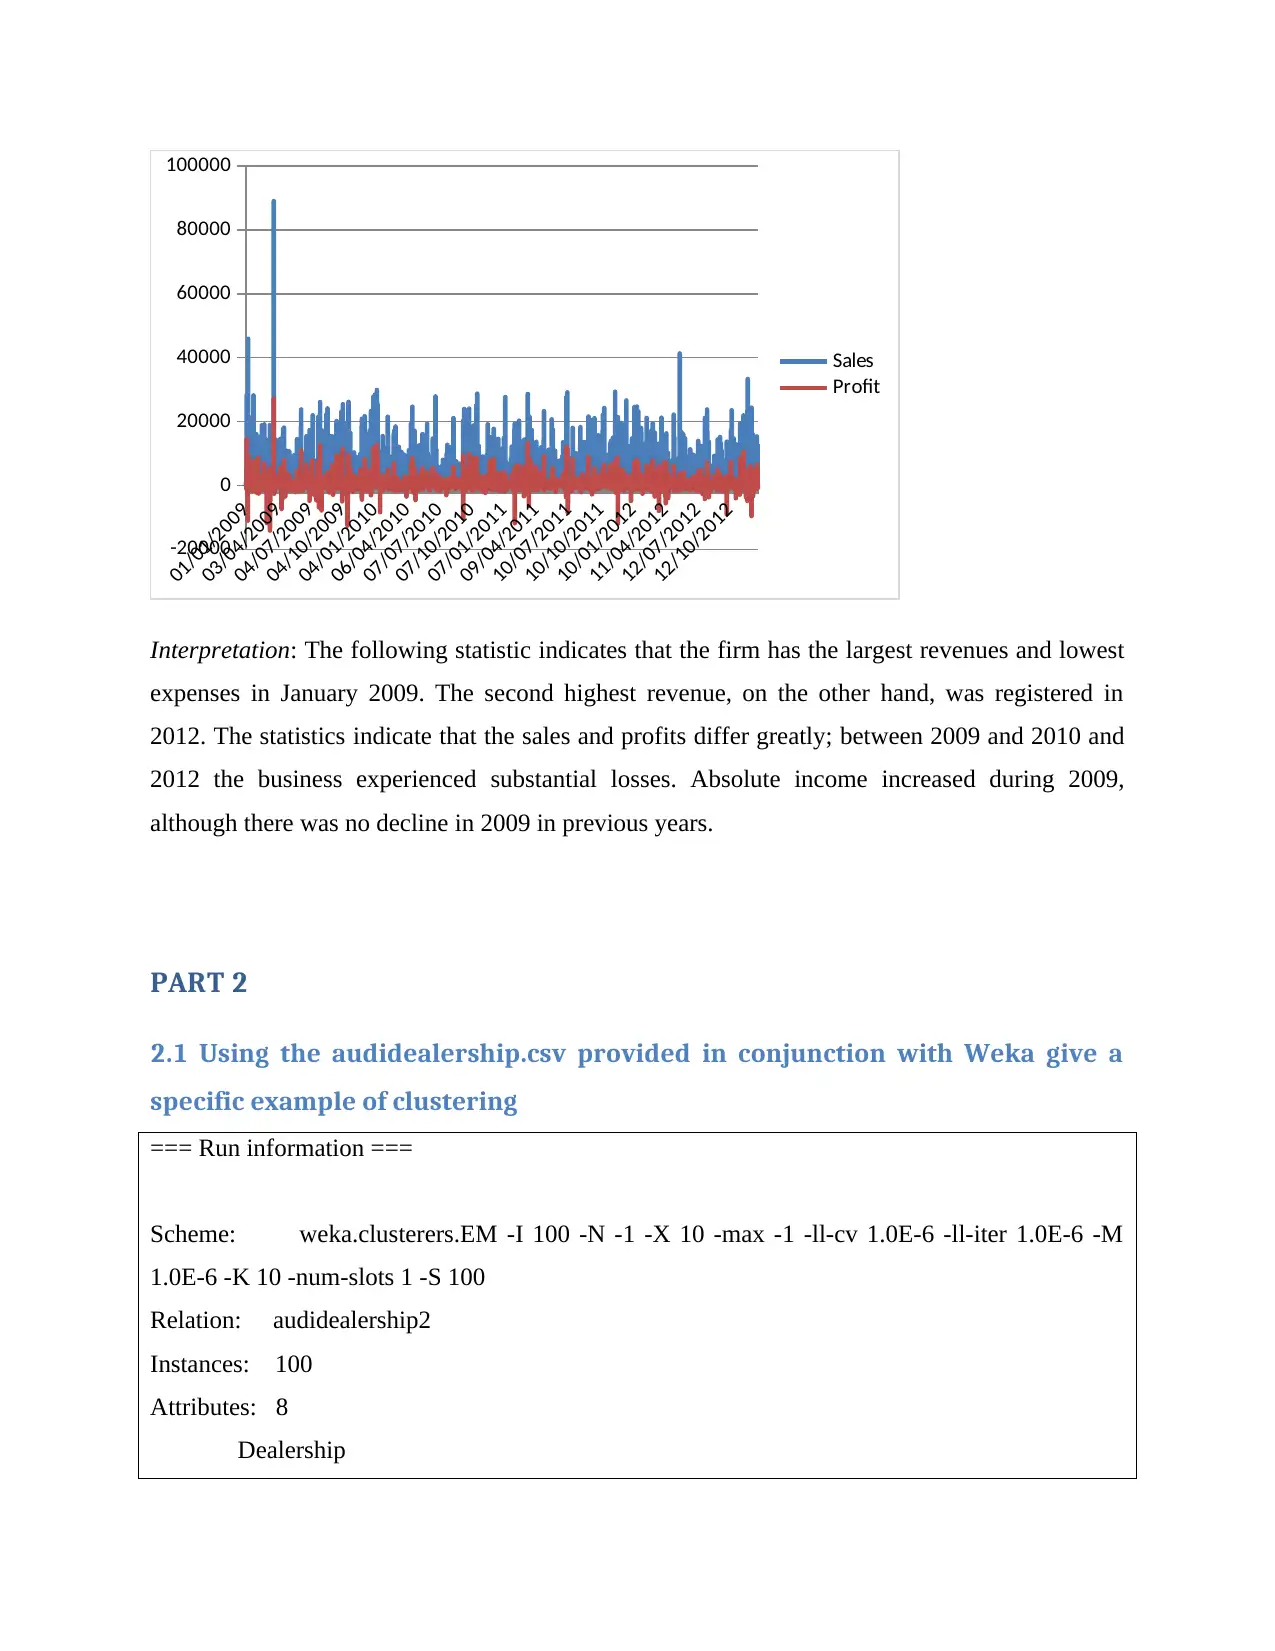
Interpretation: The following statistic indicates that the firm has the largest revenues and lowest
expenses in January 2009. The second highest revenue, on the other hand, was registered in
2012. The statistics indicate that the sales and profits differ greatly; between 2009 and 2010 and
2012 the business experienced substantial losses. Absolute income increased during 2009,
although there was no decline in 2009 in previous years.
PART 2
2.1 Using the audidealership.csv provided in conjunction with Weka give a
specific example of clustering
=== Run information ===
Scheme: weka.clusterers.EM -I 100 -N -1 -X 10 -max -1 -ll-cv 1.0E-6 -ll-iter 1.0E-6 -M
1.0E-6 -K 10 -num-slots 1 -S 100
Relation: audidealership2
Instances: 100
Attributes: 8
Dealership
03/04/2009
04/07/2009
04/10/2009
04/01/2010
06/04/2010
07/07/2010
07/10/2010
07/01/2011
09/04/2011
10/07/2011
10/10/2011
10/01/2012
11/04/2012
12/07/2012
12/10/2012
-20000
0
20000
40000
60000
80000
100000
Sales
Profit
Interpretation: The following statistic indicates that the firm has the largest revenues and lowest
expenses in January 2009. The second highest revenue, on the other hand, was registered in
2012. The statistics indicate that the sales and profits differ greatly; between 2009 and 2010 and
2012 the business experienced substantial losses. Absolute income increased during 2009,
although there was no decline in 2009 in previous years.
PART 2
2.1 Using the audidealership.csv provided in conjunction with Weka give a
specific example of clustering
=== Run information ===
Scheme: weka.clusterers.EM -I 100 -N -1 -X 10 -max -1 -ll-cv 1.0E-6 -ll-iter 1.0E-6 -M
1.0E-6 -K 10 -num-slots 1 -S 100
Relation: audidealership2
Instances: 100
Attributes: 8
Dealership
⊘ This is a preview!⊘
Do you want full access?
Subscribe today to unlock all pages.
Trusted by 1+ million students worldwide
Showroom
Internet Search
RS7
A4
TT
Financing
Purchase
Test mode: evaluate on training data
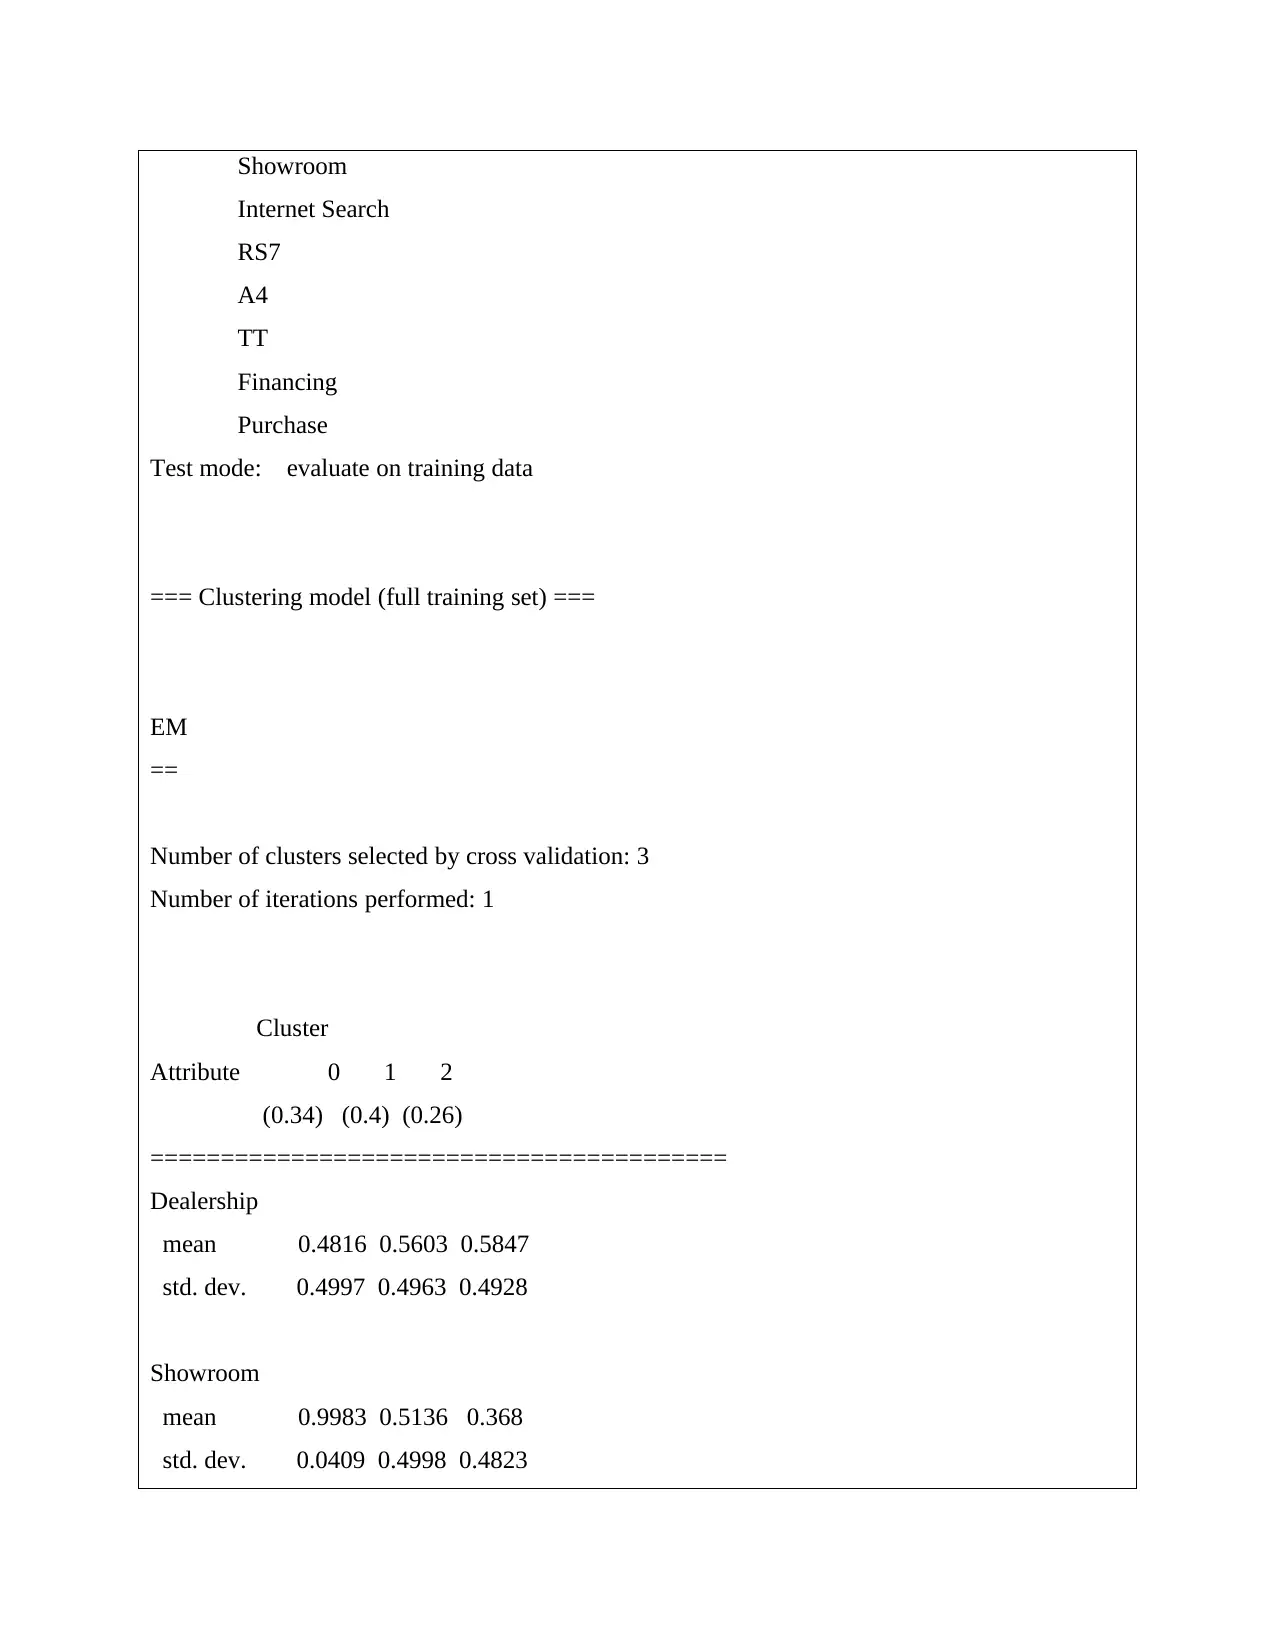
=== Clustering model (full training set) ===
EM
==
Number of clusters selected by cross validation: 3
Number of iterations performed: 1
Cluster
Attribute 0 1 2
(0.34) (0.4) (0.26)
=========================================
Dealership
mean 0.4816 0.5603 0.5847
std. dev. 0.4997 0.4963 0.4928
Showroom
mean 0.9983 0.5136 0.368
std. dev. 0.0409 0.4998 0.4823
Internet Search
RS7
A4
TT
Financing
Purchase
Test mode: evaluate on training data
=== Clustering model (full training set) ===
EM
==
Number of clusters selected by cross validation: 3
Number of iterations performed: 1
Cluster
Attribute 0 1 2
(0.34) (0.4) (0.26)
=========================================
Dealership
mean 0.4816 0.5603 0.5847
std. dev. 0.4997 0.4963 0.4928
Showroom
mean 0.9983 0.5136 0.368
std. dev. 0.0409 0.4998 0.4823
Paraphrase This Document
Need a fresh take? Get an instant paraphrase of this document with our AI Paraphraser
Internet Search
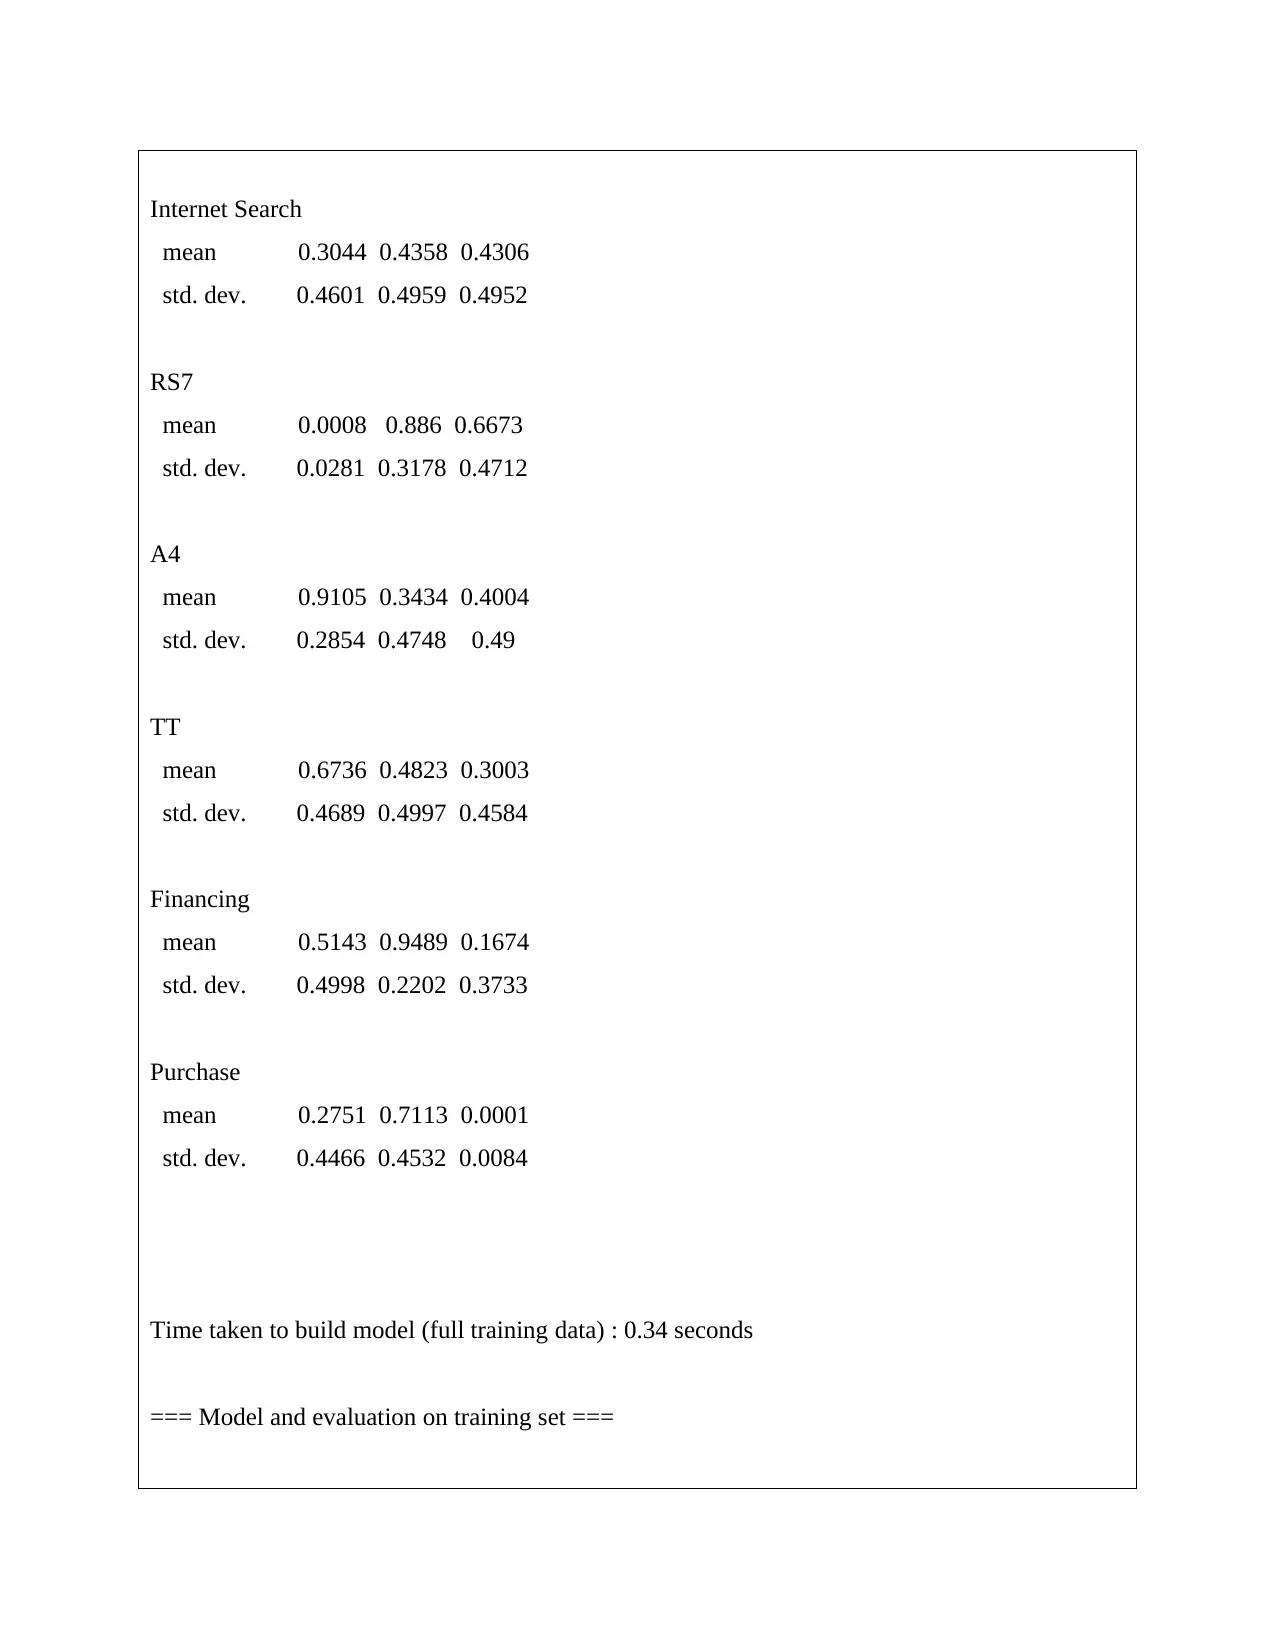
mean 0.3044 0.4358 0.4306
std. dev. 0.4601 0.4959 0.4952
RS7
mean 0.0008 0.886 0.6673
std. dev. 0.0281 0.3178 0.4712
A4
mean 0.9105 0.3434 0.4004
std. dev. 0.2854 0.4748 0.49
TT
mean 0.6736 0.4823 0.3003
std. dev. 0.4689 0.4997 0.4584
Financing
mean 0.5143 0.9489 0.1674
std. dev. 0.4998 0.2202 0.3733
Purchase
mean 0.2751 0.7113 0.0001
std. dev. 0.4466 0.4532 0.0084
Time taken to build model (full training data) : 0.34 seconds
=== Model and evaluation on training set ===
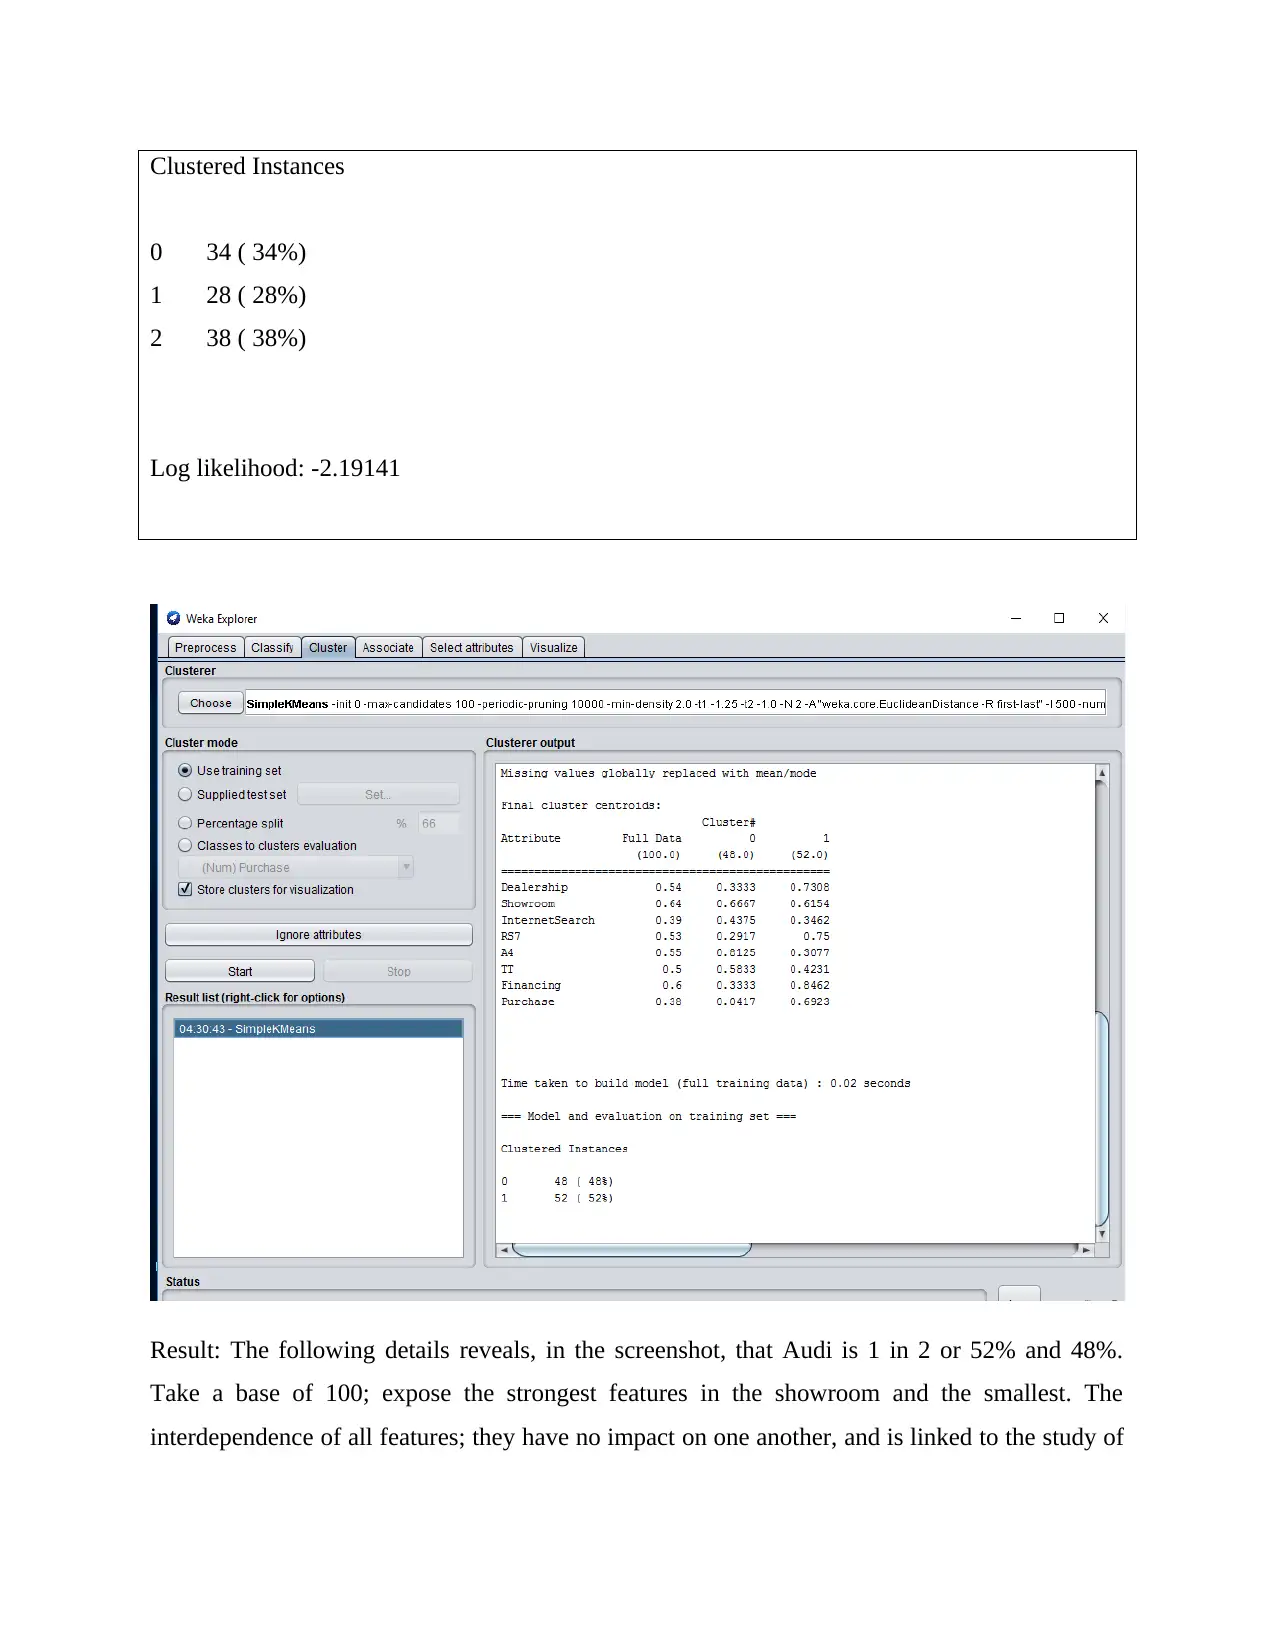
Clustered Instances
0 34 ( 34%)
1 28 ( 28%)
2 38 ( 38%)
Log likelihood: -2.19141
Result: The following details reveals, in the screenshot, that Audi is 1 in 2 or 52% and 48%.
Take a base of 100; expose the strongest features in the showroom and the smallest. The
interdependence of all features; they have no impact on one another, and is linked to the study of
⊘ This is a preview!⊘
Do you want full access?
Subscribe today to unlock all pages.
Trusted by 1+ million students worldwide
average and natural variations. The Audi car buyer's purchase choice does not impact these
variables.
2.2 Explain the most common data mining methods that can be used in
business with real world examples
Data mining techniques- In order to use sophisticated techniques for evaluating data in broader,
historically documented, and existing data sets, correlations and comparisons must be exploited.
These methods include computational structures, algorithm lectures and mathematics, such as
neural networks and decision-making bodies (Van Der Aalst, 2016). For data mining,
interpretation and evaluation are also relevant. Across different fields and museums, scientific
advances have contributed to significant numbers. Relevant data that can potentially be included
in the decision-making and business activities will also be gathered and used. Data mining is the
method for collecting massive data from information and trends. The retrieval of knowledge
involves data collection, recovery, evaluation and analysis. Experiments / models are also
referred to as information mining. The mining of data is a rational method of discovering
valuable knowledge. Decisions on the growth of an organization may be taken until
understanding and trends are identified. The data mining software follow the unique
specifications of the business which are very challenging to satisfy. Potential templates would
also encourage traders to consider proactively. Three steps are needed in data mining:
Exploration- At this point, the data are cleared and transformed. This is also measured the
nature of the results.
Pattern Recognition- The next move is to pick the template that makes the forecast the
strongest.
Deployment- to produce the necessary effects, established trends are used.
Data mining technique- Application of the correct data mining technologies is one of the
industry's most important activities. The technology for data mining will be chosen by
competition and problem form of the organization (Gabrio, Mason and Baio, 2017). To increase
the accuracy and cost efficiency of usage, a structured approach will be used. Seven key data
mining techniques are discussed in this article. Although data mining of some other kind is still
possible, 7 are commonly used by companies.
Paraphrase This Document
Need a fresh take? Get an instant paraphrase of this document with our AI Paraphraser
1. Statistical Techniques- The statistical environment faces the same big problem as data
science for any given period: how reliably conclusions are to be drawn from insufficient earth-
consciousness. A short and reliable explanation for the relationship between findings and
conclusions is the most critical approach to statistics. This text follows the same procedure and
addresses a variety of basic problems resulting from empirical data: management of theories,
estimating confidence and uncertain calculation of numbers. Data mining is a division that
gathers and describes findings of mathematical mathematics. Computing methods are another
approach that is not considered by others as data extraction approaches. However, it also
facilitates the study of statistical models and trends. The data scientist would also want to be
attentive to other approaches to mathematics. Currently the world comprises huge volumes of
data and essential data processing trends. Statistics can make it simpler to tackle data issues.
• What is the data network trend?
• How many occasions this could occur?
• What are the big patterns of the company?
• What is a high-level description of what is found in the document.
Not just the statistics, but even the measures and experiments resolve these queries. This also
facilitates the processing of data. Specific information is essential, but the most significant and
useful technologies are the data collection and counting. The truth will allow wise choices. Like
certain forms of data collection.
2. Clustering Techniques- One of the core techniques of data mining is clustering. Clustering is
the mechanism by which data is grouped equally (Aditsania and Saonard, 2017). It provides
explanation of discrepancies and associations between tests. This is often called segmentation,
which helps users to identify the activities of the database. Insurers can, for example, identify
their clients by jobs, age, insurance and form of claims. Several cluster methods are available:
I. Division methods
II. Hierarchical agglomerative methods
III. Density based methods
IV. Grid based methods
V. Model based methods
3. View- The easiest approach to understand data structures is to imagine them. This method is
seen in the outset of data mining. Many academic projects are currently creating novel activities,
known as chases. Many strategies for data mining create valuable trends for analysis. Therefore,
visualization is a methodology that transforms weak data into good data for the use of different
methods in data mining.
4. Induction Decision Tree Technique- A decision tree is a secluded system, so its name means
a tree. In this method, each branch of the tree is used as a classification issue and the tree sheets
are recognized for their database partitions. This approach can be used for the pre-processing and
simulation of exploratory experiments. The decision tree may be viewed as a subset of the initial
dataset for a specific purpose. The proof in the section shows some differences in their
estimation of their results. Decision trees offer the consumer simple results to understand.
5. Neural Network- Neural networks are another important technique which is used primarily
by humans. In early data mining, this approach is common (Sun, Chen and Zhou, 2017). Neural
nets are easy to use because they are programmed, and users don't need to be aware of science or
software. The neural network was created by a group of artificial intelligence. Nevertheless, to
function efficiently in neural networks, users must know:
• How does it link nodes?
• What would be the amount of production units?
• When does training stop?
6. Association Rule Technique- The relationship is formed between two or more objects. The
relationship between various variables in the database is also significant. The evidence for
classifying variables and the repeated presence of different stimuli of the same concentrations is
contained in the database of secret trends.
⊘ This is a preview!⊘
Do you want full access?
Subscribe today to unlock all pages.
Trusted by 1+ million students worldwide
1 out of 14
Related Documents


Your All-in-One AI-Powered Toolkit for Academic Success.
+13062052269
info@desklib.com
Available 24*7 on WhatsApp / Email
![[object Object]](/_next/static/media/star-bottom.7253800d.svg)
Unlock your academic potential
Copyright © 2020–2026 A2Z Services. All Rights Reserved. Developed and managed by ZUCOL.