Data Handling: Excel, Weka, Data Mining, and Clustering Analysis
VerifiedAdded on 2023/01/12
|17
|3915
|25
Homework Assignment
AI Summary
This assignment solution delves into data handling techniques using Microsoft Excel and the Weka data mining tool. Part 1 focuses on Excel, covering data pre-processing, the use of IF and LOOKUP functions, and the creation of charts and graphs for data visualization. Part 2 explores data mining, including a practical example of clustering using the audidealership.csv dataset in Weka. It explains common data mining methods like statistical techniques and decision trees, providing real-world business examples. The solution also compares the advantages and disadvantages of Weka over Excel, providing a comprehensive overview of data analysis and its applications. The solution includes the clustering model, interpretation of results, and a discussion of the strengths and weaknesses of the tools used.

DATA
HANDLING
HANDLING
Paraphrase This Document
Need a fresh take? Get an instant paraphrase of this document with our AI Paraphraser
Table of Contents
PART 1............................................................................................................................................3
1. Use of excel of pre-processing the data...................................................................................3
Use of IF function in Excel......................................................................................................4
Charts and Graphs....................................................................................................................6
PART 2............................................................................................................................................6
2.1 Using the audidealership.csv provided in conjunction with Weka give a specific example
of clustering.................................................................................................................................6
2.2 Explain the most common data mining methods that can be used in business with real
world examples..........................................................................................................................10
2.2.1 Weka J48 algorithm......................................................................................................14
2.2.2 Clustering......................................................................................................................15
2.3 Advantages and disadvantages of Weka over excel............................................................15
REFERENCES..............................................................................................................................17
PART 1
1. Use of excel of pre-processing the data
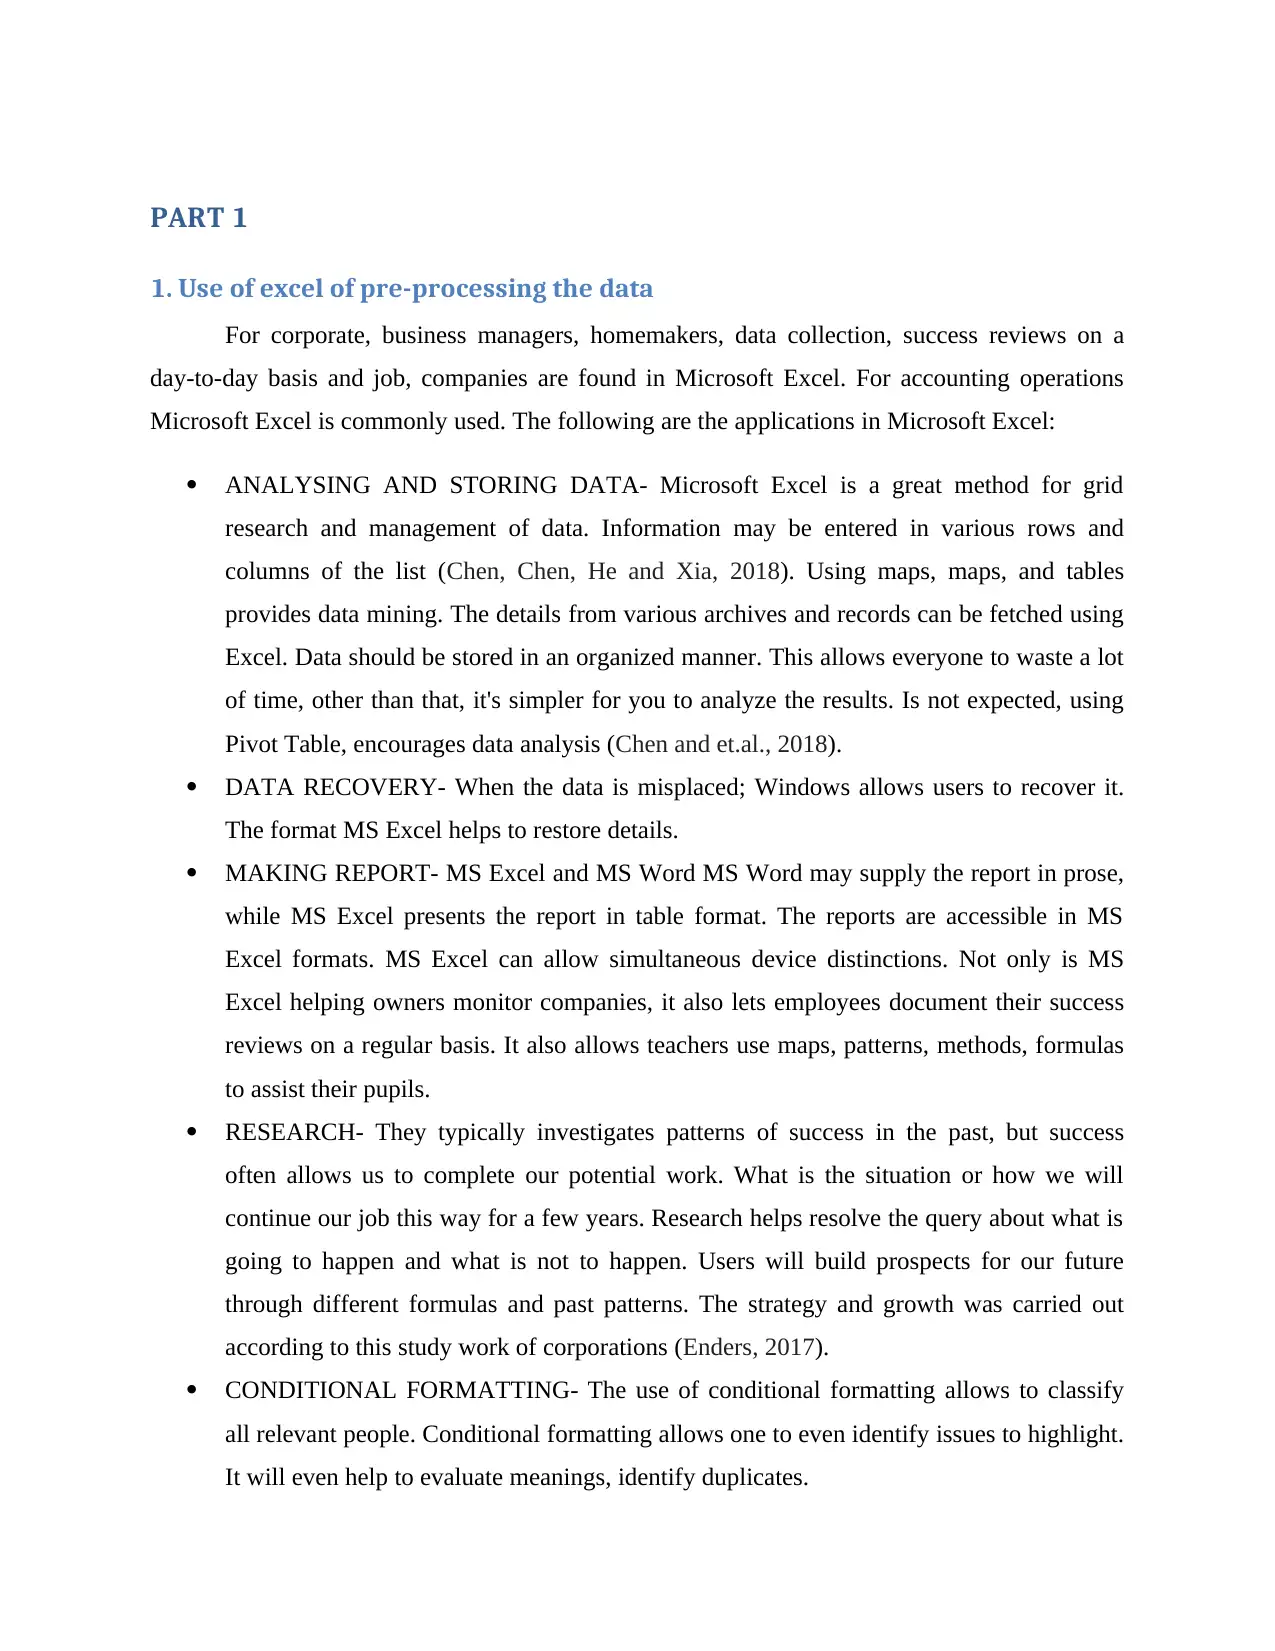
For corporate, business managers, homemakers, data collection, success reviews on a
day-to-day basis and job, companies are found in Microsoft Excel. For accounting operations
Microsoft Excel is commonly used. The following are the applications in Microsoft Excel:
ANALYSING AND STORING DATA- Microsoft Excel is a great method for grid
research and management of data. Information may be entered in various rows and
columns of the list (Chen, Chen, He and Xia, 2018). Using maps, maps, and tables
provides data mining. The details from various archives and records can be fetched using
Excel. Data should be stored in an organized manner. This allows everyone to waste a lot
of time, other than that, it's simpler for you to analyze the results. Is not expected, using
Pivot Table, encourages data analysis (Chen and et.al., 2018).
DATA RECOVERY- When the data is misplaced; Windows allows users to recover it.
The format MS Excel helps to restore details.
MAKING REPORT- MS Excel and MS Word MS Word may supply the report in prose,
while MS Excel presents the report in table format. The reports are accessible in MS
Excel formats. MS Excel can allow simultaneous device distinctions. Not only is MS
Excel helping owners monitor companies, it also lets employees document their success
reviews on a regular basis. It also allows teachers use maps, patterns, methods, formulas
to assist their pupils.
RESEARCH- They typically investigates patterns of success in the past, but success
often allows us to complete our potential work. What is the situation or how we will
continue our job this way for a few years. Research helps resolve the query about what is
going to happen and what is not to happen. Users will build prospects for our future
through different formulas and past patterns. The strategy and growth was carried out
according to this study work of corporations (Enders, 2017).
CONDITIONAL FORMATTING- The use of conditional formatting allows to classify
all relevant people. Conditional formatting allows one to even identify issues to highlight.
It will even help to evaluate meanings, identify duplicates.
1. Use of excel of pre-processing the data
For corporate, business managers, homemakers, data collection, success reviews on a
day-to-day basis and job, companies are found in Microsoft Excel. For accounting operations
Microsoft Excel is commonly used. The following are the applications in Microsoft Excel:
ANALYSING AND STORING DATA- Microsoft Excel is a great method for grid
research and management of data. Information may be entered in various rows and
columns of the list (Chen, Chen, He and Xia, 2018). Using maps, maps, and tables
provides data mining. The details from various archives and records can be fetched using
Excel. Data should be stored in an organized manner. This allows everyone to waste a lot
of time, other than that, it's simpler for you to analyze the results. Is not expected, using
Pivot Table, encourages data analysis (Chen and et.al., 2018).
DATA RECOVERY- When the data is misplaced; Windows allows users to recover it.
The format MS Excel helps to restore details.
MAKING REPORT- MS Excel and MS Word MS Word may supply the report in prose,
while MS Excel presents the report in table format. The reports are accessible in MS
Excel formats. MS Excel can allow simultaneous device distinctions. Not only is MS
Excel helping owners monitor companies, it also lets employees document their success
reviews on a regular basis. It also allows teachers use maps, patterns, methods, formulas
to assist their pupils.
RESEARCH- They typically investigates patterns of success in the past, but success
often allows us to complete our potential work. What is the situation or how we will
continue our job this way for a few years. Research helps resolve the query about what is
going to happen and what is not to happen. Users will build prospects for our future
through different formulas and past patterns. The strategy and growth was carried out
according to this study work of corporations (Enders, 2017).
CONDITIONAL FORMATTING- The use of conditional formatting allows to classify
all relevant people. Conditional formatting allows one to even identify issues to highlight.
It will even help to evaluate meanings, identify duplicates.
⊘ This is a preview!⊘
Do you want full access?
Subscribe today to unlock all pages.
Trusted by 1+ million students worldwide
Security- MS Excel primarily offers protections for Excel files, allowing users to manage
their data safely (Enders, 2017). Everything MS Excel files can be stored in an
outstanding repository by way of the visual basic programming. Within the MS Excel,
people store their vital data in order to maintain their data structured to save time. Most
people like to protect their files so that nobody will access them or destroy them and MS
Excel is really good at solving the issue.
Use of IF function in Excel
The IF function or IF statement in excel is made up of three parts separated by a comma.
• Condition
• When to mean when the requirements have been met
• Where to show if the conditions have not been satisfied
In this case, it can see on which point revenue and earnings have been lowered and on what date
retail purchases are that, and how the IF feature is performed step by stage.
• First copy and paste on different sheets the date of payment, revenue and income.
• Now, first rearrange old-date data by sorting excellence sheet function.
• Pick the cell where the "IF Feature" is generated.
• Type the code in the cell = if (Sort of the condition by viruses: B2>B3,)
• Enter the code which user like to see if the requirement has been reached.
• Select a comma:
• If the requirement has not been met, choose: "Increase"
• Closing the bracket and then click Enter.
• The following IF function would look like this
Paraphrase This Document
Need a fresh take? Get an instant paraphrase of this document with our AI Paraphraser
• When the When function displays the B3 pace or meaning than Decline and if the B3 meaning
is less than B3 than the IF function displays Raise (Sin and Gernaey, 2016). The B1 parameter
also means that the IF parameter is greater than B3.
• User should get the product of the cell B4 after you click the Enter key. Drag the handle from
D4 to cell D8400 if user wants to see the impact.
If users’ in an interview which needs strong information, user won't be shocked to first inquire
what H Lookup and V Lookup are. Whether user likes it or not, it is almost an indispensable
skill. It is quick to notice something in the details if you deal with tiny numbers. This would also
take a great deal of time to locate something in the data as the data expands (Short and Kaluvuri,
SAP SE, 2017).
Lookup Value- The base factor or search parameter in the row. That is the table's reference
point.
Table series- The table containing the values of your goals. It is raw knowledge for you to pick
from the table everything you want.
Row index number- It indicates the goal value in the row amounts. The first row is 1.
Range_ lookup]: It consists of two sets one is right (1) and the other is incorrect (0), which
looks for an identical match in the list. This is the second match in the list.
Demonstration of Look up function on given situation of Superstore Sale:
Using the same excel sheet, the following steps will be taken:
Lookup Value- The Excel LOOKUP method carries out a matching quest in a single column or
row field, and returns the equivalent value from another one column or row field (Ebtehaj,
Bonakdari and Gharabaghi, 2018). The default behavior of LOOKUP allows it easy for Excel to
fix those problems. For the date of order, revenue and income choose Cell G2, H2 and I2. On
G3, H3 and I3 the effects can be shown. Select H3 cell and place Lookup function; pick G3 cell
as Lookup key.
Table series- Choose from A2 to C8400 (A2:C8400) for the entire range.
[Range_ lookup]: Select cell for purchases, B2 to B8400 (B2:B8400).
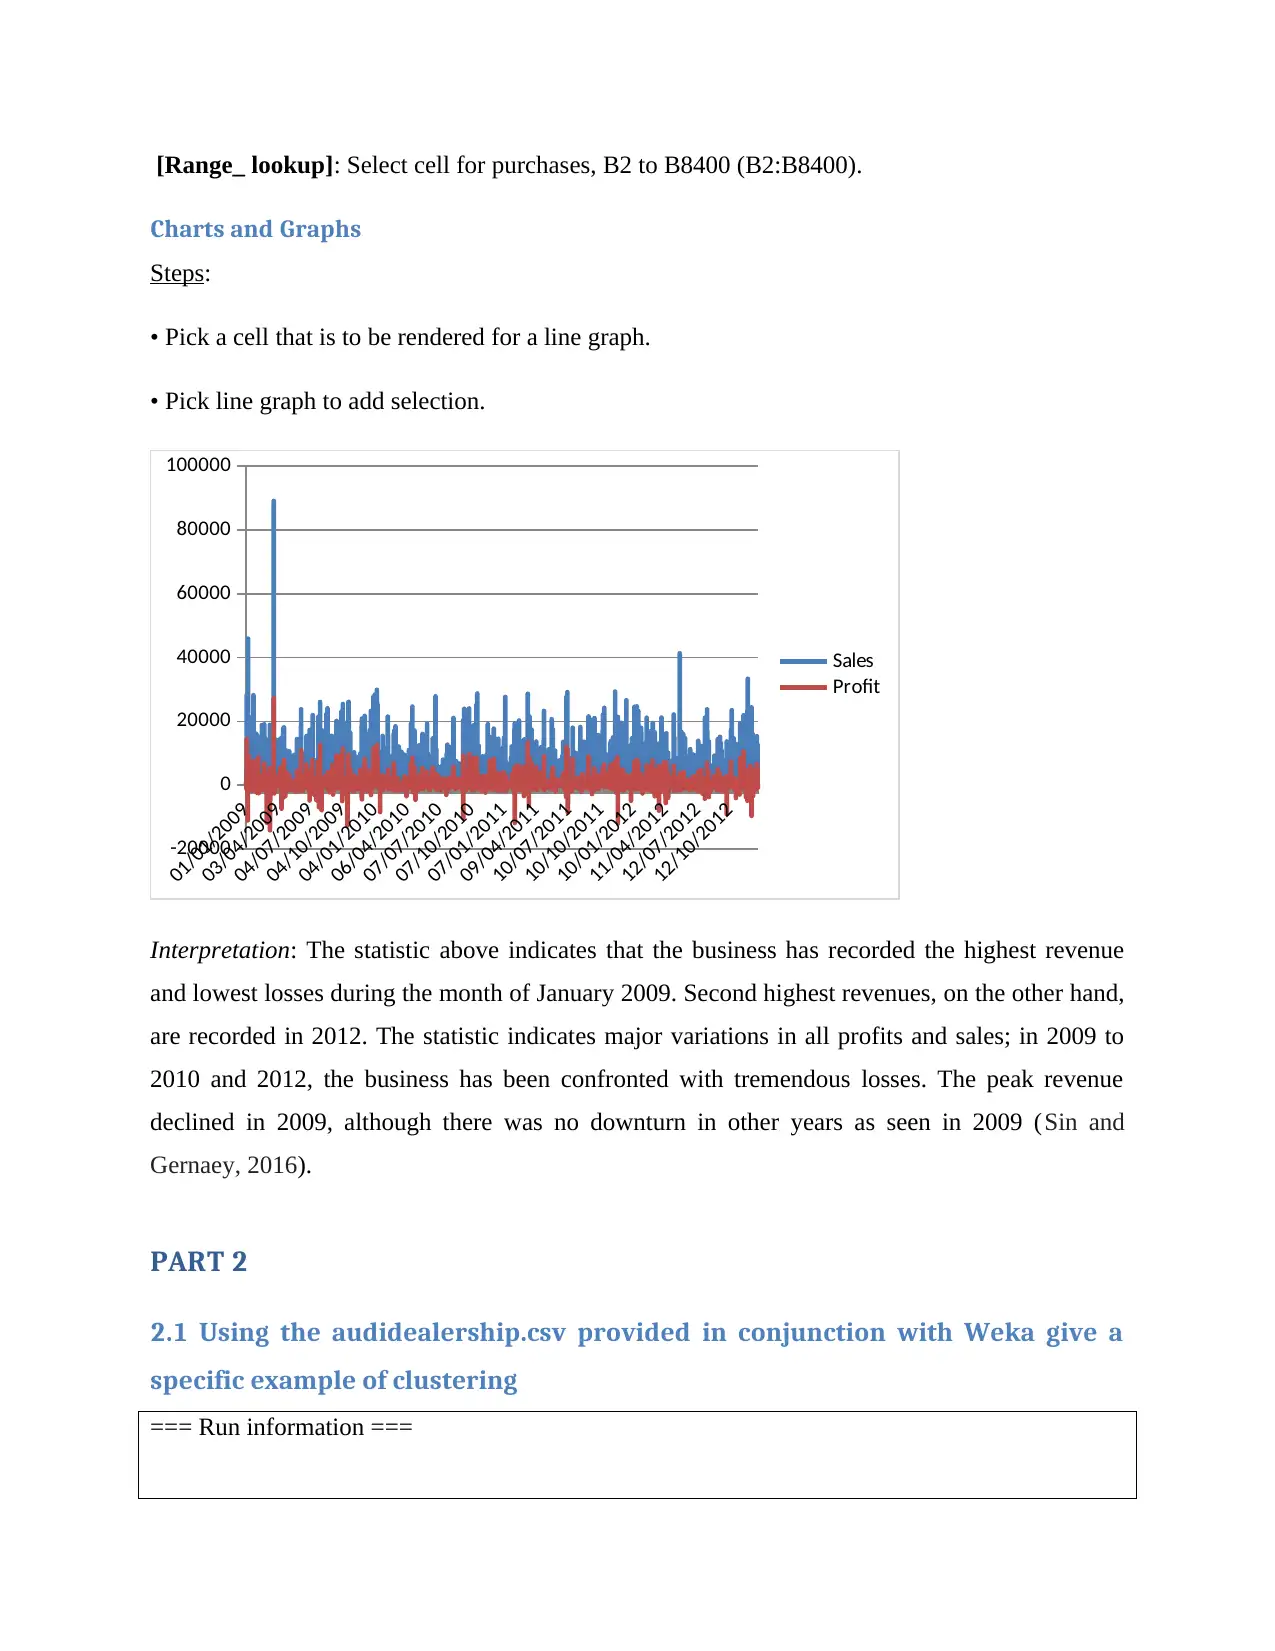
Charts and Graphs
Steps:
• Pick a cell that is to be rendered for a line graph.
• Pick line graph to add selection.
01/01/2009
03/04/2009
04/07/2009
04/10/2009
04/01/2010
06/04/2010
07/07/2010
07/10/2010
07/01/2011
09/04/2011
10/07/2011
10/10/2011
10/01/2012
11/04/2012
12/07/2012
12/10/2012
-20000
0
20000
40000
60000
80000
100000
Sales
Profit
Interpretation: The statistic above indicates that the business has recorded the highest revenue
and lowest losses during the month of January 2009. Second highest revenues, on the other hand,
are recorded in 2012. The statistic indicates major variations in all profits and sales; in 2009 to
2010 and 2012, the business has been confronted with tremendous losses. The peak revenue
declined in 2009, although there was no downturn in other years as seen in 2009 (Sin and
Gernaey, 2016).
PART 2
2.1 Using the audidealership.csv provided in conjunction with Weka give a
specific example of clustering
=== Run information ===
⊘ This is a preview!⊘
Do you want full access?
Subscribe today to unlock all pages.
Trusted by 1+ million students worldwide
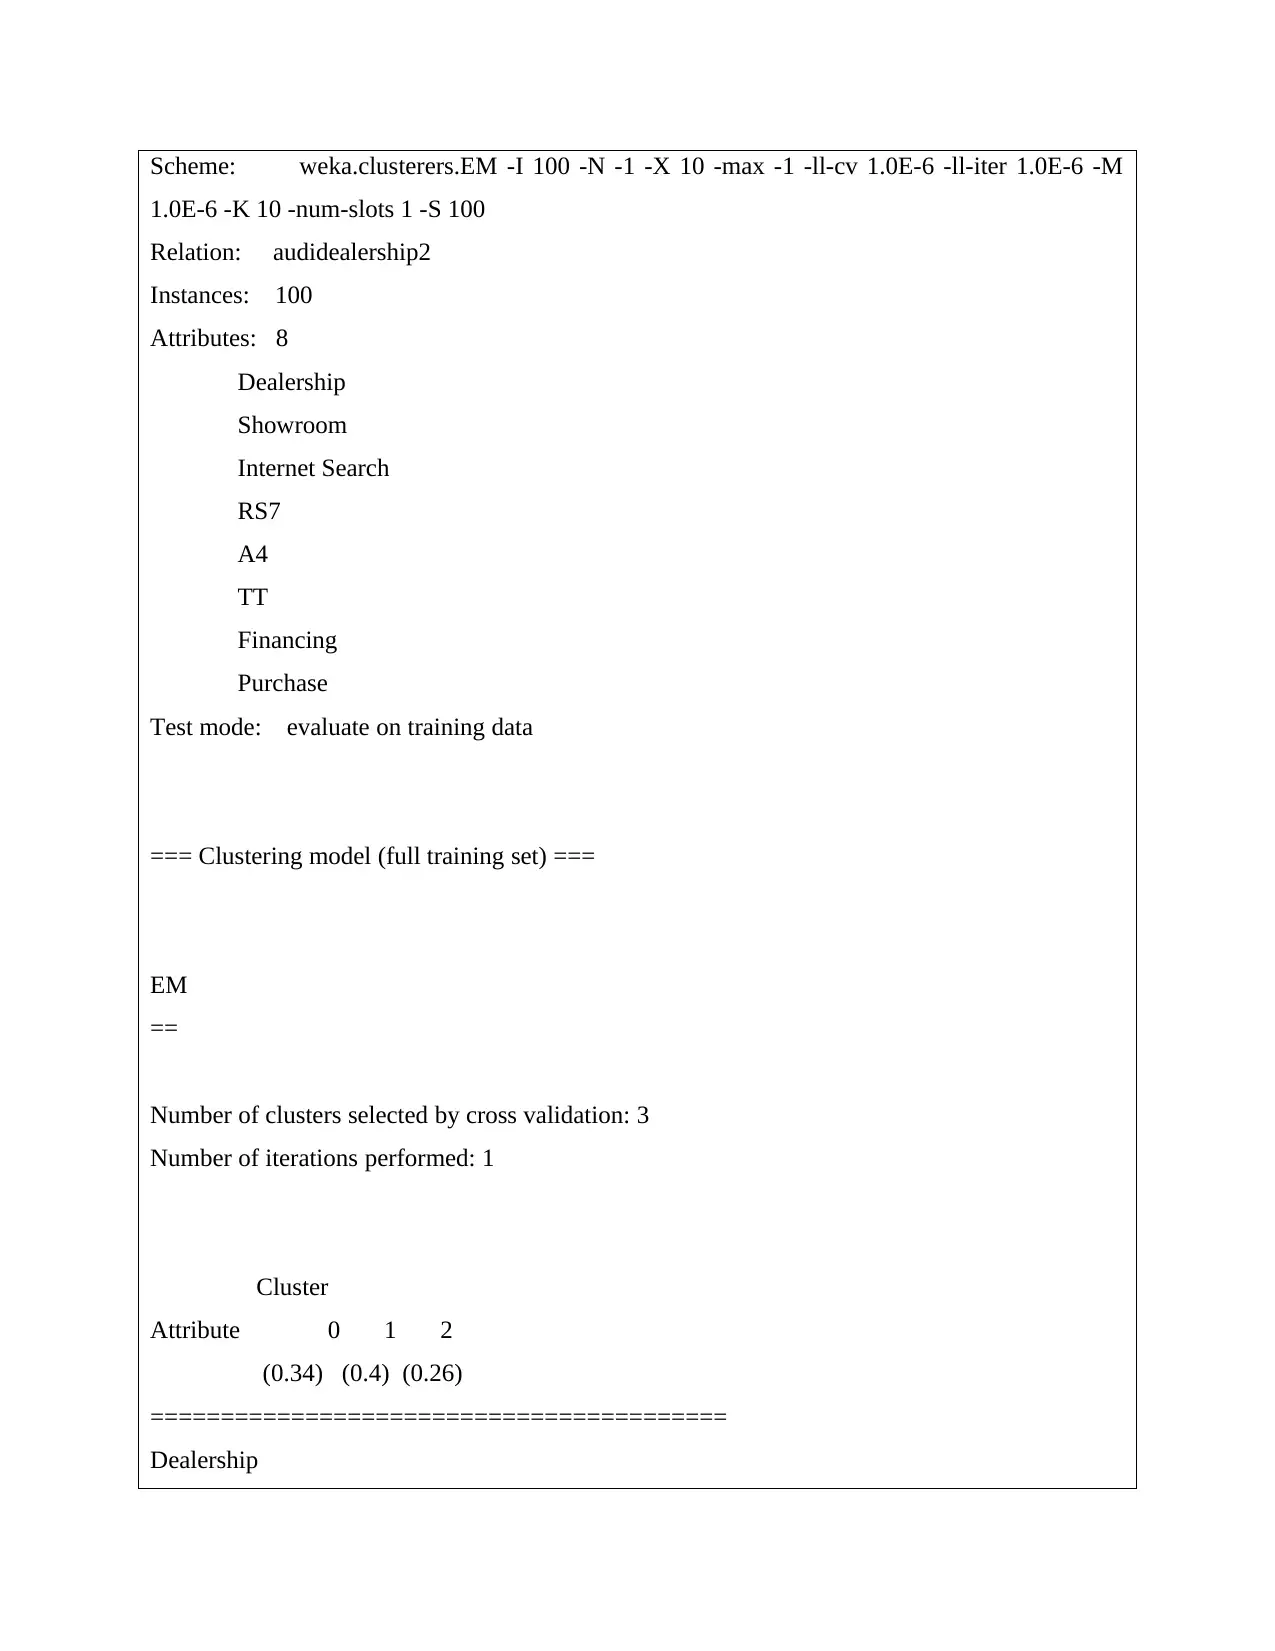
Scheme: weka.clusterers.EM -I 100 -N -1 -X 10 -max -1 -ll-cv 1.0E-6 -ll-iter 1.0E-6 -M
1.0E-6 -K 10 -num-slots 1 -S 100
Relation: audidealership2
Instances: 100
Attributes: 8
Dealership
Showroom
Internet Search
RS7
A4
TT
Financing
Purchase
Test mode: evaluate on training data
=== Clustering model (full training set) ===
EM
==
Number of clusters selected by cross validation: 3
Number of iterations performed: 1
Cluster
Attribute 0 1 2
(0.34) (0.4) (0.26)
=========================================
Dealership
Paraphrase This Document
Need a fresh take? Get an instant paraphrase of this document with our AI Paraphraser
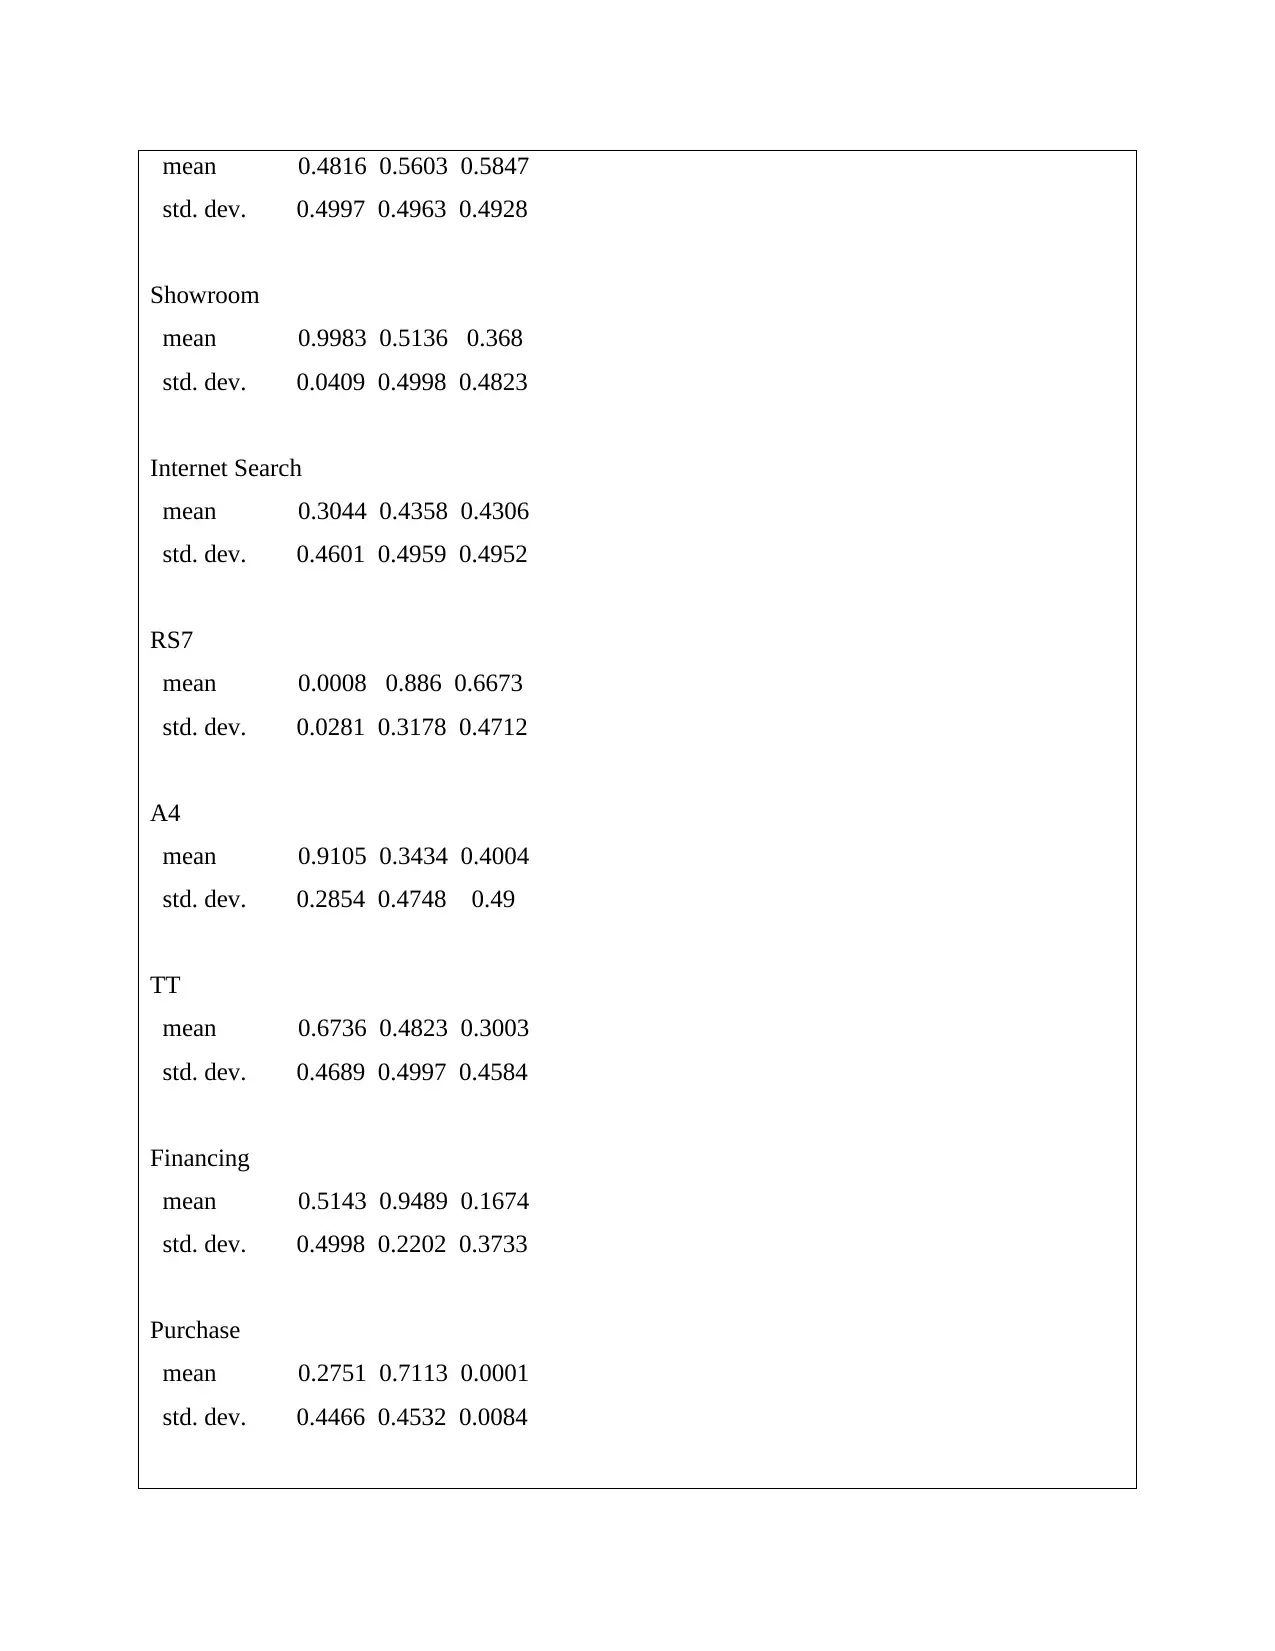
mean 0.4816 0.5603 0.5847
std. dev. 0.4997 0.4963 0.4928
Showroom
mean 0.9983 0.5136 0.368
std. dev. 0.0409 0.4998 0.4823
Internet Search
mean 0.3044 0.4358 0.4306
std. dev. 0.4601 0.4959 0.4952
RS7
mean 0.0008 0.886 0.6673
std. dev. 0.0281 0.3178 0.4712
A4
mean 0.9105 0.3434 0.4004
std. dev. 0.2854 0.4748 0.49
TT
mean 0.6736 0.4823 0.3003
std. dev. 0.4689 0.4997 0.4584
Financing
mean 0.5143 0.9489 0.1674
std. dev. 0.4998 0.2202 0.3733
Purchase
mean 0.2751 0.7113 0.0001
std. dev. 0.4466 0.4532 0.0084
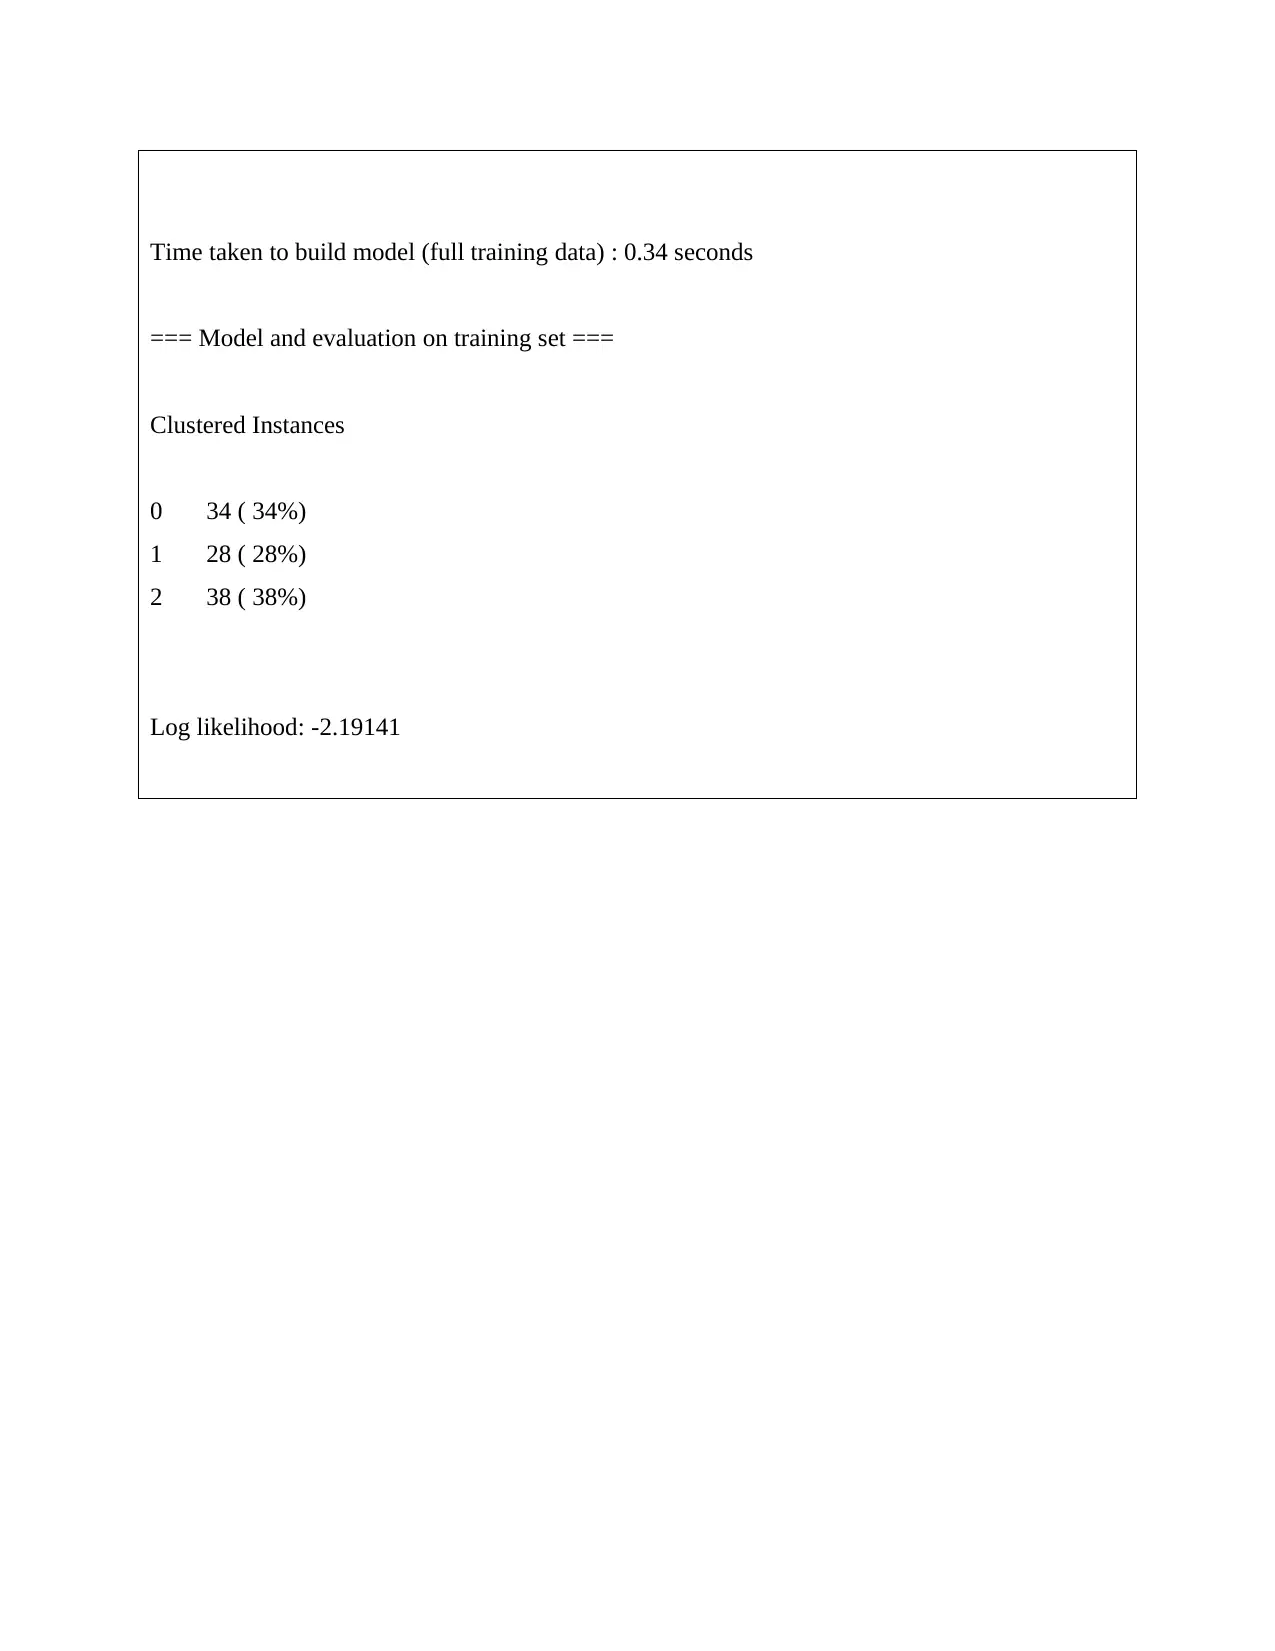
Time taken to build model (full training data) : 0.34 seconds
=== Model and evaluation on training set ===
Clustered Instances
0 34 ( 34%)
1 28 ( 28%)
2 38 ( 38%)
Log likelihood: -2.19141
=== Model and evaluation on training set ===
Clustered Instances
0 34 ( 34%)
1 28 ( 28%)
2 38 ( 38%)
Log likelihood: -2.19141
⊘ This is a preview!⊘
Do you want full access?
Subscribe today to unlock all pages.
Trusted by 1+ million students worldwide
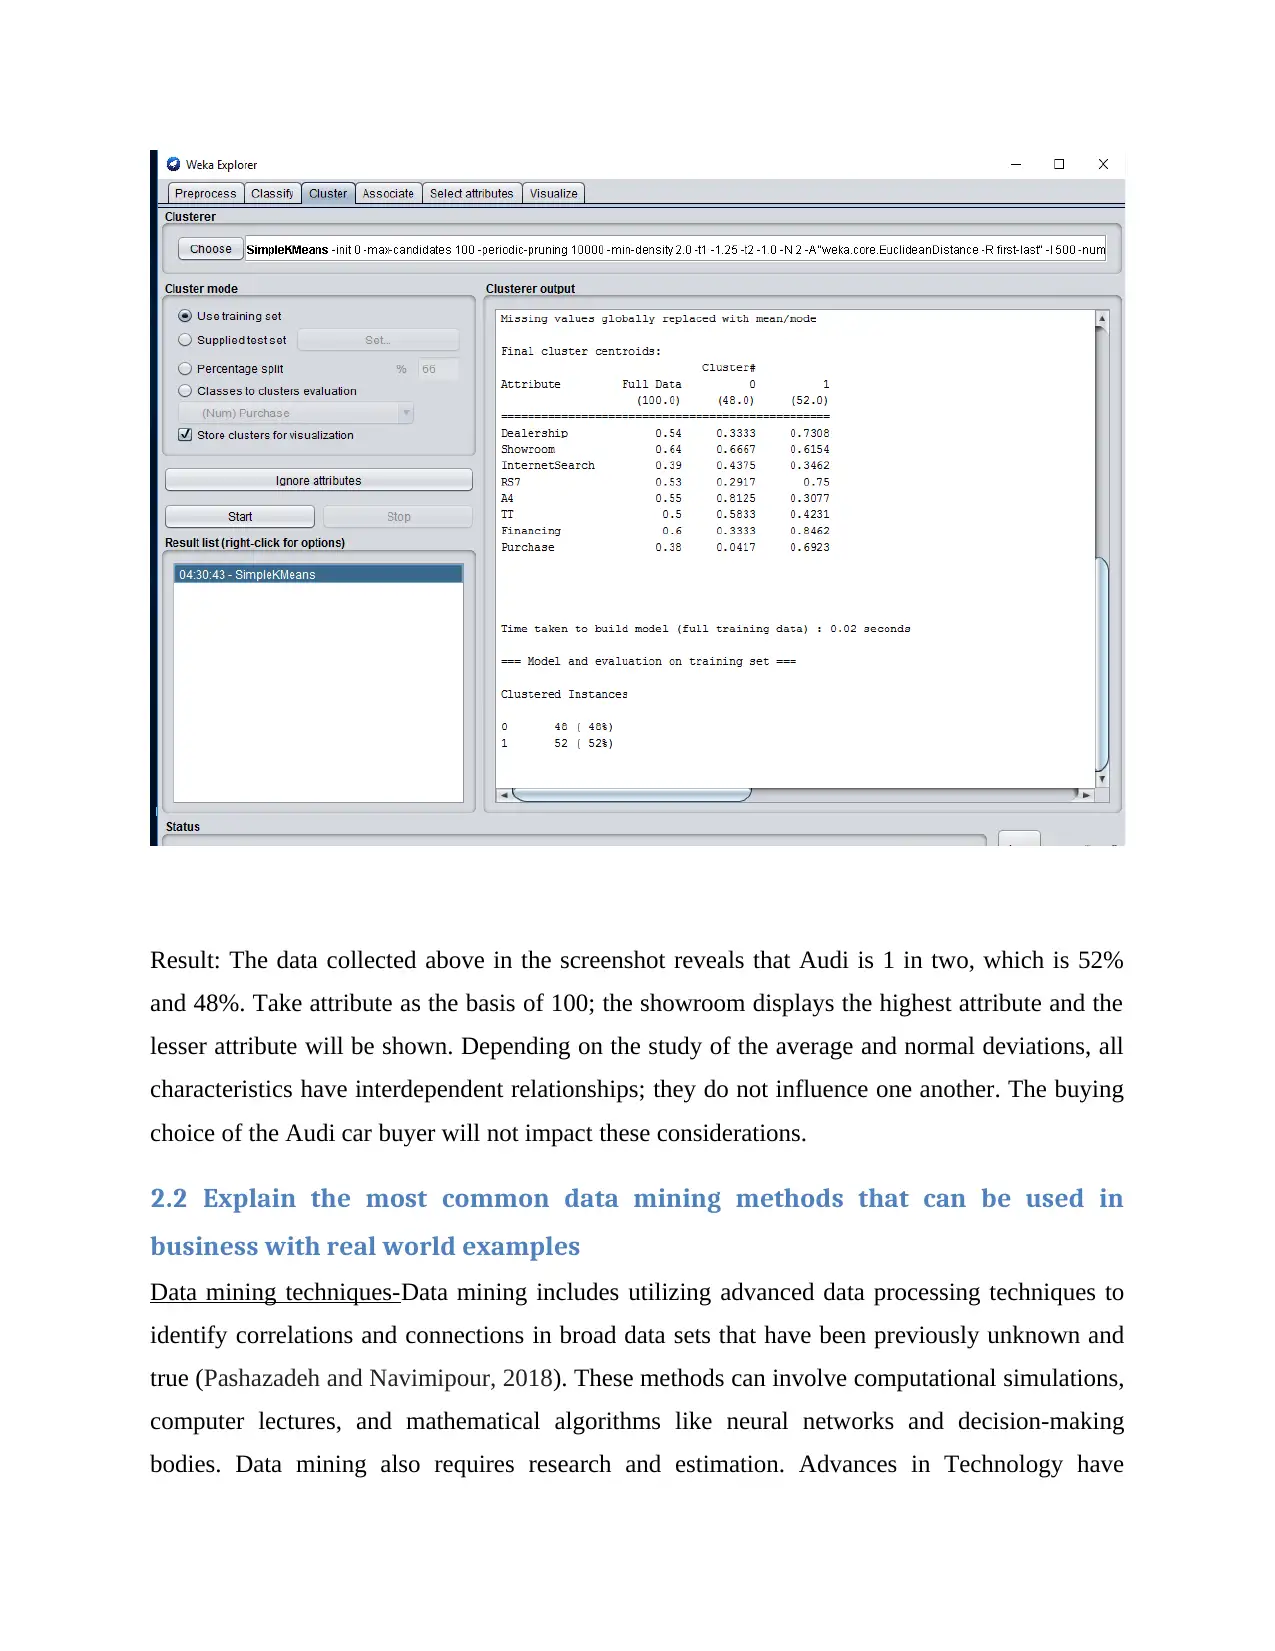
Result: The data collected above in the screenshot reveals that Audi is 1 in two, which is 52%
and 48%. Take attribute as the basis of 100; the showroom displays the highest attribute and the
lesser attribute will be shown. Depending on the study of the average and normal deviations, all
characteristics have interdependent relationships; they do not influence one another. The buying
choice of the Audi car buyer will not impact these considerations.
2.2 Explain the most common data mining methods that can be used in
business with real world examples
Data mining techniques-Data mining includes utilizing advanced data processing techniques to
identify correlations and connections in broad data sets that have been previously unknown and
true (Pashazadeh and Navimipour, 2018). These methods can involve computational simulations,
computer lectures, and mathematical algorithms like neural networks and decision-making
bodies. Data mining also requires research and estimation. Advances in Technology have
Paraphrase This Document
Need a fresh take? Get an instant paraphrase of this document with our AI Paraphraser
culminated in vast amounts of repositories in diverse fields. Consequently, essential information
that can be subsequently included in decision-making and company operations needs to be
processed and exploited. Data mining is the mechanism by which knowledge and trends from
enormous data are collected. The compilation, retrieval, reviews and analytics of data includes
data mining. The research or study of research / patterns is also regarded as information mining.
Information mining. In order to locate valuable data, data mining is a rational operation. If
knowledge and trends have been discovered, decisions may be made for the growth of a product.
Data mining tools will respond to your specific business concerns that have been very
challenging to overcome. We also anticipate future trends to allow traders to determine
proactively. There are three phases involved in data mining:
Exploration- During this process, the data is cleared and converted. It also decides the nature of
the results.
Pattern Recognition - The next move is to pick the pattern that allows the strongest prediction.
Deployment- To achieve the required outcomes, known trends is used.
Data mining technique- The choosing of the correct data mining technologies is one of the most
critical tasks in the industry (Blann, 2018). The technologies of data mining must be chosen
depending on the business and form of question the organization faces. To boost the precision
and cost-effectiveness of usage, a generic solution will be used. Essentially, this essay addresses
seven key data mining techniques. There are also several other forms of data mining, but these
seven are commonly used by business people.
1. Statistical Techniques- The field of statistics has been posing the same main problem as data
science for some time: how to make clear conclusions from insufficient knowledge about the
planet. A concise and reliable vocabulary to explain the relation between findings and
assumptions is among the most valuable contributions to statistics. This text carries on in the
same tradition and reflects on a variety of core problems from observational data: hypothesis
checking, trust assessment and the calculation of uncertain numbers. Data mining is a statistical
mathematics branch dealing with data collection and description. By other methods,
computational approaches are not considered by others as data mining methods. Nevertheless, it
also promotes the creation of trends and statistical models. This is why the data scientist must be
conscious of various methods in statistics. The world of today has large volumes of data to work
with and essential trends to collect. Stats can help you address questions regarding the data more
effectively.
• What is the data network pattern?
• How probable is this to occur?
• What are the most valuable trends for companies?
• What is a high level overview that offers you an insight into what the document contains?
Not only do the statistics react to these problems, they help to quantify and count the results. It
also promotes the collection of data details. There are different types of information, but the most
important and useful technique is data collection and counting. Smart decisions can be taken
through statistical reports. As other methods to gather knowledge.
2. Clustering Techniques
One of the common methods used in data mining is clustering. Analyzes of clustering is the
mechanism by which data are classified similarly (Mack, 2016). This helps to understand the
similarities and differences among the results. Often that is called segmentation which
encourages users to comprehend the activities in the database. Insurers, for example, will group
their consumers according to their employment, age, insurance structure and the form of claims.
There are different ways of clustering:
I. Division methods
II. Hierarchical agglomerative methods
III. Density based methods
IV. Grid based methods
V. Model based methods
3. View
The simplest method for identifying data trends is visualization. This approach is used at
the outset of the process of data mining. These days several academic programs are ongoing to
⊘ This is a preview!⊘
Do you want full access?
Subscribe today to unlock all pages.
Trusted by 1+ million students worldwide
1 out of 17
Related Documents


Your All-in-One AI-Powered Toolkit for Academic Success.
+13062052269
info@desklib.com
Available 24*7 on WhatsApp / Email
![[object Object]](/_next/static/media/star-bottom.7253800d.svg)
Unlock your academic potential
Copyright © 2020–2026 A2Z Services. All Rights Reserved. Developed and managed by ZUCOL.