Data Handling and Business Intelligence: Sales and Profit Analysis
VerifiedAdded on 2023/06/18
|16
|3368
|303
Report
AI Summary
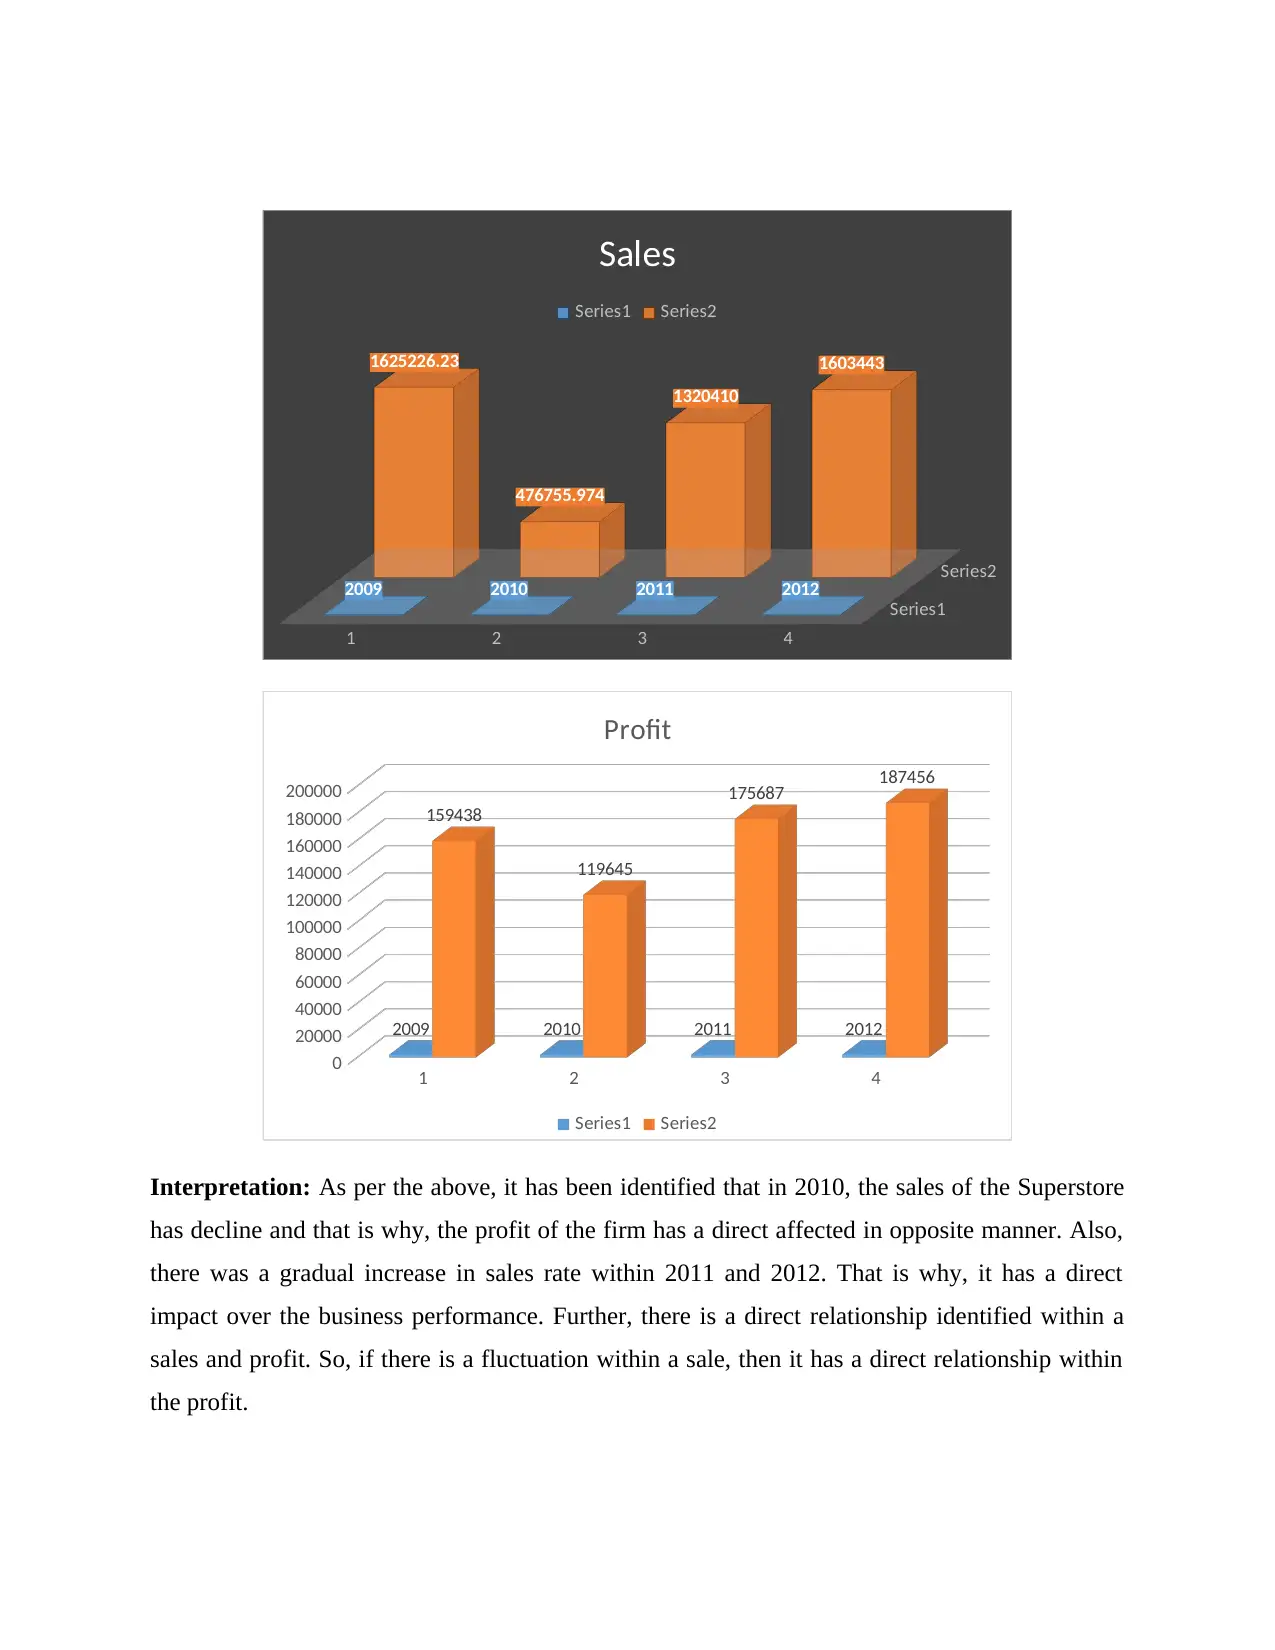
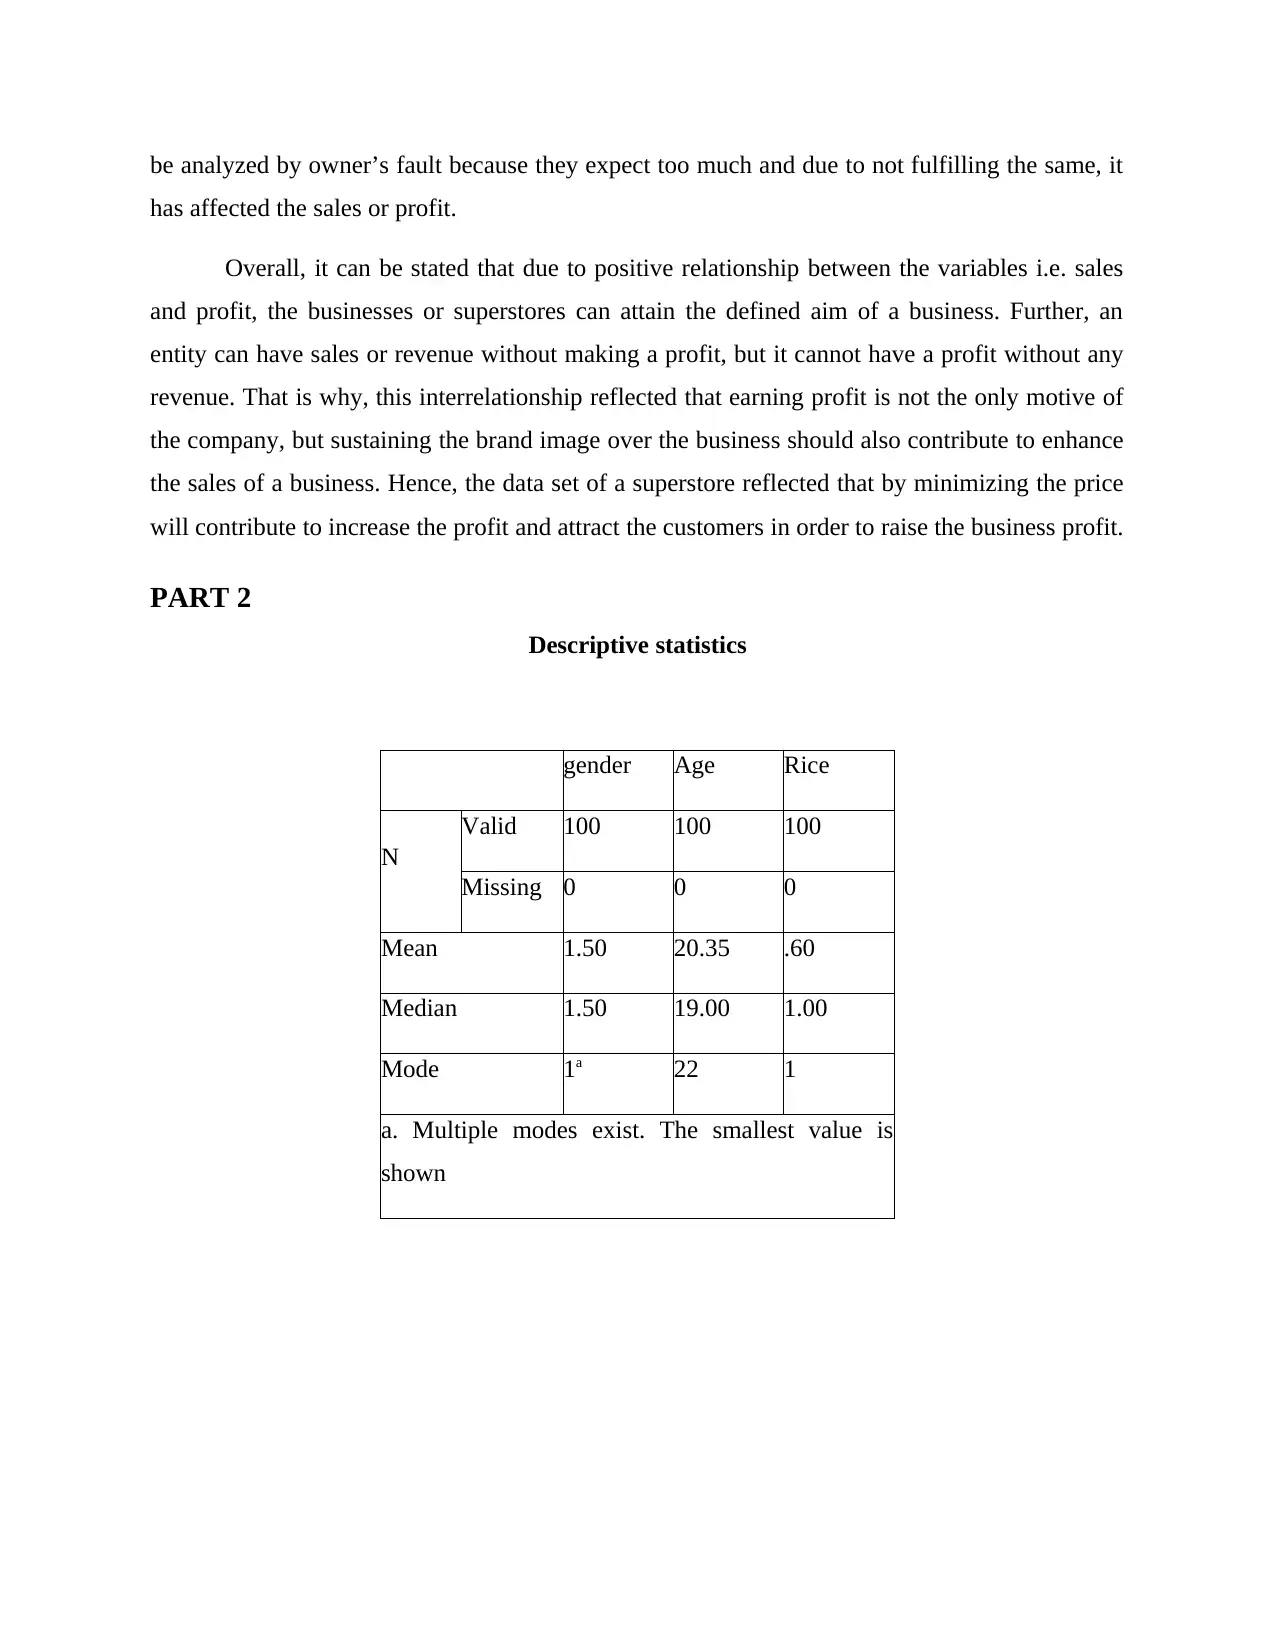
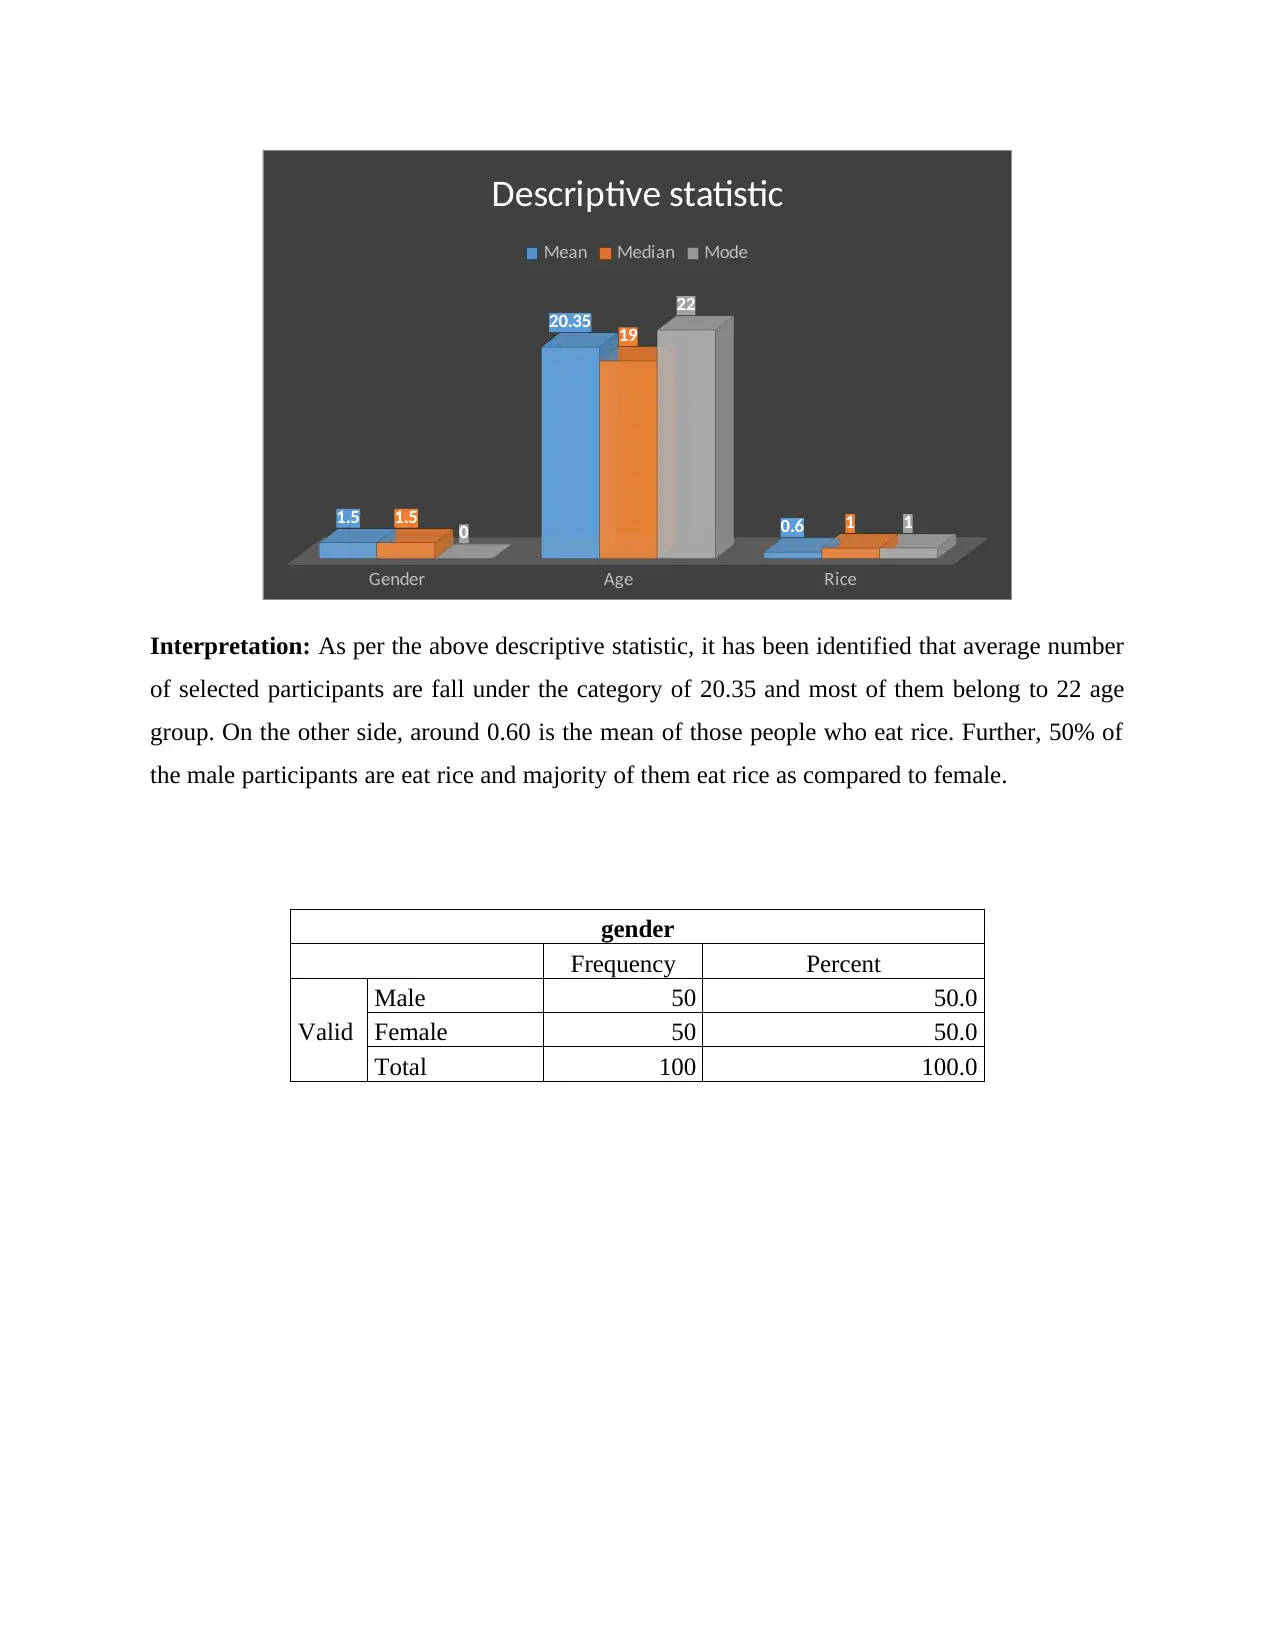
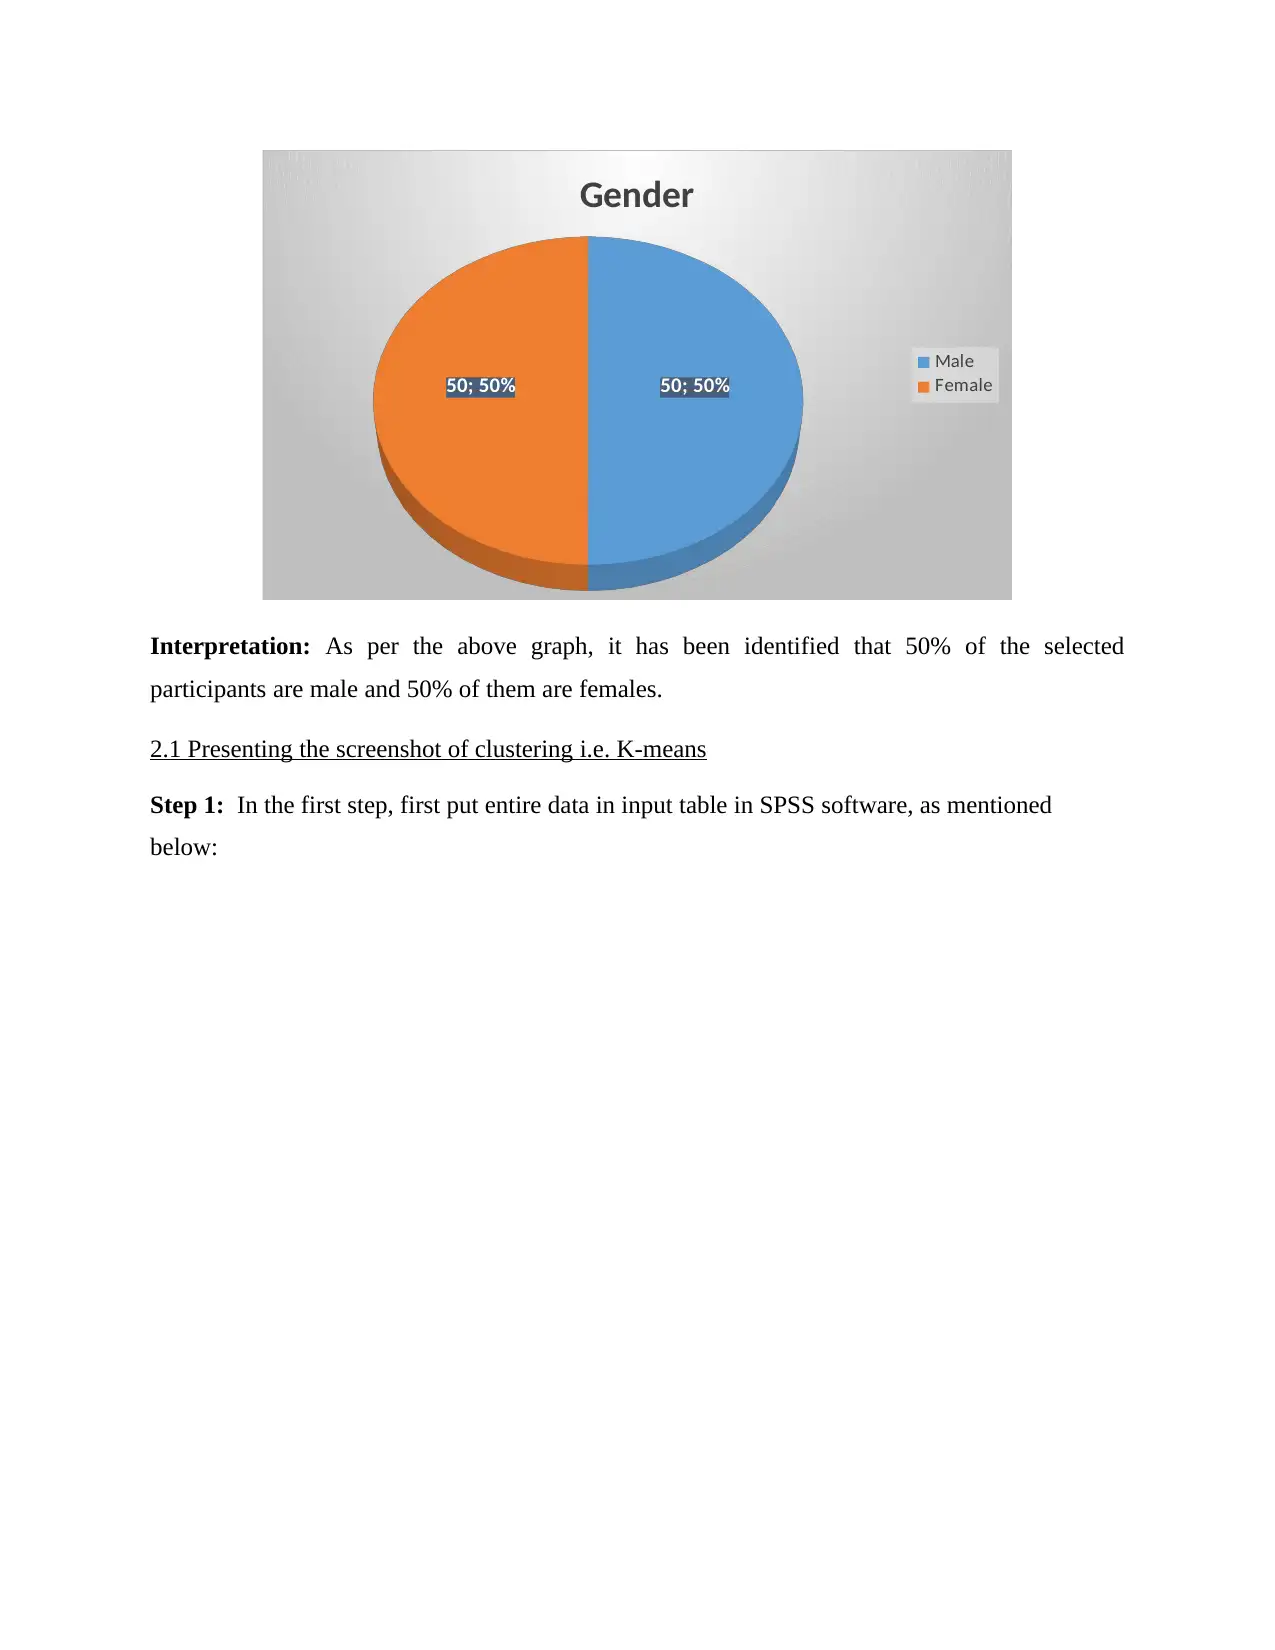
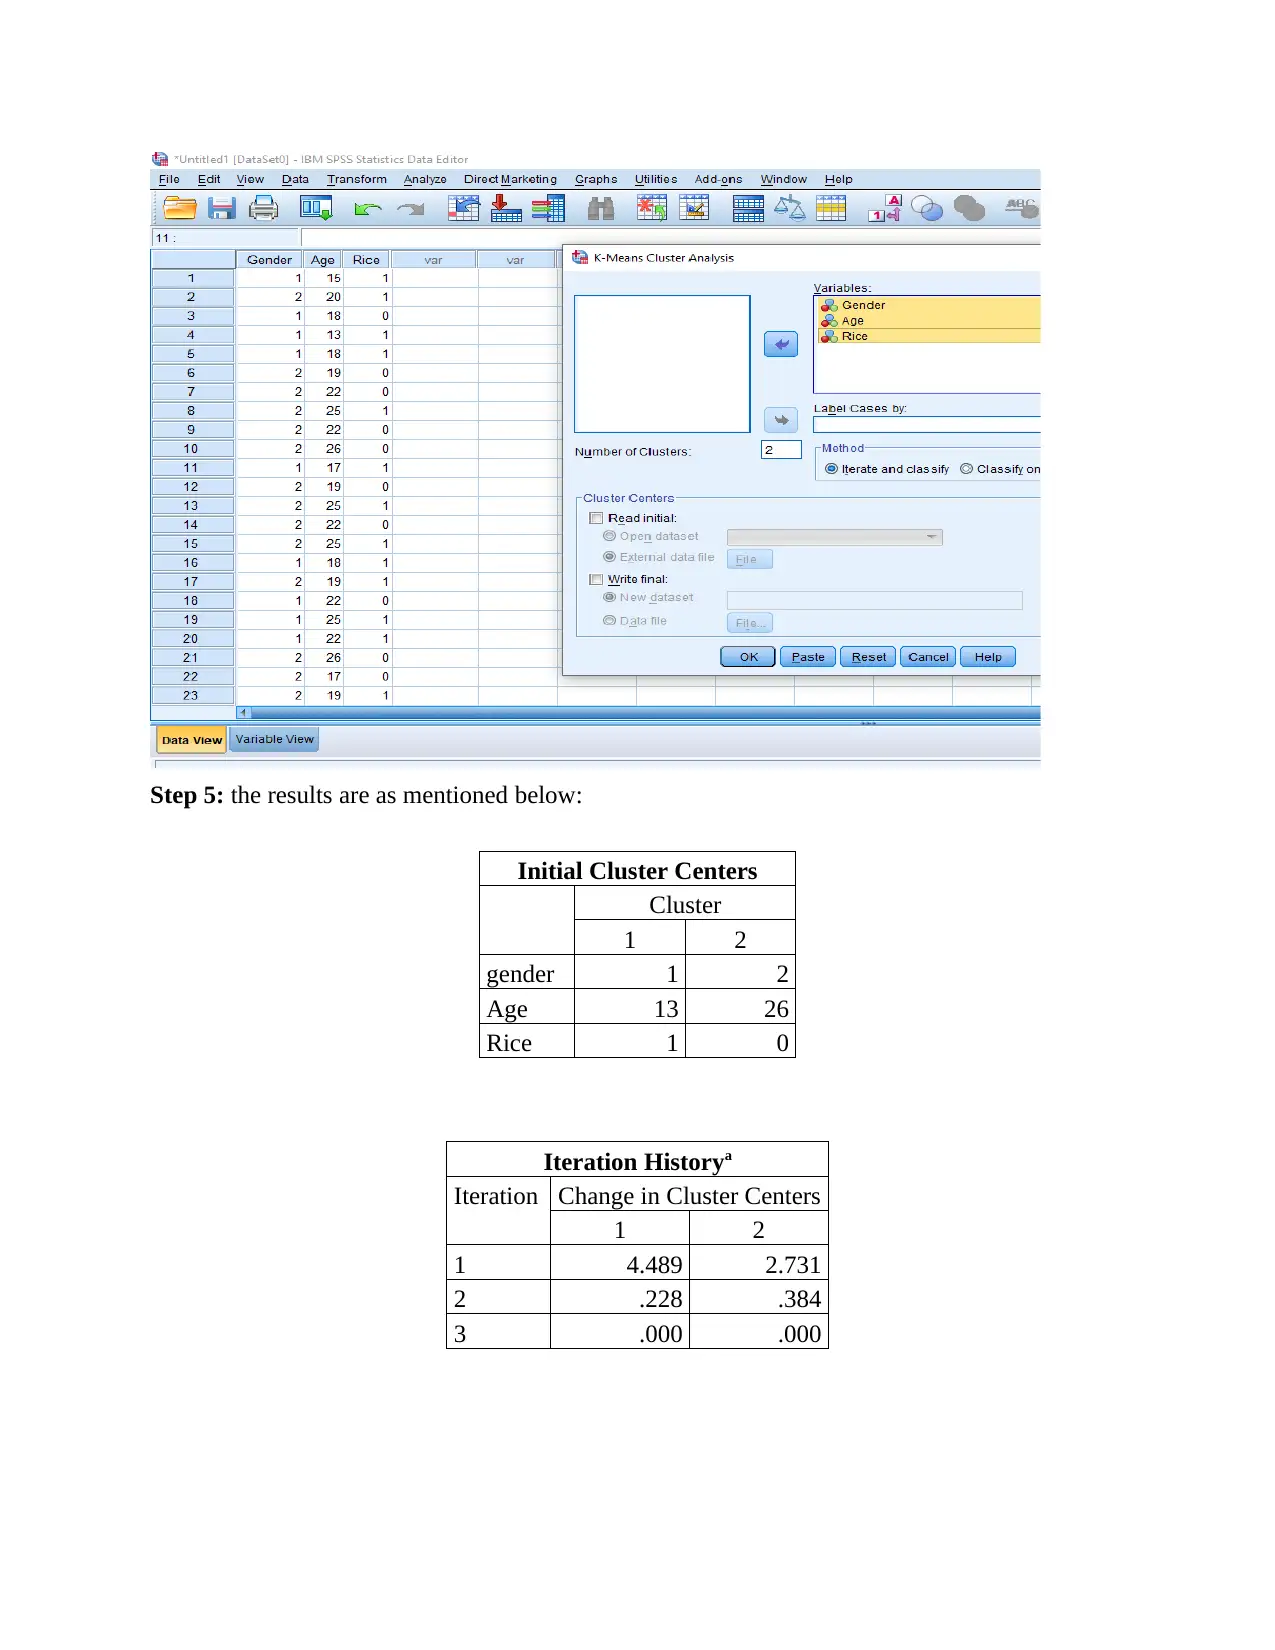
This report delves into data handling and business intelligence, beginning with an analysis of sales and profit decline in a superstore dataset using Excel for pre-processing. It evaluates Excel's utility in data cleaning, filtering, and visualization, while also acknowledging its limitations in advanced pricing rules and security. The report outlines steps for using Excel to identify sales trends and relationships with profit, highlighting a positive correlation between the two. The second part explores descriptive statistics and K-means clustering using SPSS, interpreting the results to understand homogenous groups based on selected characteristics. Finally, it briefly discusses common data mining methods and compares the pros and cons of using SPSS over Excel for data analysis, emphasizing the importance of data pre-processing and tool selection in business intelligence.

Data handling and Business Intelligence -2
Paraphrase This Document
Need a fresh take? Get an instant paraphrase of this document with our AI Paraphraser

TABLE OF CONTENTS
PART 1............................................................................................................................................3
Determine the decline in the sales/Profit.....................................................................................3
PART 2............................................................................................................................................7
2.1 Presenting the screenshot of clustering i.e. K-means............................................................8
2.2 Common data mining methods............................................................................................12
2.3 Pros and cons of using SPSS over Excel.............................................................................13
REFERENCES..............................................................................................................................15

PART 1
Determine the decline in the sales/Profit
Evaluating the use of Excel for pre-processing the data
Data pre-processing is the data mining technique that is used to involves transforming
raw data into an understandable format. Also, it is all about cleaning, instance selection,
normalization, transformation, feature extraction and selection etc. However, in the real-world,
data is often incomplete, inconsistent and also likely to contain many errors. There are many
tools and techniques used for pre-processing the data which include Weka software, Excel etc.
Nariswari and Nugraha (2020) stated that for non-programmers, Microsoft Excel is the great tool
used for pre-processing and handling structure data. It is so because it has many functions and
techniques which makes it easier to clean structure data. Thus, it can be reflected that with the
help range of functions within Excel, can determine the impact or interrelationship between sales
and profit.
In addition to this, Excel is one of the top tools for pre-processing of data due to the use
of variety of functions which includes Pivot table, If-function, Count, Trim etc. In the context of
present dataset, it has been examined that it is a huge data, and for pre-processing, Excel is used
that helps to filter the data in order to properly respond the questions. This in turn assist to
answer the questions and with the help of effective visualization, presentation of the report will
be improved and helps to interpret the data in more effective manner (HINDASAH and
NURYAKIN, 2020). On the critical note, it has been examined that it is difficult to manage
advanced pricing rules and due to lack of control and security, Excel cannot be used by the data
analysis because it might leak the important data which affected the results as well. Besides this,
it is also clearly reflected that in pricing term, the excel cannot be managed the terms easily
because it is difficult to manage advanced pricing rules, this might affect the results as well.
Overall, it has been clearly reflected that with the help of excel, superstore market can be
easily determining the fluctuation within sales due to years. Also, through this, it can be stated
that it helps to analyse the performance of a company over years and which steps need to be
chosen in order to raise the sales (Kohli, Godwin and Urolagin, 2021). So that, it can be stated
that Excel is a strong and effective pre-processing tool that helps in improving the decision and
⊘ This is a preview!⊘
Do you want full access?
Subscribe today to unlock all pages.

Trusted by 1+ million students worldwide

also derive best results accordingly. In the context of present study or chosen dataset, it can be
explained that by using different options within Excel, the superstore can determine the
importance of sales and the trend which can affected the overall performance of the company.
As per the provided data set of the superstore, it has been examined that charts and
graphs has been used as an excel function. Further, the tool is best suitable because it assists to
determine the sales figure over the years mentioned in order to determine whether the sales is
increases by year or not. This in turn also helps in determine the relationship of sales with profit.
However, many secondary research indicates that there is a positive relationship between the
variables. The steps are enumerated below:
In the first step, there is a need to filter all data, which in turn assist to extract the
essential data.
By using filter option, select a range in which sales can be identified. Under this, data
related to sales can be identified easily from the huge data.
By selecting the range, for a specific year, apply the formula of sum in order to determine
total sales for four consecutive years i.e. 2009, 2010, 2011 and 2012.
The same steps apply in the profit side, where total profit of the respective years can be
identified. This in turn helps to examine total sum of the profit and sales in order to
analyze the relationship with both variables.
Further, to drawn the graphs and charts, select the data range and click on insert in order
to present the graphs or charts that helps to make a report more presentable and identify
the relationship directly.
Also, with the help of generating graphs from the selected data, it has been identified that
both have shared a positive relationship with each other and this in turn reflected that
company have to focused upon the products so that sales can be increases that contribute
towards a profit.
Overall, it can be stated that by following the above mentioned steps, it will be easy for the
scholar to determine the answer of the questions and understand any relationship between the
variables as well.
Evaluation of the data-set
Paraphrase This Document
Need a fresh take? Get an instant paraphrase of this document with our AI Paraphraser

1 2 3 4
Series1
Series2
2009 2010 2011 2012
1625226.23
476755.974
1320410
1603443
Sales
Series1 Series2
1 2 3 4
0
20000
40000
60000
80000
100000
120000
140000
160000
180000
200000
2009 2010 2011 2012
159438
119645
175687 187456
Profit
Series1 Series2
Interpretation: As per the above, it has been identified that in 2010, the sales of the Superstore
has decline and that is why, the profit of the firm has a direct affected in opposite manner. Also,
there was a gradual increase in sales rate within 2011 and 2012. That is why, it has a direct
impact over the business performance. Further, there is a direct relationship identified within a
sales and profit. So, if there is a fluctuation within a sale, then it has a direct relationship within
the profit.

In addition to this, from the dataset of Superstore, it has been identified that in 2009, the
profit of the firm is 159438, whereas the profit might decline in 2010 due to either high expenses
and low inventory. Moreover, the profit of the firm also increases by 175687 in 2011 and in
preceding year, the sales increases by 187456. However, there is an interrelationship with sales,
such that in 2009, the sales of the superstore were 1625226 where in next year, there was a
decline in sale i.e. 476755.974. Apart from this, in next year, 2011, the sales of the company
increases by 1320410 and then by 1603443. Thus, it reflected that there is a need to if the sales
are high, it shares a positive relation with the profit. So, focusing upon the company’s inventory
and quality of products assist to increase the sales of a company.
Šaković Jovanović and et.al., (2020) explained that if the sales is exceed with variable
cost, each additional unit of a sales volume increases by the gross profit as well as net income.
Similarly, the graph also reflected that with the change in sales, the profit margin of the company
also affected. This in turn shows that if the form lower down the cost without impacting revenue
and maintain the sales of a supermarket, then the profit will go up. Therefore, can stated that
product sales inevitably lead to greater profits and also increase in monthly sales volume.
However, profit margin is considering the most important barometer of a company’s health and
it has highly influenced by company’s sales. On the other side, business owners basically strive
to have both profit and revenue, along with this, businesses face many difficulties. Thus, to
minimize the same, it is necessary for the company to ensure about the stock and make strategy
that helps to minimize the negative impact over the businesses.
In addition to this, Wan, Britto and Zhou (2020) also investigated that in some cases, a
company may have a significant revenue but also enjoy very little profit from its sales. The same
can be applied in the year of 2010 where, the business are in loss because there is a sudden
decline in the phase of sales that has a direct impact over the business performance profit.
Nariswari and Nugraha (2020) also supported in their stud that this is usually occur because a
company’s expenses are so high and it create difficulties in order to create strong profit.
However, on the other side, revenue can be slow such that even small expenses can decrease the
profit margin of a firm. That is why, company must monitor the situation frequently in order to
implement the changes so that it does not cause any negative impact over the business
performance. Apart from this, it has been also analyzed that the sales and profit relationship can
⊘ This is a preview!⊘
Do you want full access?
Subscribe today to unlock all pages.

Trusted by 1+ million students worldwide

be analyzed by owner’s fault because they expect too much and due to not fulfilling the same, it
has affected the sales or profit.
Overall, it can be stated that due to positive relationship between the variables i.e. sales
and profit, the businesses or superstores can attain the defined aim of a business. Further, an
entity can have sales or revenue without making a profit, but it cannot have a profit without any
revenue. That is why, this interrelationship reflected that earning profit is not the only motive of
the company, but sustaining the brand image over the business should also contribute to enhance
the sales of a business. Hence, the data set of a superstore reflected that by minimizing the price
will contribute to increase the profit and attract the customers in order to raise the business profit.
PART 2
Descriptive statistics
gender Age Rice
N
Valid 100 100 100
Missing 0 0 0
Mean 1.50 20.35 .60
Median 1.50 19.00 1.00
Mode 1a 22 1
a. Multiple modes exist. The smallest value is
shown
Paraphrase This Document
Need a fresh take? Get an instant paraphrase of this document with our AI Paraphraser

Gender Age Rice
1.5
20.35
0.61.5
19
1
0
22
1
Descriptive statistic
Mean Median Mode
Interpretation: As per the above descriptive statistic, it has been identified that average number
of selected participants are fall under the category of 20.35 and most of them belong to 22 age
group. On the other side, around 0.60 is the mean of those people who eat rice. Further, 50% of
the male participants are eat rice and majority of them eat rice as compared to female.
gender
Frequency Percent
Valid
Male 50 50.0
Female 50 50.0
Total 100 100.0

50; 50%50; 50%
Gender
Male
Female
Interpretation: As per the above graph, it has been identified that 50% of the selected
participants are male and 50% of them are females.
2.1 Presenting the screenshot of clustering i.e. K-means
Step 1: In the first step, first put entire data in input table in SPSS software, as mentioned
below:
⊘ This is a preview!⊘
Do you want full access?
Subscribe today to unlock all pages.

Trusted by 1+ million students worldwide

Step 2: Click on Analyze at file menu and then click on classify. Further click on K-means to
generate the findings
Paraphrase This Document
Need a fresh take? Get an instant paraphrase of this document with our AI Paraphraser

Step 4: In this, put all the variables into another side, and turn on iterate and classify in order to
generate the results.

Step 5: the results are as mentioned below:
Initial Cluster Centers
Cluster
1 2
gender 1 2
Age 13 26
Rice 1 0
Iteration Historya
Iteration Change in Cluster Centers
1 2
1 4.489 2.731
2 .228 .384
3 .000 .000
Initial Cluster Centers
Cluster
1 2
gender 1 2
Age 13 26
Rice 1 0
Iteration Historya
Iteration Change in Cluster Centers
1 2
1 4.489 2.731
2 .228 .384
3 .000 .000
⊘ This is a preview!⊘
Do you want full access?
Subscribe today to unlock all pages.

Trusted by 1+ million students worldwide
1 out of 16
Related Documents

Your All-in-One AI-Powered Toolkit for Academic Success.
+13062052269
info@desklib.com
Available 24*7 on WhatsApp / Email
Unlock your academic potential
Copyright © 2020–2025 A2Z Services. All Rights Reserved. Developed and managed by ZUCOL.