Analysis of Data Handling and Business Intelligence: LCBB5000 Report
VerifiedAdded on 2023/01/10
|15
|3185
|2
Report
AI Summary
This report delves into data handling and business intelligence, exploring current trends in data warehousing, business intelligence, and data mining. It analyzes Superstore data using Microsoft Excel for preprocessing, analysis, and visualization, determining a decline in sales and identifying contributing factors like unit price changes. The report then investigates Audi dealership data using Weka, employing K-means clustering to understand customer behavior and preferences. It details the workings of Weka, interprets clustering results, and compares Weka's capabilities to Excel's, highlighting the advantages and disadvantages of each tool. The analysis reveals key insights into sales trends, data analysis methods, and the effectiveness of different analytical tools in extracting valuable information from datasets.
DATA HANDLING AND
BUSINESS INTELLIGENCE
BUSINESS INTELLIGENCE
Paraphrase This Document
Need a fresh take? Get an instant paraphrase of this document with our AI Paraphraser
Contents
Contents...........................................................................................................................................2
INTRODUCTION...........................................................................................................................1
Part 1................................................................................................................................................1
Current trends in data warehousing, business intelligence and data mining...............................1
Determining the decline in sales over the years while evaluating the use of Excel for pre-
processing the data, analysing the data and visualising the data.................................................2
Part 2................................................................................................................................................7
Workings of Weka with explanation of results...........................................................................7
Common data mining methods....................................................................................................9
Advantages/disadvantages of Weka over Excel........................................................................10
CONCLUSION..............................................................................................................................11
REFERENCES..............................................................................................................................12

⊘ This is a preview!⊘
Do you want full access?
Subscribe today to unlock all pages.
Trusted by 1+ million students worldwide
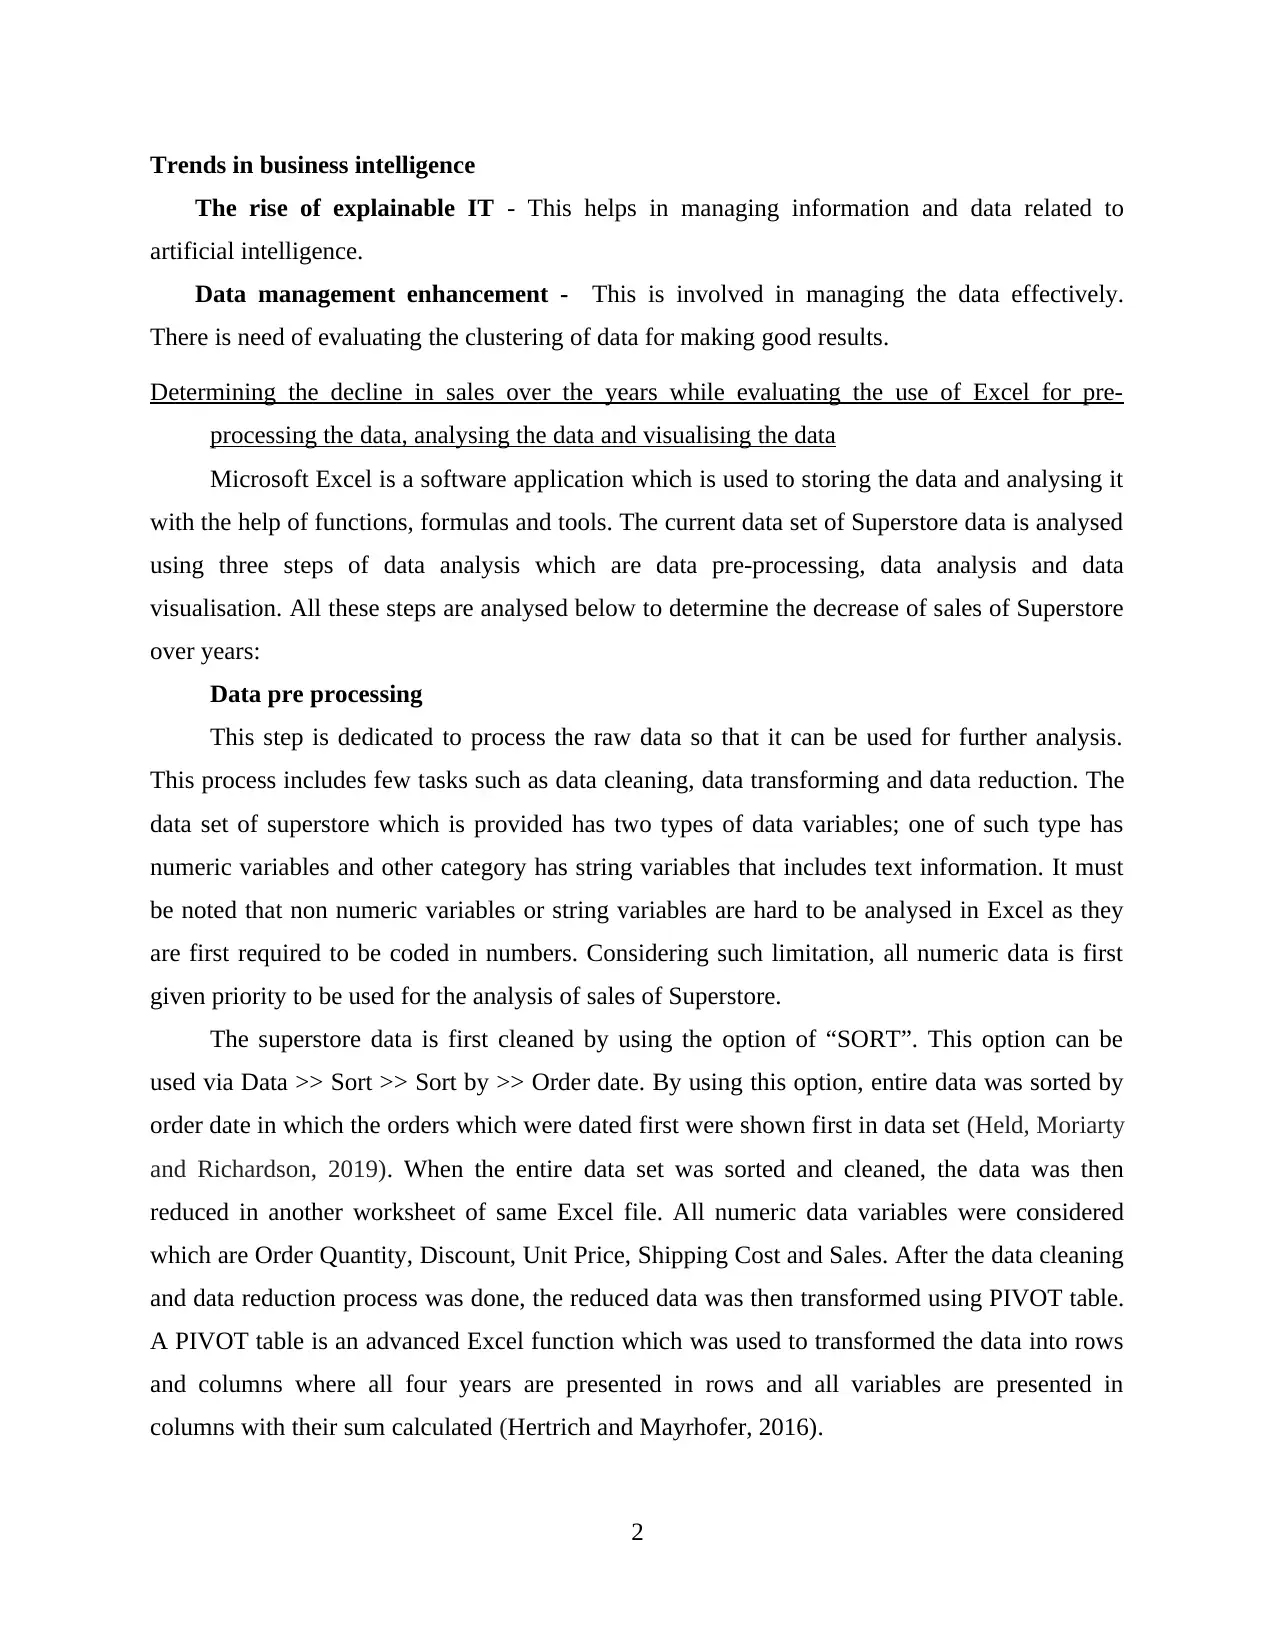
INTRODUCTION
Data handling and business intelligence are the branches of data analysis in which decisions
are made by using a technology driven process where the most important asset to an organisation
is their data (Ataman, Kulick and Sim, 2011). The present report is developed with the aim of
gain an understanding of using statistical analysis tools such as Excel and Weka. For this aim,
this report is divided into two sections. The first section of this report will include current trends
in the world of data mining and warehousing. Along with it, this section will include analysis of
Superstore data in which use of Microsoft Excel will be analysed including pre processing,
analysis and visualisation of data.
Second section of this report will include the analysis of Audi dealership data. This data will
be evaluated using the software application of Weka. This application and data will be used to
analyse certain patterns and behaviour of data. This section will also include analysis of data
mining methods that are used in real life. Lastly, this section will include advantages and
disadvantages of Weka over Microsoft Excel.
Part 1
Current trends in data warehousing, business intelligence and data mining
Different trends in data warehousing
Complex Data Marts Will Define the Future Business Models - With changing time period,
needs and requirement of information is also changing. So, Data Marts will be using business
models with new specification and focused area zones. Moreover, in in this modern time,
everyone is focused towards flow of speed so Data Marts will improve the speed of functionality
of their data higher scale which will also leads to higher and better efficiency.
Column-based Storage is on the Rise - Another trend which is rising is retrieve of data by
adopting column based storage. This is because row based storage tools time to get or processed
the credentials. But with add of column it will be easier to retrieve data analytics.
Mixed Workloads Are Becoming Common - Further comes the mixed workloads amongst
data warehousing. In relevance with Data warehousing they includes several types of workloads
like operational BI, data mining etc. Therefore, they as these workloads occurs new causes and
issues also rises. So, mixed workloads are in trends with new structure (El-Sappagh and et.al,
2011).
1
Paraphrase This Document
Need a fresh take? Get an instant paraphrase of this document with our AI Paraphraser
Trends in business intelligence
The rise of explainable IT - This helps in managing information and data related to
artificial intelligence.
Data management enhancement - This is involved in managing the data effectively.
There is need of evaluating the clustering of data for making good results.
Determining the decline in sales over the years while evaluating the use of Excel for pre-
processing the data, analysing the data and visualising the data
Microsoft Excel is a software application which is used to storing the data and analysing it
with the help of functions, formulas and tools. The current data set of Superstore data is analysed
using three steps of data analysis which are data pre-processing, data analysis and data
visualisation. All these steps are analysed below to determine the decrease of sales of Superstore
over years:
Data pre processing
This step is dedicated to process the raw data so that it can be used for further analysis.
This process includes few tasks such as data cleaning, data transforming and data reduction. The
data set of superstore which is provided has two types of data variables; one of such type has
numeric variables and other category has string variables that includes text information. It must
be noted that non numeric variables or string variables are hard to be analysed in Excel as they
are first required to be coded in numbers. Considering such limitation, all numeric data is first
given priority to be used for the analysis of sales of Superstore.
The superstore data is first cleaned by using the option of “SORT”. This option can be
used via Data >> Sort >> Sort by >> Order date. By using this option, entire data was sorted by
order date in which the orders which were dated first were shown first in data set (Held, Moriarty
and Richardson, 2019). When the entire data set was sorted and cleaned, the data was then
reduced in another worksheet of same Excel file. All numeric data variables were considered
which are Order Quantity, Discount, Unit Price, Shipping Cost and Sales. After the data cleaning
and data reduction process was done, the reduced data was then transformed using PIVOT table.
A PIVOT table is an advanced Excel function which was used to transformed the data into rows
and columns where all four years are presented in rows and all variables are presented in
columns with their sum calculated (Hertrich and Mayrhofer, 2016).
2
By the above process of data pre processing which has done by using Excel, it can be
evaluated that Excel application can be effectively used to pre process a dataset.
Data analysis and data visualisation
The second and third step in the process of coming to a conclusion for superstore are data
analysis and data visualisation. In the step of data analysis, the Excel function of SUM() will be
used and for data visualisation, Excel tables and graphs will be used.
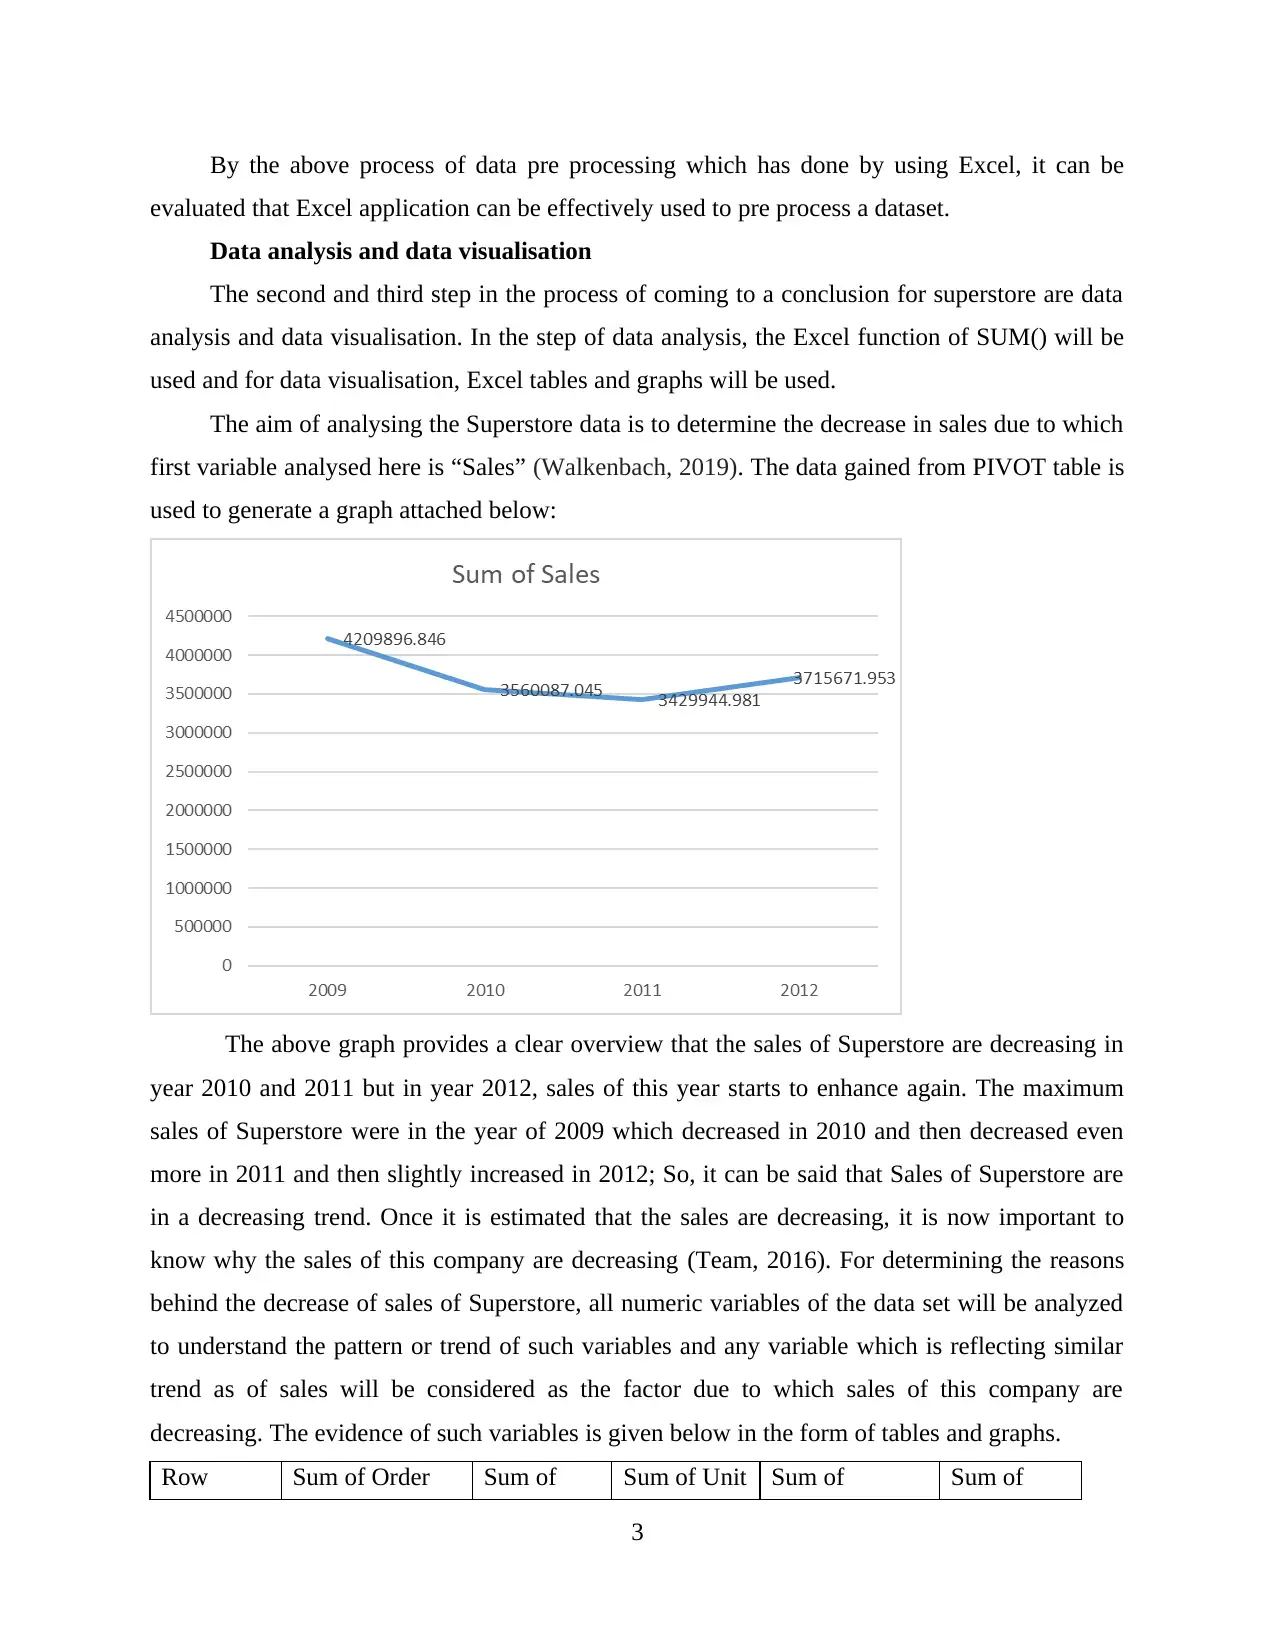
The aim of analysing the Superstore data is to determine the decrease in sales due to which
first variable analysed here is “Sales” (Walkenbach, 2019). The data gained from PIVOT table is
used to generate a graph attached below:
The above graph provides a clear overview that the sales of Superstore are decreasing in
year 2010 and 2011 but in year 2012, sales of this year starts to enhance again. The maximum
sales of Superstore were in the year of 2009 which decreased in 2010 and then decreased even
more in 2011 and then slightly increased in 2012; So, it can be said that Sales of Superstore are
in a decreasing trend. Once it is estimated that the sales are decreasing, it is now important to
know why the sales of this company are decreasing (Team, 2016). For determining the reasons
behind the decrease of sales of Superstore, all numeric variables of the data set will be analyzed
to understand the pattern or trend of such variables and any variable which is reflecting similar
trend as of sales will be considered as the factor due to which sales of this company are
decreasing. The evidence of such variables is given below in the form of tables and graphs.
Row Sum of Order Sum of Sum of Unit Sum of Sum of
3
evaluated that Excel application can be effectively used to pre process a dataset.
Data analysis and data visualisation
The second and third step in the process of coming to a conclusion for superstore are data
analysis and data visualisation. In the step of data analysis, the Excel function of SUM() will be
used and for data visualisation, Excel tables and graphs will be used.
The aim of analysing the Superstore data is to determine the decrease in sales due to which
first variable analysed here is “Sales” (Walkenbach, 2019). The data gained from PIVOT table is
used to generate a graph attached below:
The above graph provides a clear overview that the sales of Superstore are decreasing in
year 2010 and 2011 but in year 2012, sales of this year starts to enhance again. The maximum
sales of Superstore were in the year of 2009 which decreased in 2010 and then decreased even
more in 2011 and then slightly increased in 2012; So, it can be said that Sales of Superstore are
in a decreasing trend. Once it is estimated that the sales are decreasing, it is now important to
know why the sales of this company are decreasing (Team, 2016). For determining the reasons
behind the decrease of sales of Superstore, all numeric variables of the data set will be analyzed
to understand the pattern or trend of such variables and any variable which is reflecting similar
trend as of sales will be considered as the factor due to which sales of this company are
decreasing. The evidence of such variables is given below in the form of tables and graphs.
Row Sum of Order Sum of Sum of Unit Sum of Sum of
3
⊘ This is a preview!⊘
Do you want full access?
Subscribe today to unlock all pages.
Trusted by 1+ million students worldwide
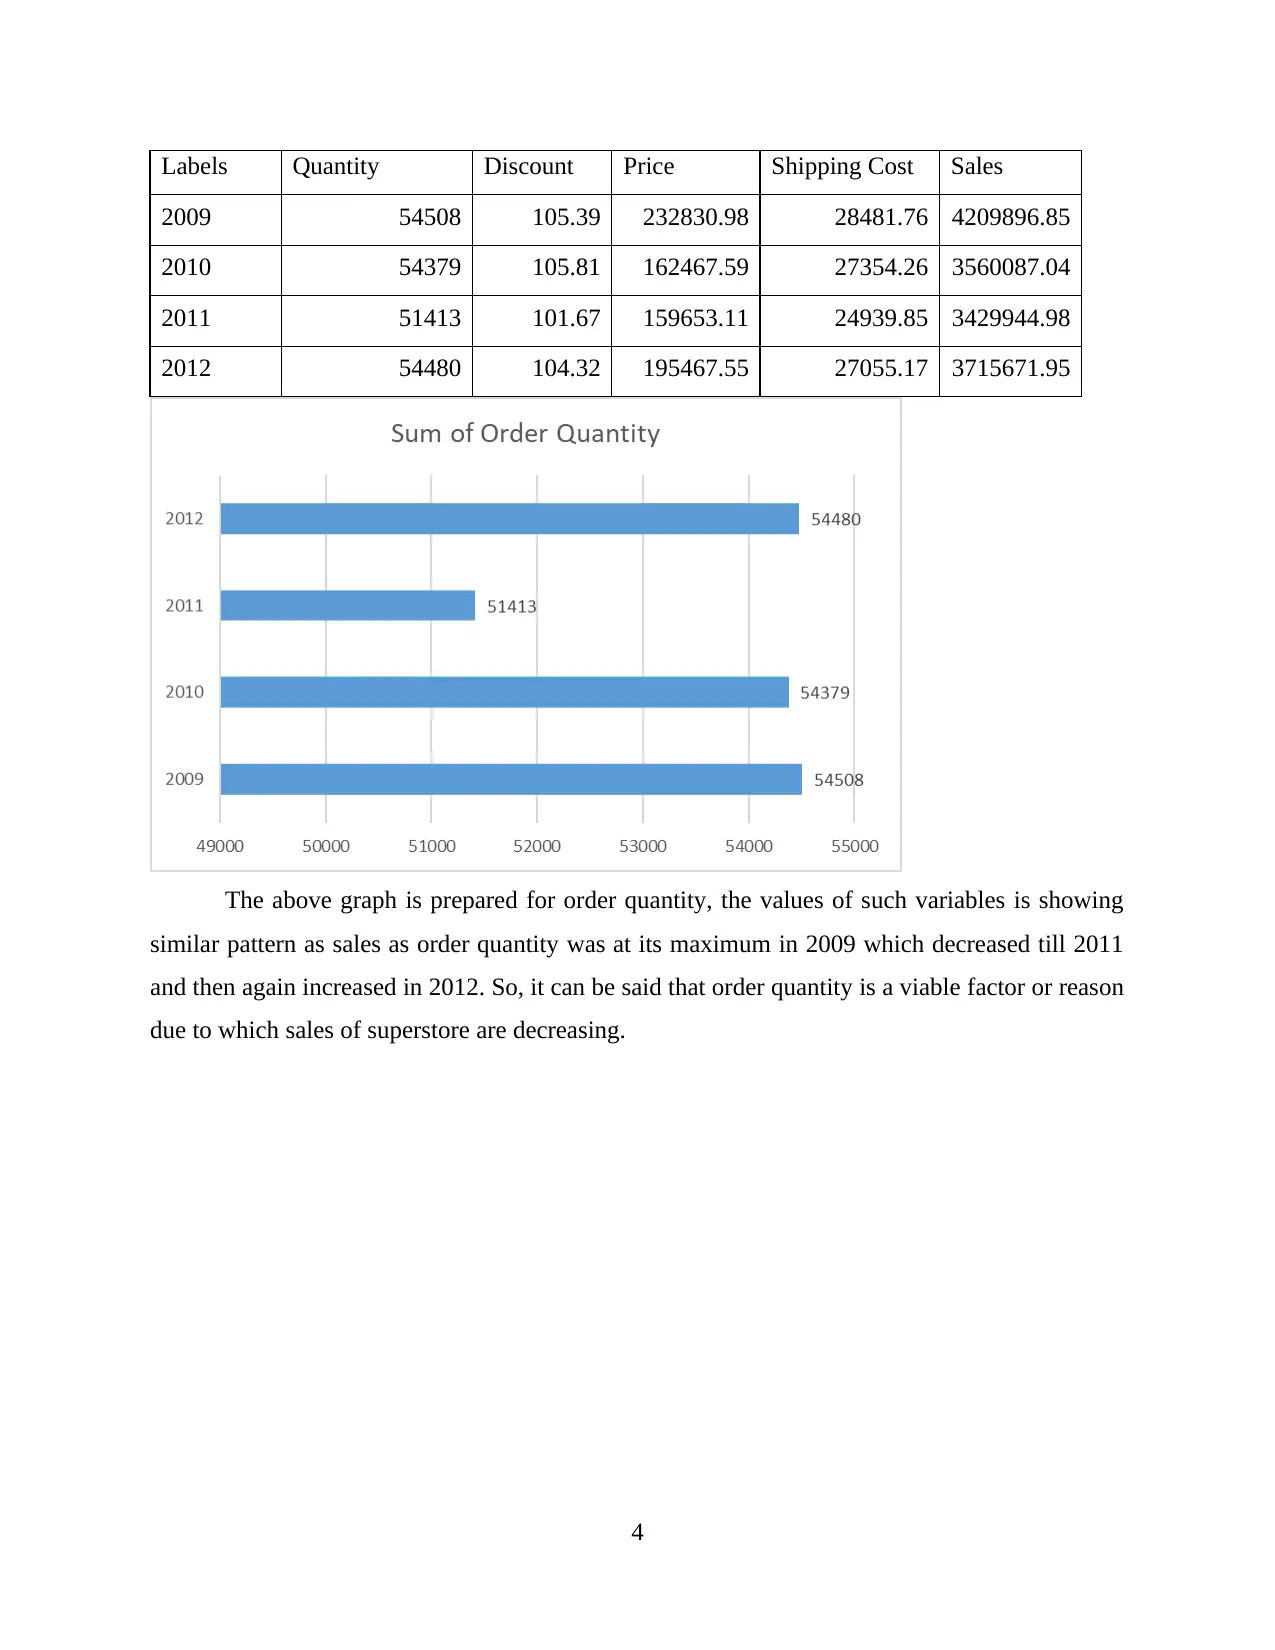
Labels Quantity Discount Price Shipping Cost Sales
2009 54508 105.39 232830.98 28481.76 4209896.85
2010 54379 105.81 162467.59 27354.26 3560087.04
2011 51413 101.67 159653.11 24939.85 3429944.98
2012 54480 104.32 195467.55 27055.17 3715671.95
The above graph is prepared for order quantity, the values of such variables is showing
similar pattern as sales as order quantity was at its maximum in 2009 which decreased till 2011
and then again increased in 2012. So, it can be said that order quantity is a viable factor or reason
due to which sales of superstore are decreasing.
4
Paraphrase This Document
Need a fresh take? Get an instant paraphrase of this document with our AI Paraphraser
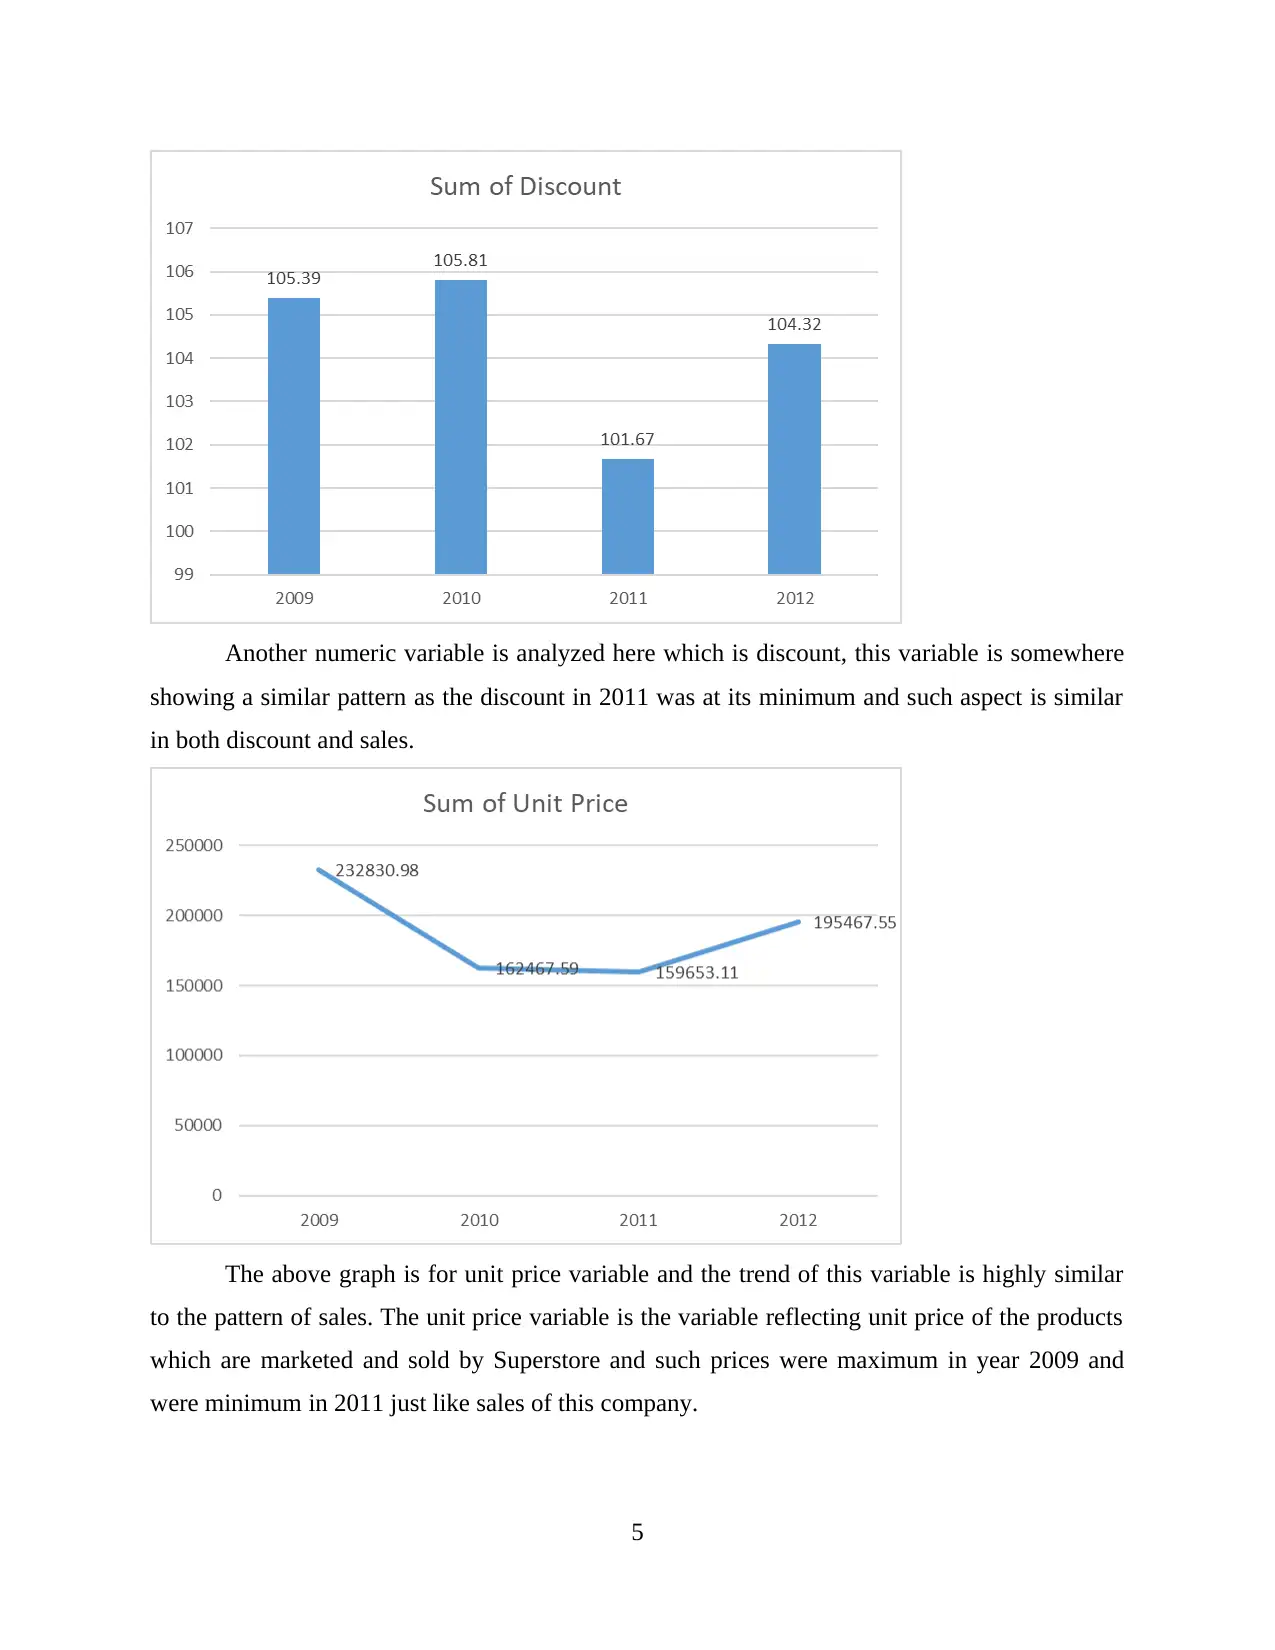
Another numeric variable is analyzed here which is discount, this variable is somewhere
showing a similar pattern as the discount in 2011 was at its minimum and such aspect is similar
in both discount and sales.
The above graph is for unit price variable and the trend of this variable is highly similar
to the pattern of sales. The unit price variable is the variable reflecting unit price of the products
which are marketed and sold by Superstore and such prices were maximum in year 2009 and
were minimum in 2011 just like sales of this company.
5
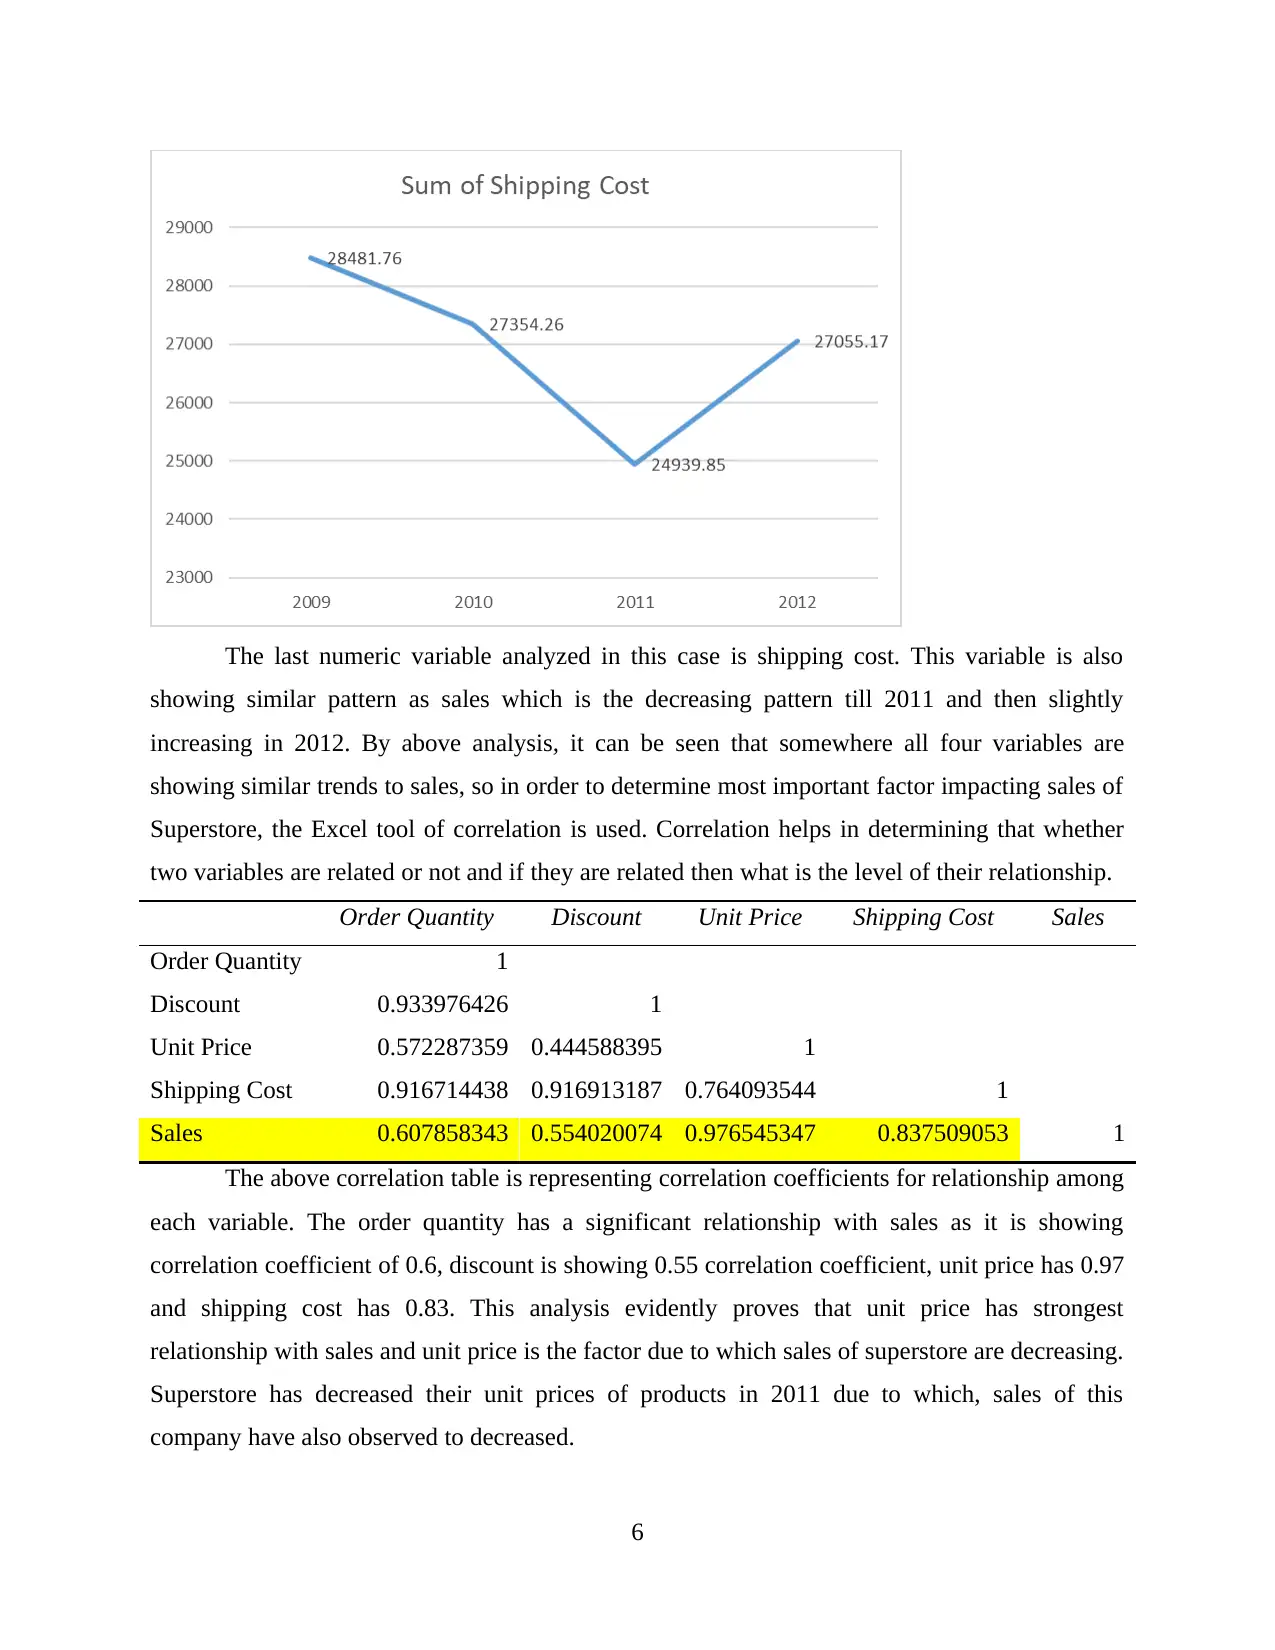
The last numeric variable analyzed in this case is shipping cost. This variable is also
showing similar pattern as sales which is the decreasing pattern till 2011 and then slightly
increasing in 2012. By above analysis, it can be seen that somewhere all four variables are
showing similar trends to sales, so in order to determine most important factor impacting sales of
Superstore, the Excel tool of correlation is used. Correlation helps in determining that whether
two variables are related or not and if they are related then what is the level of their relationship.
Order Quantity Discount Unit Price Shipping Cost Sales
Order Quantity 1
Discount 0.933976426 1
Unit Price 0.572287359 0.444588395 1
Shipping Cost 0.916714438 0.916913187 0.764093544 1
Sales 0.607858343 0.554020074 0.976545347 0.837509053 1
The above correlation table is representing correlation coefficients for relationship among
each variable. The order quantity has a significant relationship with sales as it is showing
correlation coefficient of 0.6, discount is showing 0.55 correlation coefficient, unit price has 0.97
and shipping cost has 0.83. This analysis evidently proves that unit price has strongest
relationship with sales and unit price is the factor due to which sales of superstore are decreasing.
Superstore has decreased their unit prices of products in 2011 due to which, sales of this
company have also observed to decreased.
6
⊘ This is a preview!⊘
Do you want full access?
Subscribe today to unlock all pages.
Trusted by 1+ million students worldwide
The above analysis evidently concludes that Microsoft Excel can be effectively used for
pre processing, analysis and visualisation of data as this software application is successfully used
for determining the decrease of sales in superstore and the reasons assisting this decrease.
Part 2
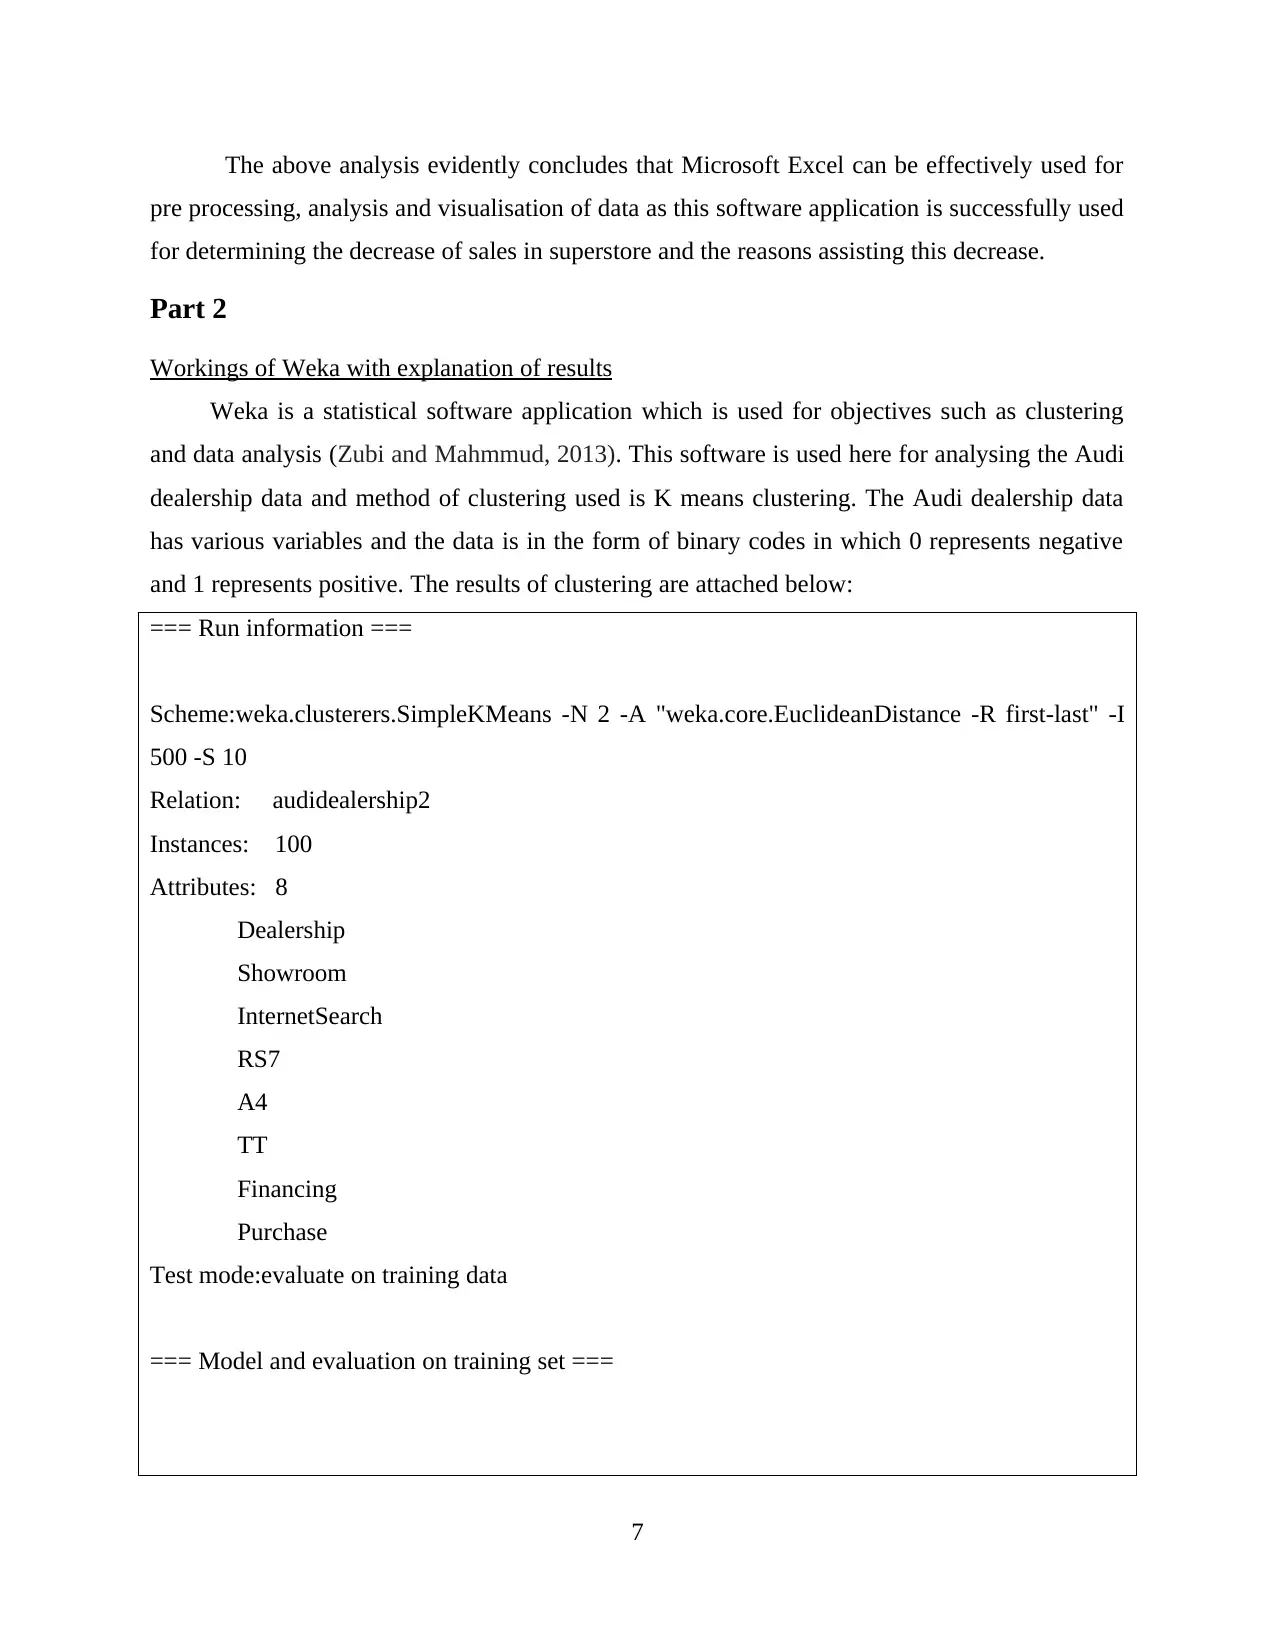
Workings of Weka with explanation of results
Weka is a statistical software application which is used for objectives such as clustering
and data analysis (Zubi and Mahmmud, 2013). This software is used here for analysing the Audi
dealership data and method of clustering used is K means clustering. The Audi dealership data
has various variables and the data is in the form of binary codes in which 0 represents negative
and 1 represents positive. The results of clustering are attached below:
=== Run information ===
Scheme:weka.clusterers.SimpleKMeans -N 2 -A "weka.core.EuclideanDistance -R first-last" -I
500 -S 10
Relation: audidealership2
Instances: 100
Attributes: 8
Dealership
Showroom
InternetSearch
RS7
A4
TT
Financing
Purchase
Test mode:evaluate on training data
=== Model and evaluation on training set ===
7
pre processing, analysis and visualisation of data as this software application is successfully used
for determining the decrease of sales in superstore and the reasons assisting this decrease.
Part 2
Workings of Weka with explanation of results
Weka is a statistical software application which is used for objectives such as clustering
and data analysis (Zubi and Mahmmud, 2013). This software is used here for analysing the Audi
dealership data and method of clustering used is K means clustering. The Audi dealership data
has various variables and the data is in the form of binary codes in which 0 represents negative
and 1 represents positive. The results of clustering are attached below:
=== Run information ===
Scheme:weka.clusterers.SimpleKMeans -N 2 -A "weka.core.EuclideanDistance -R first-last" -I
500 -S 10
Relation: audidealership2
Instances: 100
Attributes: 8
Dealership
Showroom
InternetSearch
RS7
A4
TT
Financing
Purchase
Test mode:evaluate on training data
=== Model and evaluation on training set ===
7
Paraphrase This Document
Need a fresh take? Get an instant paraphrase of this document with our AI Paraphraser
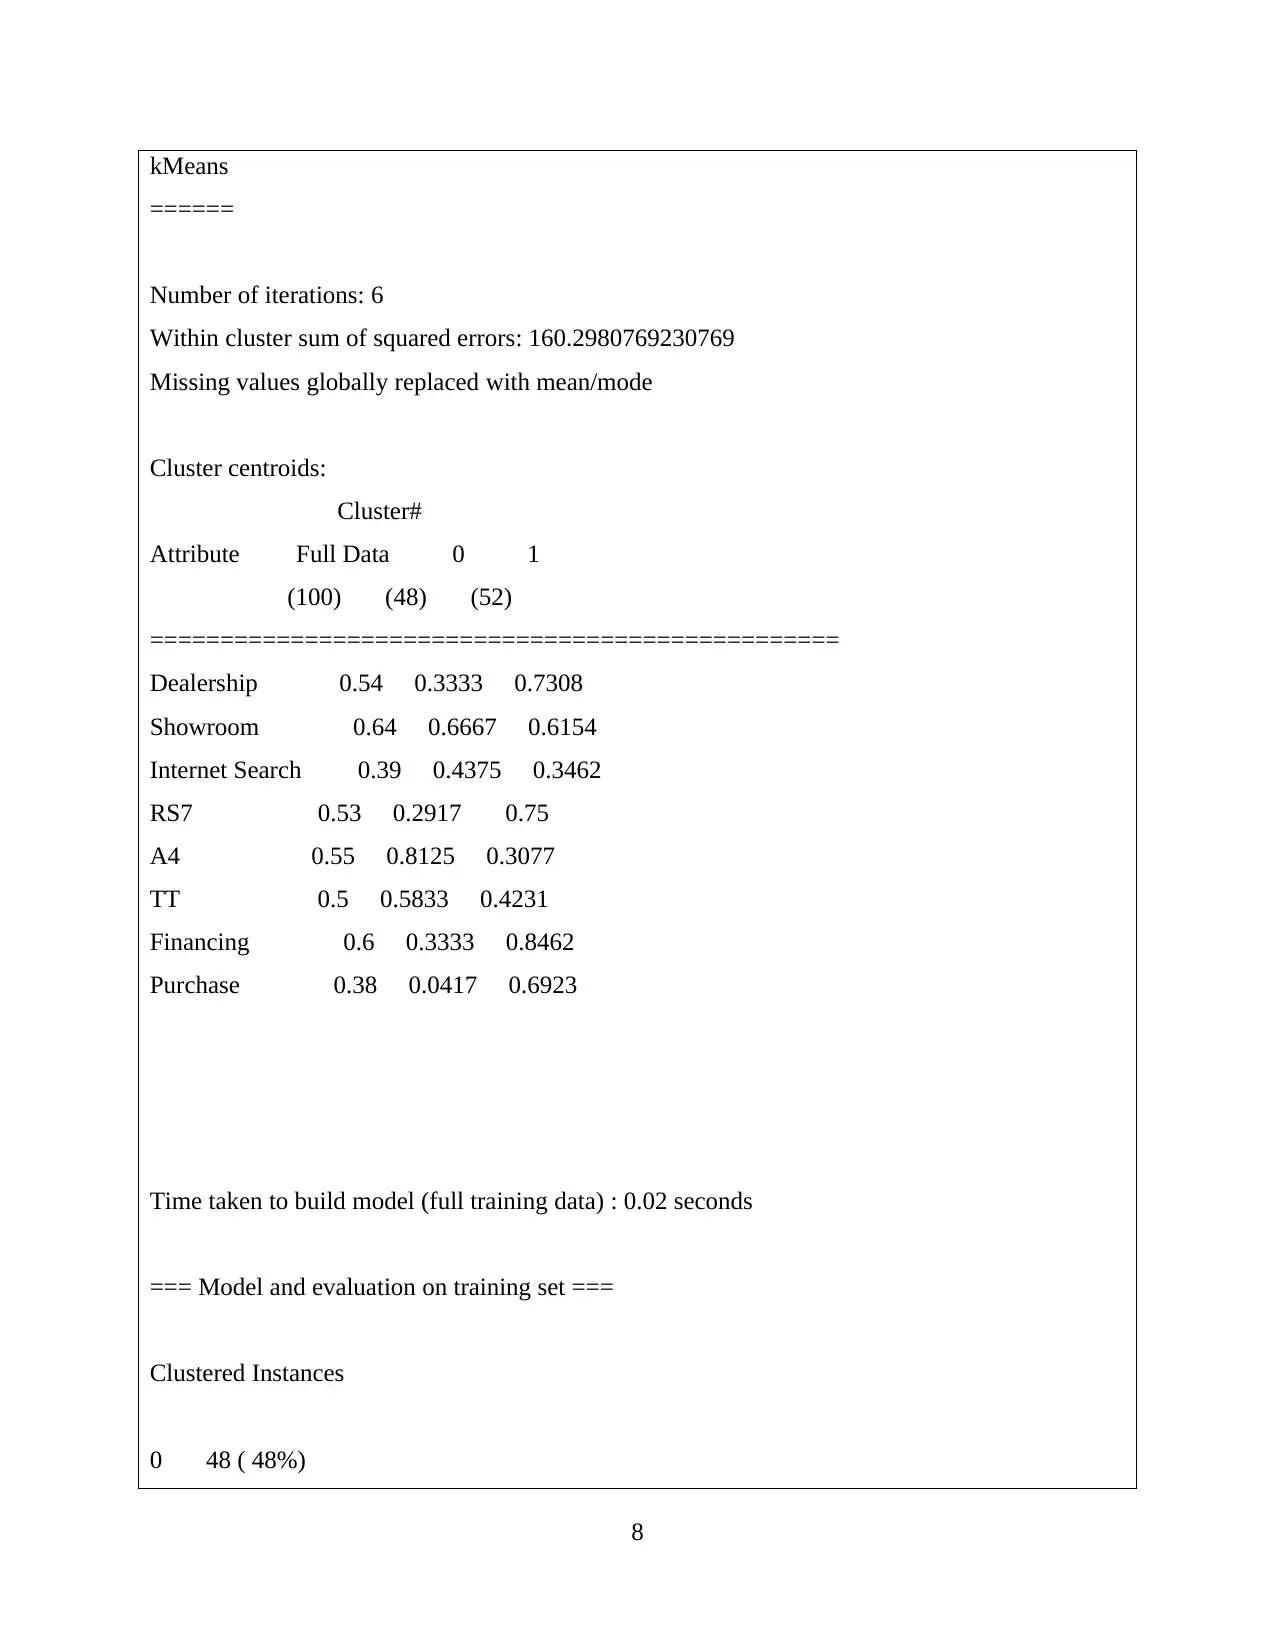
kMeans
======
Number of iterations: 6
Within cluster sum of squared errors: 160.2980769230769
Missing values globally replaced with mean/mode
Cluster centroids:
Cluster#
Attribute Full Data 0 1
(100) (48) (52)
=================================================
Dealership 0.54 0.3333 0.7308
Showroom 0.64 0.6667 0.6154
Internet Search 0.39 0.4375 0.3462
RS7 0.53 0.2917 0.75
A4 0.55 0.8125 0.3077
TT 0.5 0.5833 0.4231
Financing 0.6 0.3333 0.8462
Purchase 0.38 0.0417 0.6923
Time taken to build model (full training data) : 0.02 seconds
=== Model and evaluation on training set ===
Clustered Instances
0 48 ( 48%)
8
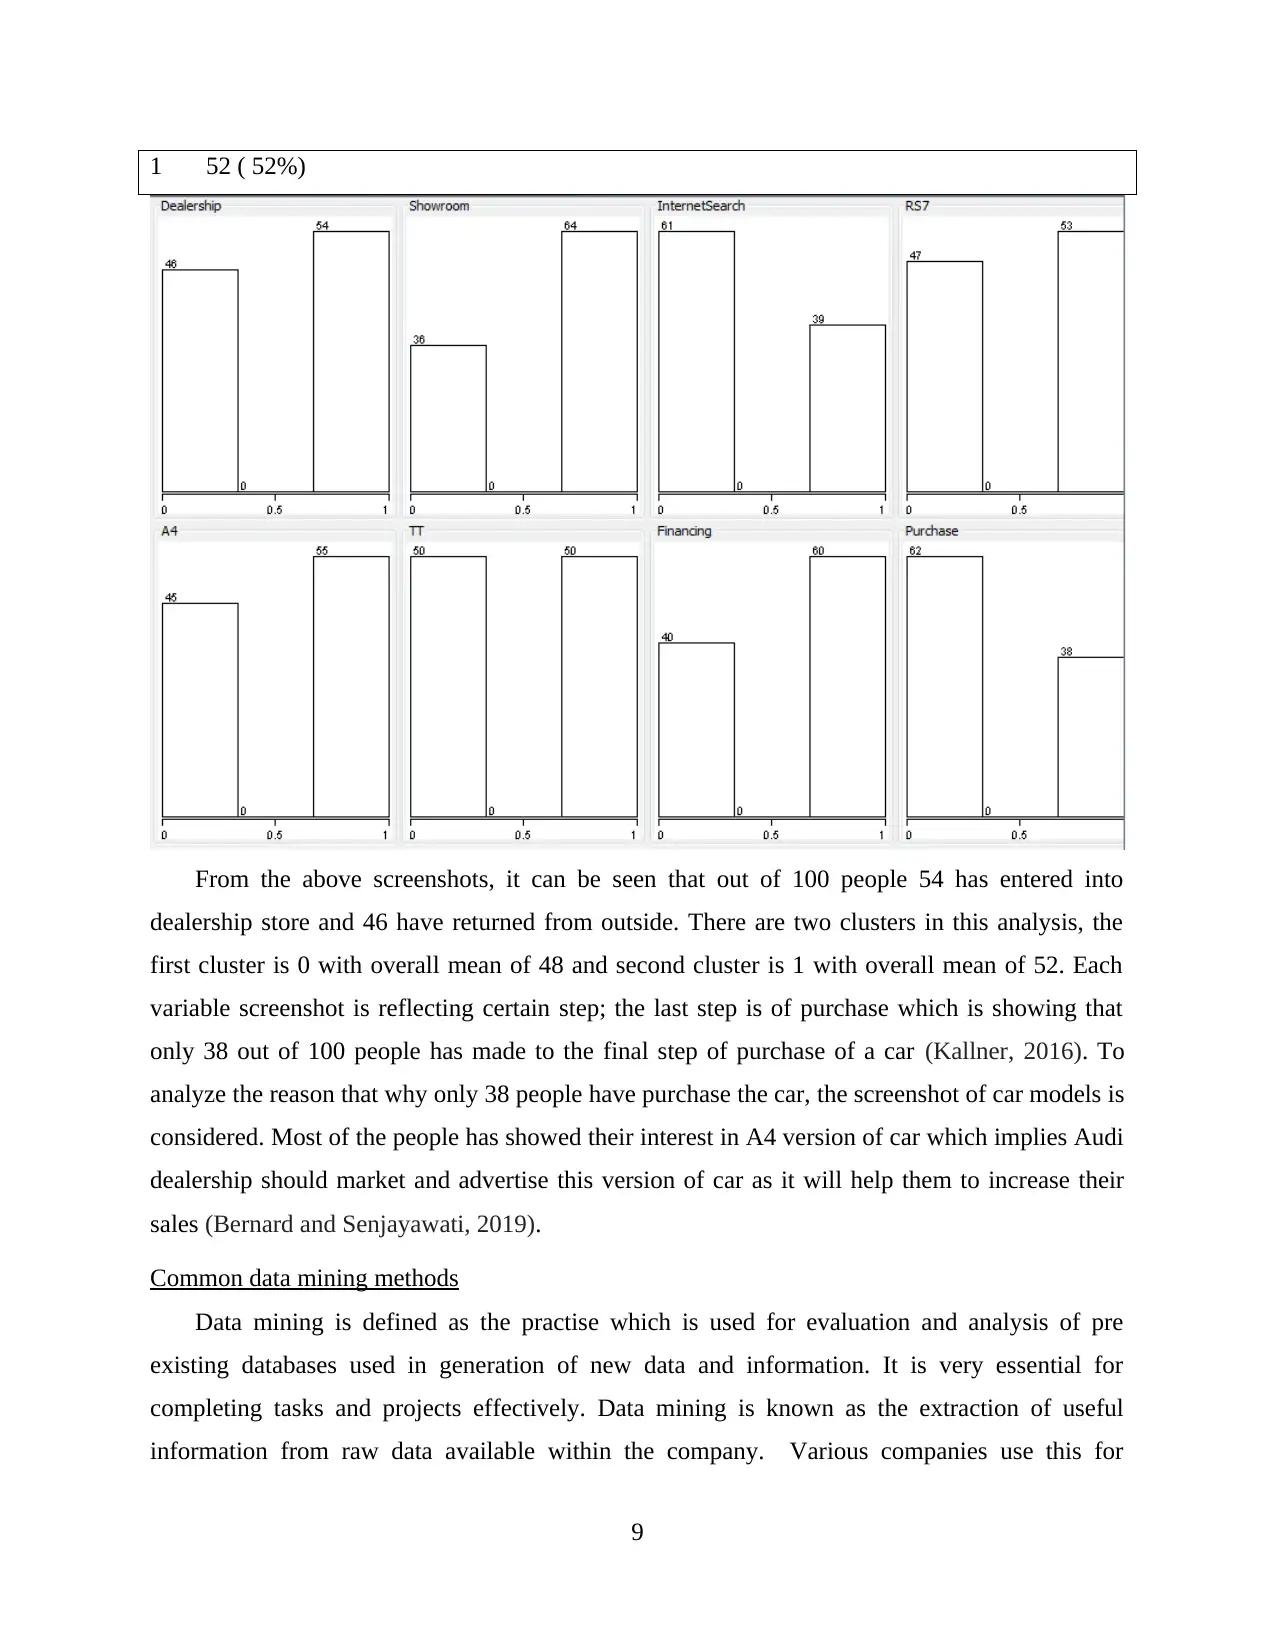
1 52 ( 52%)
From the above screenshots, it can be seen that out of 100 people 54 has entered into
dealership store and 46 have returned from outside. There are two clusters in this analysis, the
first cluster is 0 with overall mean of 48 and second cluster is 1 with overall mean of 52. Each
variable screenshot is reflecting certain step; the last step is of purchase which is showing that
only 38 out of 100 people has made to the final step of purchase of a car (Kallner, 2016). To
analyze the reason that why only 38 people have purchase the car, the screenshot of car models is
considered. Most of the people has showed their interest in A4 version of car which implies Audi
dealership should market and advertise this version of car as it will help them to increase their
sales (Bernard and Senjayawati, 2019).
Common data mining methods
Data mining is defined as the practise which is used for evaluation and analysis of pre
existing databases used in generation of new data and information. It is very essential for
completing tasks and projects effectively. Data mining is known as the extraction of useful
information from raw data available within the company. Various companies use this for
9
⊘ This is a preview!⊘
Do you want full access?
Subscribe today to unlock all pages.
Trusted by 1+ million students worldwide
1 out of 15
Related Documents


Your All-in-One AI-Powered Toolkit for Academic Success.
+13062052269
info@desklib.com
Available 24*7 on WhatsApp / Email
![[object Object]](/_next/static/media/star-bottom.7253800d.svg)
Unlock your academic potential
Copyright © 2020–2026 A2Z Services. All Rights Reserved. Developed and managed by ZUCOL.