Data Analysis and Business Intelligence Report (Smile Clinic)
VerifiedAdded on 2022/12/29
|16
|3635
|84
Report
AI Summary
This report delves into data handling and business intelligence, focusing on Microsoft Excel and SPSS applications within the context of the Smile Clinic. It begins by outlining Excel's role in preprocessing, analyzing, and visualizing data, including functions like data storage, recovery, reporting, research, conditional formatting, and security. The report then explores specific Excel functions such as the IF function and lookup functions (VLOOKUP, HLOOKUP), illustrating their practical uses. The report also incorporates data visualization techniques using charts and graphs. Furthermore, it provides a practical example of clustering using SPSS with the provided nutrition.csv data, including descriptive analysis and interpretation of results. The report concludes by comparing and contrasting the advantages and disadvantages of SPSS over MS Excel, offering a comprehensive overview of data analysis tools and techniques.
Data handling and
business intelligence
business intelligence
Paraphrase This Document
Need a fresh take? Get an instant paraphrase of this document with our AI Paraphraser
Table of Contents
INTRODUCTION...........................................................................................................................3
PART 1............................................................................................................................................3
1. Identification and evaluation of the tasks that are performed by Microsoft Excel in pre-
processing, analysing, and visualising the data of a particular firm including examination of
the functions that it performs .....................................................................................................3
PART 2............................................................................................................................................7
2.1 Using the nutrition.csv provided in conjunction with SPSS give a specific example of
clustering. Show your workings with screenshots and explain you results................................7
2.2 Analysis and evaluation of the different methods that are used in common data mining and
relating it with the current market examples that are prevailing in the present scenario..........11
2.3 Advantages and disadvantages of SPSS over MS Excel....................................................13
CONCLUSION..............................................................................................................................13
REFRENCES.................................................................................................................................14
INTRODUCTION
Data handling is the process by which data is arranged in appropriate, systematic and
sequential manner. This is one of the most appropriate aspect within current scenario which
makes business to grow and prosper within market. Also due to this damage and disruption of
operations can be done within an organization, if not used in effective or efficient manner. Smile
clinic is an firm that operates within the industry of science since a considerable amount of time
and makes capturing of market in better manner with loyalty of customers base. In this report
things to be covered is based upon brief discussion of the organization which covers those
aspects in which value is presented within time. Further in this report various topics is been
covered that is related to Microsoft Excel and operations to be performed by the organization
for its well being in market. So, as to make sustainability in industry to be developed over long
period of time over its competitors that is prevailed within market. Further this report also covers
Excel’s importance in the company so that it can perform its activities in an appropriate manner.
PART 1
1. Identification and evaluation of the tasks that are performed by Microsoft Excel in pre-
processing, analysing, and visualising the data of a particular firm including examination
of the functions that it performs
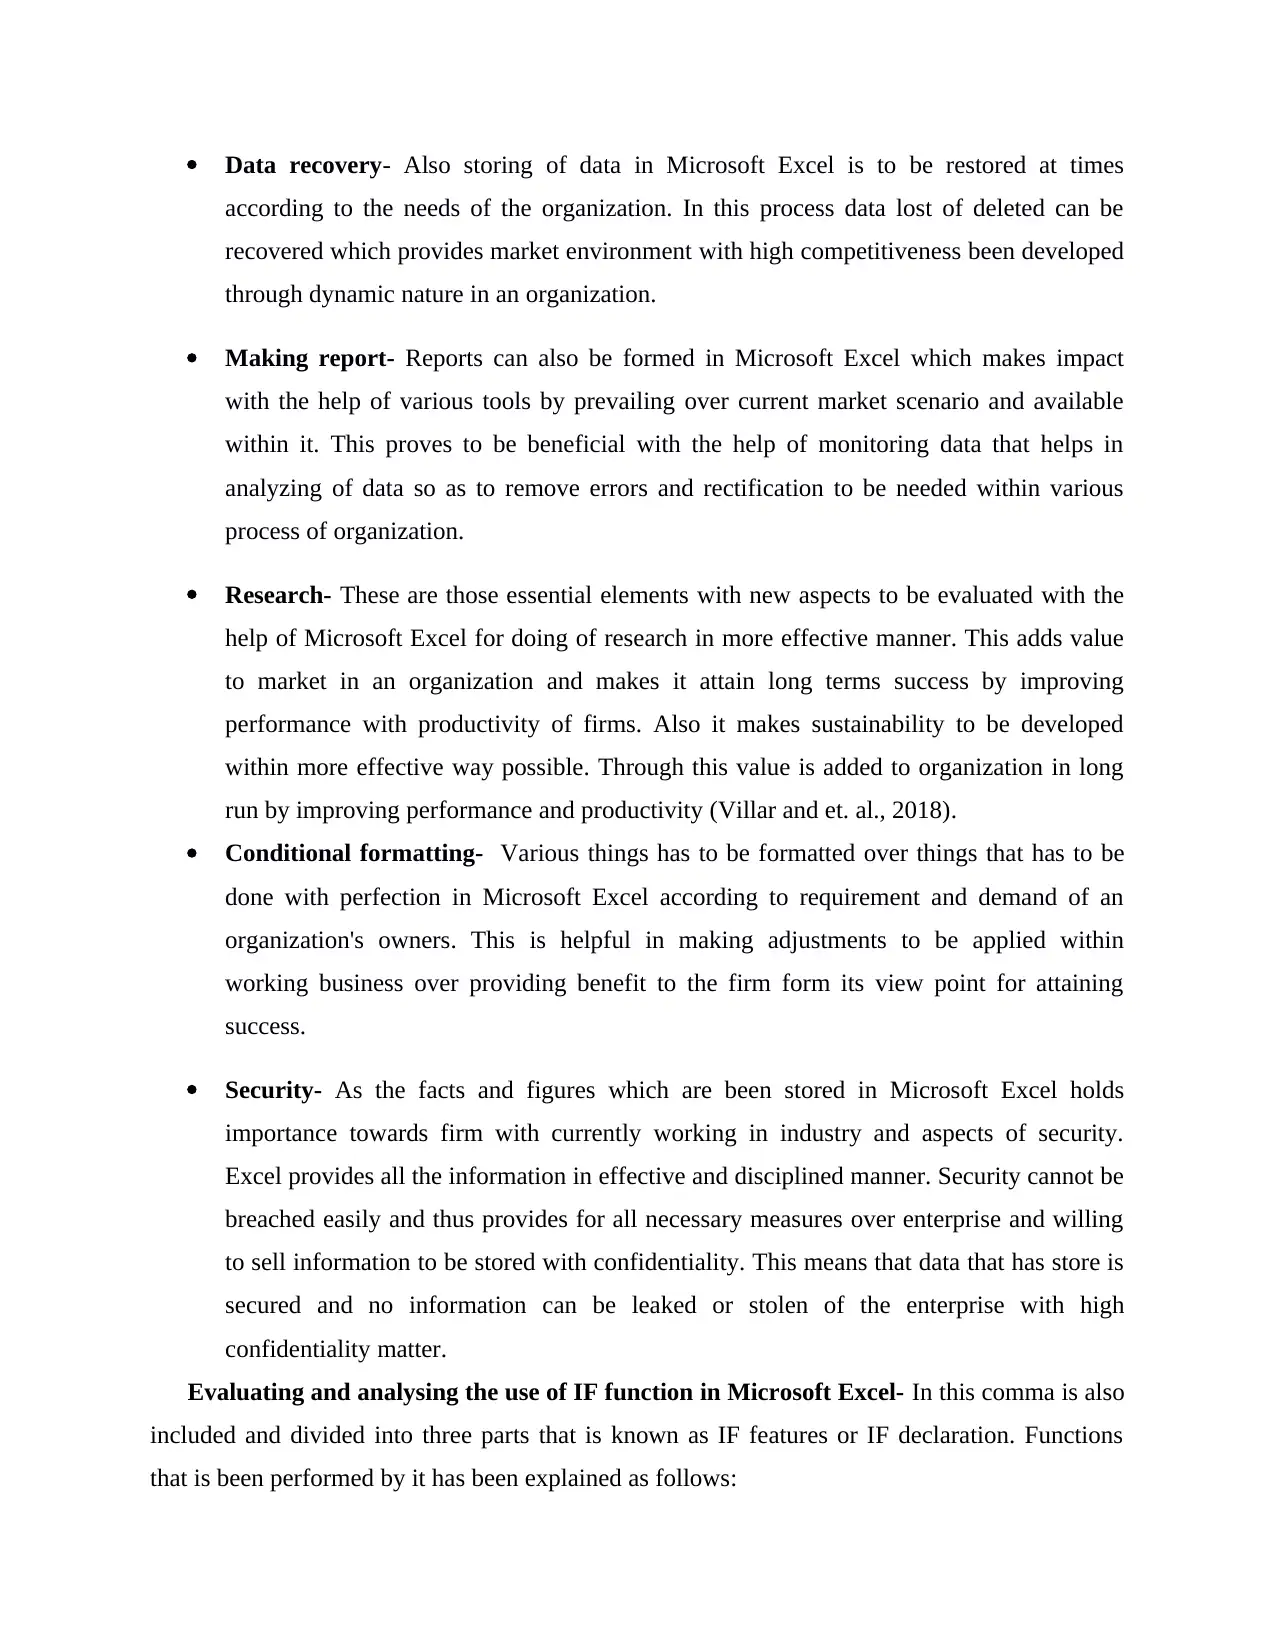
Excel has various kinds of functions to be performed and makes an organization carrying
out its daily transactions in more effective manner so as to increase market value of an
organization in long turn. The main function of it is to help in storing and evaluating of facts,
figures within a business. This makes sustainability to be developed within market that helps in
taking better decision which makes market value to be increased with operations. Various
functions of Microsoft Excel are elaborated below-
Analysing and storing data- It is one of the most important functions of Excel which
makes analysis, evaluation and helps in storing of relevant data in finest manner possible
for an organization over requirements to be fulfilled. This makes problems to be solved
over objectives and goals set by an organization. Different tools and techniques is to be
used over figures more accuracy within future and is helpful for firm (Zhou and et. al.,
2020).
Data handling is the process by which data is arranged in appropriate, systematic and
sequential manner. This is one of the most appropriate aspect within current scenario which
makes business to grow and prosper within market. Also due to this damage and disruption of
operations can be done within an organization, if not used in effective or efficient manner. Smile
clinic is an firm that operates within the industry of science since a considerable amount of time
and makes capturing of market in better manner with loyalty of customers base. In this report
things to be covered is based upon brief discussion of the organization which covers those
aspects in which value is presented within time. Further in this report various topics is been
covered that is related to Microsoft Excel and operations to be performed by the organization
for its well being in market. So, as to make sustainability in industry to be developed over long
period of time over its competitors that is prevailed within market. Further this report also covers
Excel’s importance in the company so that it can perform its activities in an appropriate manner.
PART 1
1. Identification and evaluation of the tasks that are performed by Microsoft Excel in pre-
processing, analysing, and visualising the data of a particular firm including examination
of the functions that it performs
Excel has various kinds of functions to be performed and makes an organization carrying
out its daily transactions in more effective manner so as to increase market value of an
organization in long turn. The main function of it is to help in storing and evaluating of facts,
figures within a business. This makes sustainability to be developed within market that helps in
taking better decision which makes market value to be increased with operations. Various
functions of Microsoft Excel are elaborated below-
Analysing and storing data- It is one of the most important functions of Excel which
makes analysis, evaluation and helps in storing of relevant data in finest manner possible
for an organization over requirements to be fulfilled. This makes problems to be solved
over objectives and goals set by an organization. Different tools and techniques is to be
used over figures more accuracy within future and is helpful for firm (Zhou and et. al.,
2020).
⊘ This is a preview!⊘
Do you want full access?
Subscribe today to unlock all pages.
Trusted by 1+ million students worldwide
Data recovery- Also storing of data in Microsoft Excel is to be restored at times
according to the needs of the organization. In this process data lost of deleted can be
recovered which provides market environment with high competitiveness been developed
through dynamic nature in an organization.
Making report- Reports can also be formed in Microsoft Excel which makes impact
with the help of various tools by prevailing over current market scenario and available
within it. This proves to be beneficial with the help of monitoring data that helps in
analyzing of data so as to remove errors and rectification to be needed within various
process of organization.
Research- These are those essential elements with new aspects to be evaluated with the
help of Microsoft Excel for doing of research in more effective manner. This adds value
to market in an organization and makes it attain long terms success by improving
performance with productivity of firms. Also it makes sustainability to be developed
within more effective way possible. Through this value is added to organization in long
run by improving performance and productivity (Villar and et. al., 2018).
Conditional formatting- Various things has to be formatted over things that has to be
done with perfection in Microsoft Excel according to requirement and demand of an
organization's owners. This is helpful in making adjustments to be applied within
working business over providing benefit to the firm form its view point for attaining
success.
Security- As the facts and figures which are been stored in Microsoft Excel holds
importance towards firm with currently working in industry and aspects of security.
Excel provides all the information in effective and disciplined manner. Security cannot be
breached easily and thus provides for all necessary measures over enterprise and willing
to sell information to be stored with confidentiality. This means that data that has store is
secured and no information can be leaked or stolen of the enterprise with high
confidentiality matter.
Evaluating and analysing the use of IF function in Microsoft Excel- In this comma is also
included and divided into three parts that is known as IF features or IF declaration. Functions
that is been performed by it has been explained as follows:
Paraphrase This Document
Need a fresh take? Get an instant paraphrase of this document with our AI Paraphraser
This helps in making analysis with evaluation to be performed within an organization
while developing revenue and income which is based through indicating level of sales
which is been achieved as per time period provided for it. This helps in making decision
process to be done in simple with step to be followed.
Apart from that all the old figures that are stored in it can be rearranged so that new data
can be generated which can drastically improve and increase the value of the company in
the market in which it is performing (Vallurupalli and Bose, 2018).
Uses of the IF Element form- There are various kinds which has been discussed as follows:
Form code can be shaped with the help of it.
The codes of various cells are to be restrained and check again for removing copying of
work to examine and fulfilling needs with requirements or not.
Various functions have to be revealed with significance of B3 that makes importance to be
attained over value of B3 which is less then B3's variable. It indicates those parameters used in
B1 that the IF parameters is very important than B3 as function is seen. User which makes
operating to be obtained over cell which is B4 file when enter key is pressed. For seeing impact
of its users’ transfer is handled from D4 to cell D8400.
If there are application and user is required to learn about H Lookup and V Lookup factors in
elaborative manner. That is why firstly they should not be confused weather buyer wants it as an
important skill or not. Thus user is considered about all the things in detail if operating is being
done with minimum number possible. This is going to take long for locating and everything in
the data over extension of search (Singh and et. al., 2018).
Lookup Value- It is based upon quest of row that has afterwards development of base row
to the lookup value.
Table series- Series of table is helpful in storing the data with relevant forms within table
series.
Row index number- The number is shown after the sum up of numbering done after the
first row that is numbered as 1 and so on.
[Range_ lookup]- Since there are two sets in table and has to make sure that which one is
correct and which is not correct. In this only this is included.
Evaluation and analysis upon functions which makes lookup over references over scale of an
organization within which Smile clinic has been explained with the help of Microsoft as follows:
Lookup Value- Whether it is column or row input is taken that is generally a question which
provides answer over appropriate format after making examination of factors to be done in
detail. For time requested, selling and revenue various cell is being used that is G2, H2 and I2.
G3, H3 and I3 has to be obtained. Pick the Lookup and then set the cell H3 by using the Lookup
key as G3 cell (Mashingaidze and Backhouse, 2017).
Table series- Choose from A2 to C8400 (A2:C8400) for the whole set.
[Range_ lookup]- Select cell to be purchased, B2 to B8400 (B2:B8400).
Graphs and Charts- Different steps is being included within it and has been explained in
consecutive manner as follows:
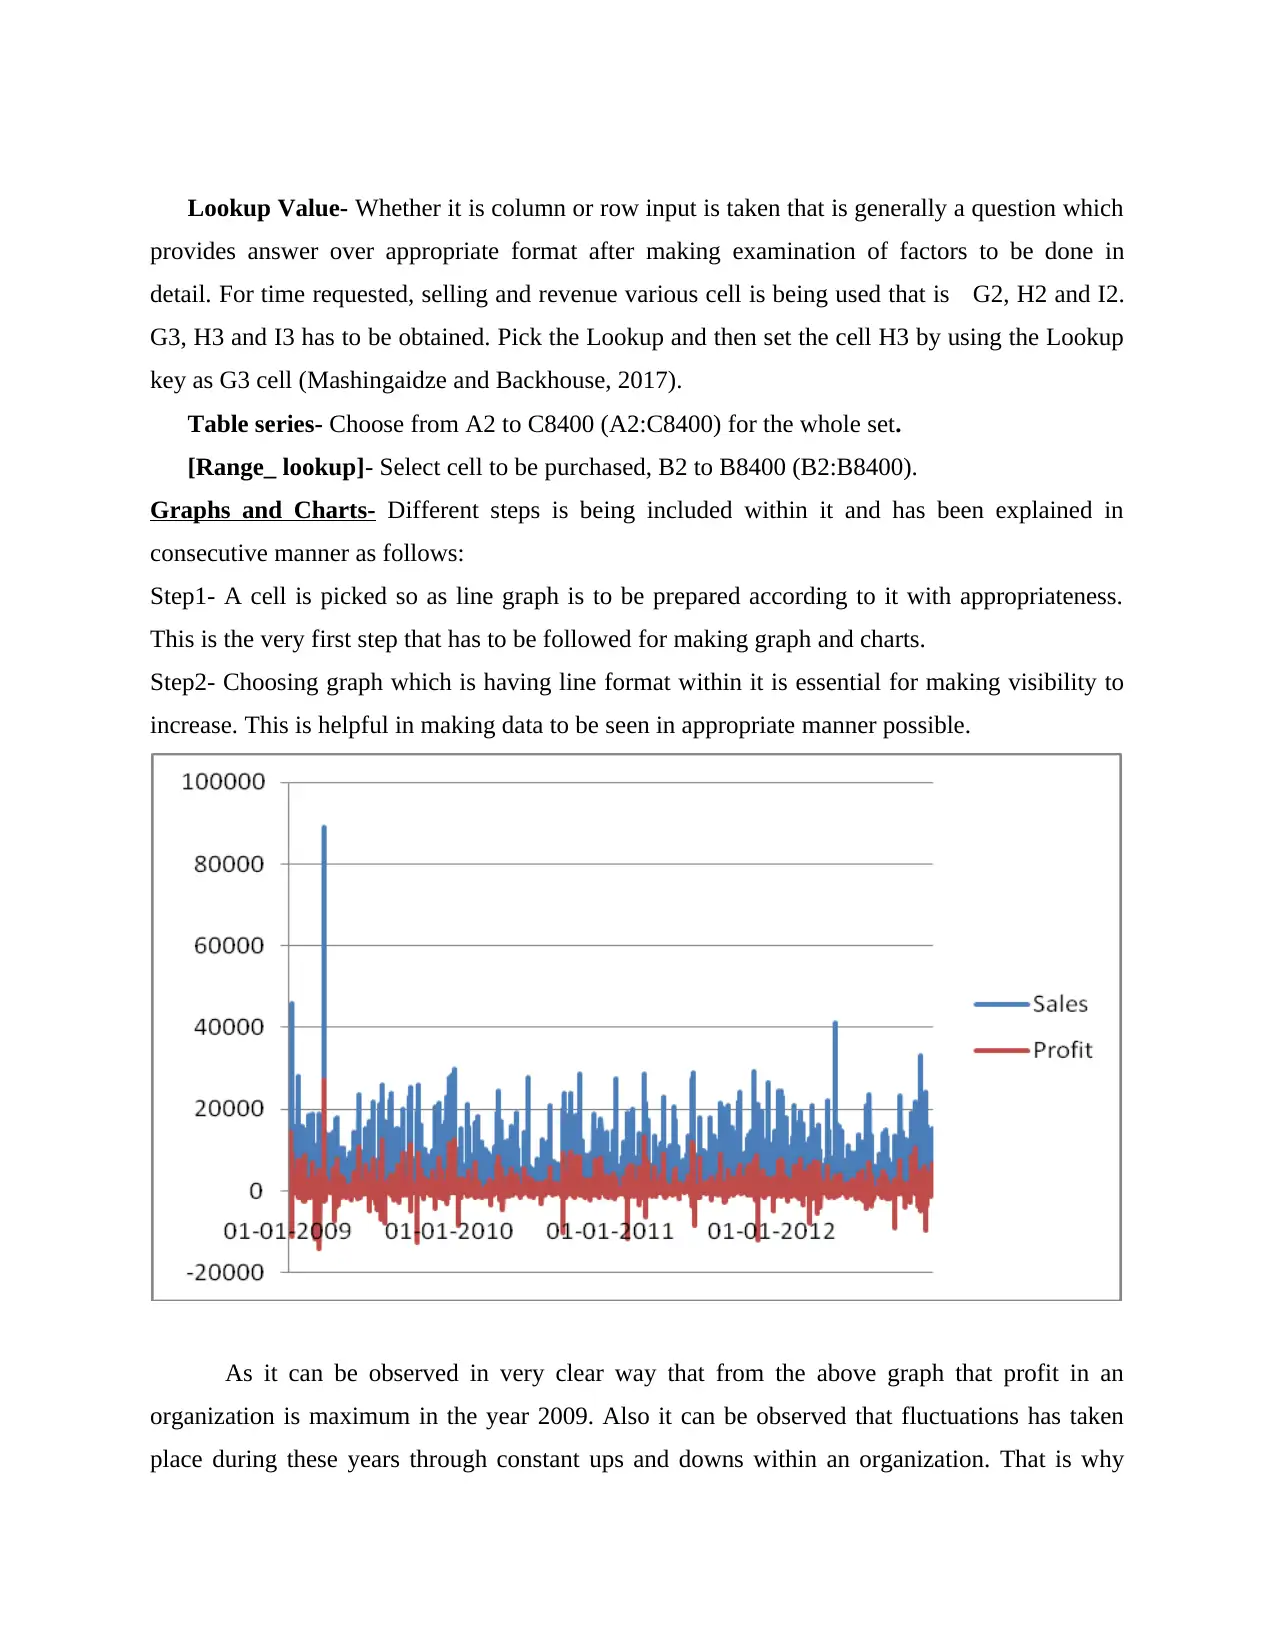
Step1- A cell is picked so as line graph is to be prepared according to it with appropriateness.
This is the very first step that has to be followed for making graph and charts.
Step2- Choosing graph which is having line format within it is essential for making visibility to
increase. This is helpful in making data to be seen in appropriate manner possible.
As it can be observed in very clear way that from the above graph that profit in an
organization is maximum in the year 2009. Also it can be observed that fluctuations has taken
place during these years through constant ups and downs within an organization. That is why
provides answer over appropriate format after making examination of factors to be done in
detail. For time requested, selling and revenue various cell is being used that is G2, H2 and I2.
G3, H3 and I3 has to be obtained. Pick the Lookup and then set the cell H3 by using the Lookup
key as G3 cell (Mashingaidze and Backhouse, 2017).
Table series- Choose from A2 to C8400 (A2:C8400) for the whole set.
[Range_ lookup]- Select cell to be purchased, B2 to B8400 (B2:B8400).
Graphs and Charts- Different steps is being included within it and has been explained in
consecutive manner as follows:
Step1- A cell is picked so as line graph is to be prepared according to it with appropriateness.
This is the very first step that has to be followed for making graph and charts.
Step2- Choosing graph which is having line format within it is essential for making visibility to
increase. This is helpful in making data to be seen in appropriate manner possible.
As it can be observed in very clear way that from the above graph that profit in an
organization is maximum in the year 2009. Also it can be observed that fluctuations has taken
place during these years through constant ups and downs within an organization. That is why
⊘ This is a preview!⊘
Do you want full access?
Subscribe today to unlock all pages.
Trusted by 1+ million students worldwide
organization has faced losses at time during the time it doing business (Kumar and Belwal,
2017).
Row
Labels
Sum of Order
Quantity
Sum of
Discount
Sum of Unit
Price
Sum of Shipping
Cost
2009 54508 105.39 232830.98 28481.76
2010 54379 105.81 162467.59 27354.26
2011 51413 101.67 159653.11 24939.85
2012 54480 104.32 195467.55 27055.17
Grand
Total 214780 417.19 750419.23 107831.04
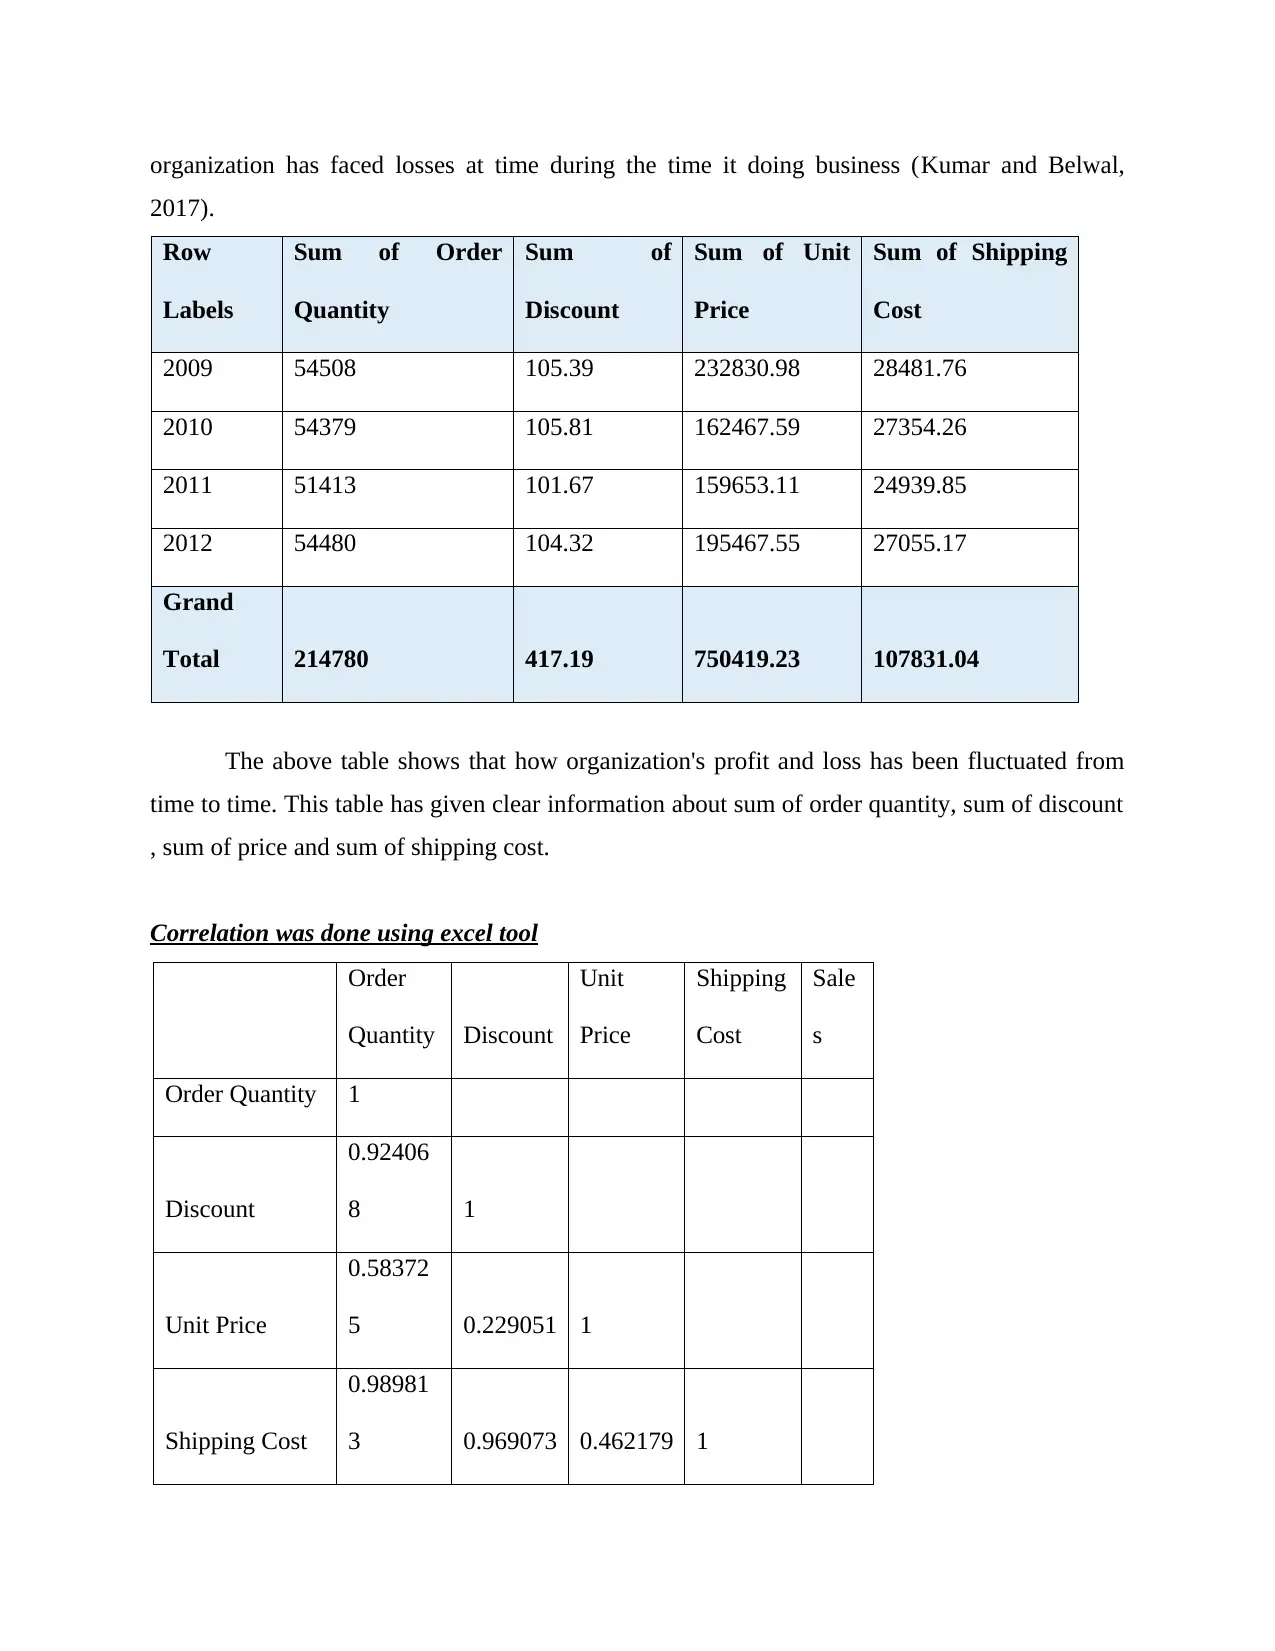
The above table shows that how organization's profit and loss has been fluctuated from
time to time. This table has given clear information about sum of order quantity, sum of discount
, sum of price and sum of shipping cost.
Correlation was done using excel tool
Order
Quantity Discount
Unit
Price
Shipping
Cost
Sale
s
Order Quantity 1
Discount
0.92406
8 1
Unit Price
0.58372
5 0.229051 1
Shipping Cost
0.98981
3 0.969073 0.462179 1
2017).
Row
Labels
Sum of Order
Quantity
Sum of
Discount
Sum of Unit
Price
Sum of Shipping
Cost
2009 54508 105.39 232830.98 28481.76
2010 54379 105.81 162467.59 27354.26
2011 51413 101.67 159653.11 24939.85
2012 54480 104.32 195467.55 27055.17
Grand
Total 214780 417.19 750419.23 107831.04
The above table shows that how organization's profit and loss has been fluctuated from
time to time. This table has given clear information about sum of order quantity, sum of discount
, sum of price and sum of shipping cost.
Correlation was done using excel tool
Order
Quantity Discount
Unit
Price
Shipping
Cost
Sale
s
Order Quantity 1
Discount
0.92406
8 1
Unit Price
0.58372
5 0.229051 1
Shipping Cost
0.98981
3 0.969073 0.462179 1
Paraphrase This Document
Need a fresh take? Get an instant paraphrase of this document with our AI Paraphraser
Sales
0.85462
1 0.591255 0.920471 0.77
PART 2
2.1 Using the nutrition.csv provided in conjunction with SPSS give a specific example of
clustering. Show your workings with screenshots and explain you results.
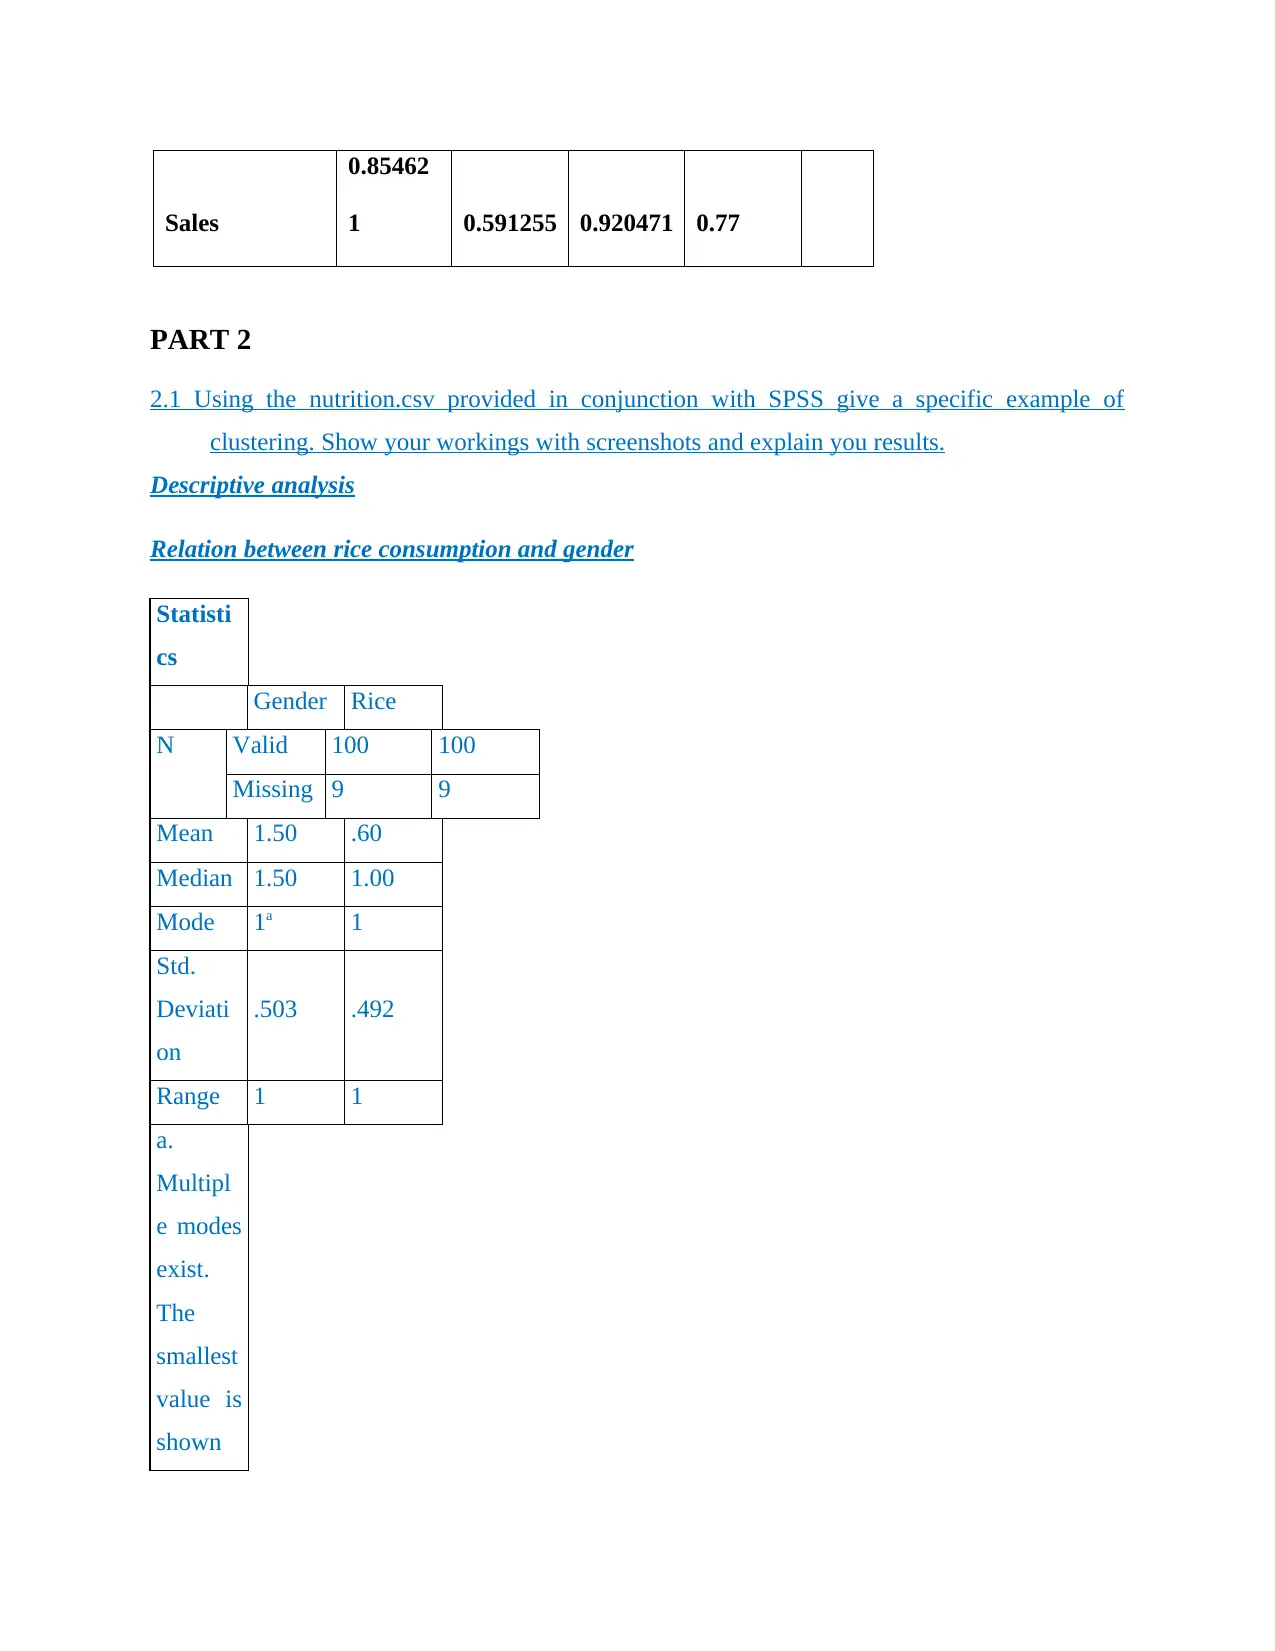
Descriptive analysis
Relation between rice consumption and gender
Statisti
cs
Gender Rice
N Valid 100 100
Missing 9 9
Mean 1.50 .60
Median 1.50 1.00
Mode 1a 1
Std.
Deviati
on
.503 .492
Range 1 1
a.
Multipl
e modes
exist.
The
smallest
value is
shown
0.85462
1 0.591255 0.920471 0.77
PART 2
2.1 Using the nutrition.csv provided in conjunction with SPSS give a specific example of
clustering. Show your workings with screenshots and explain you results.
Descriptive analysis
Relation between rice consumption and gender
Statisti
cs
Gender Rice
N Valid 100 100
Missing 9 9
Mean 1.50 .60
Median 1.50 1.00
Mode 1a 1
Std.
Deviati
on
.503 .492
Range 1 1
a.
Multipl
e modes
exist.
The
smallest
value is
shown
Gender
Frequency Percent
Valid
Percent
Cumulativ
e Percent
Valid 1 50 45.9 50.0 50.0
2 50 45.9 50.0 100.0
Total 100 91.7 100.0
Missing System 9 8.3
Total 109 100.0
Rice
Frequency Percent
Valid
Percent
Cumulativ
e Percent
Valid 0 40 36.7 40.0 40.0
1 60 55.0 60.0 100.0
Total 100 91.7 100.0
Missing System 9 8.3
Total 109 100.0
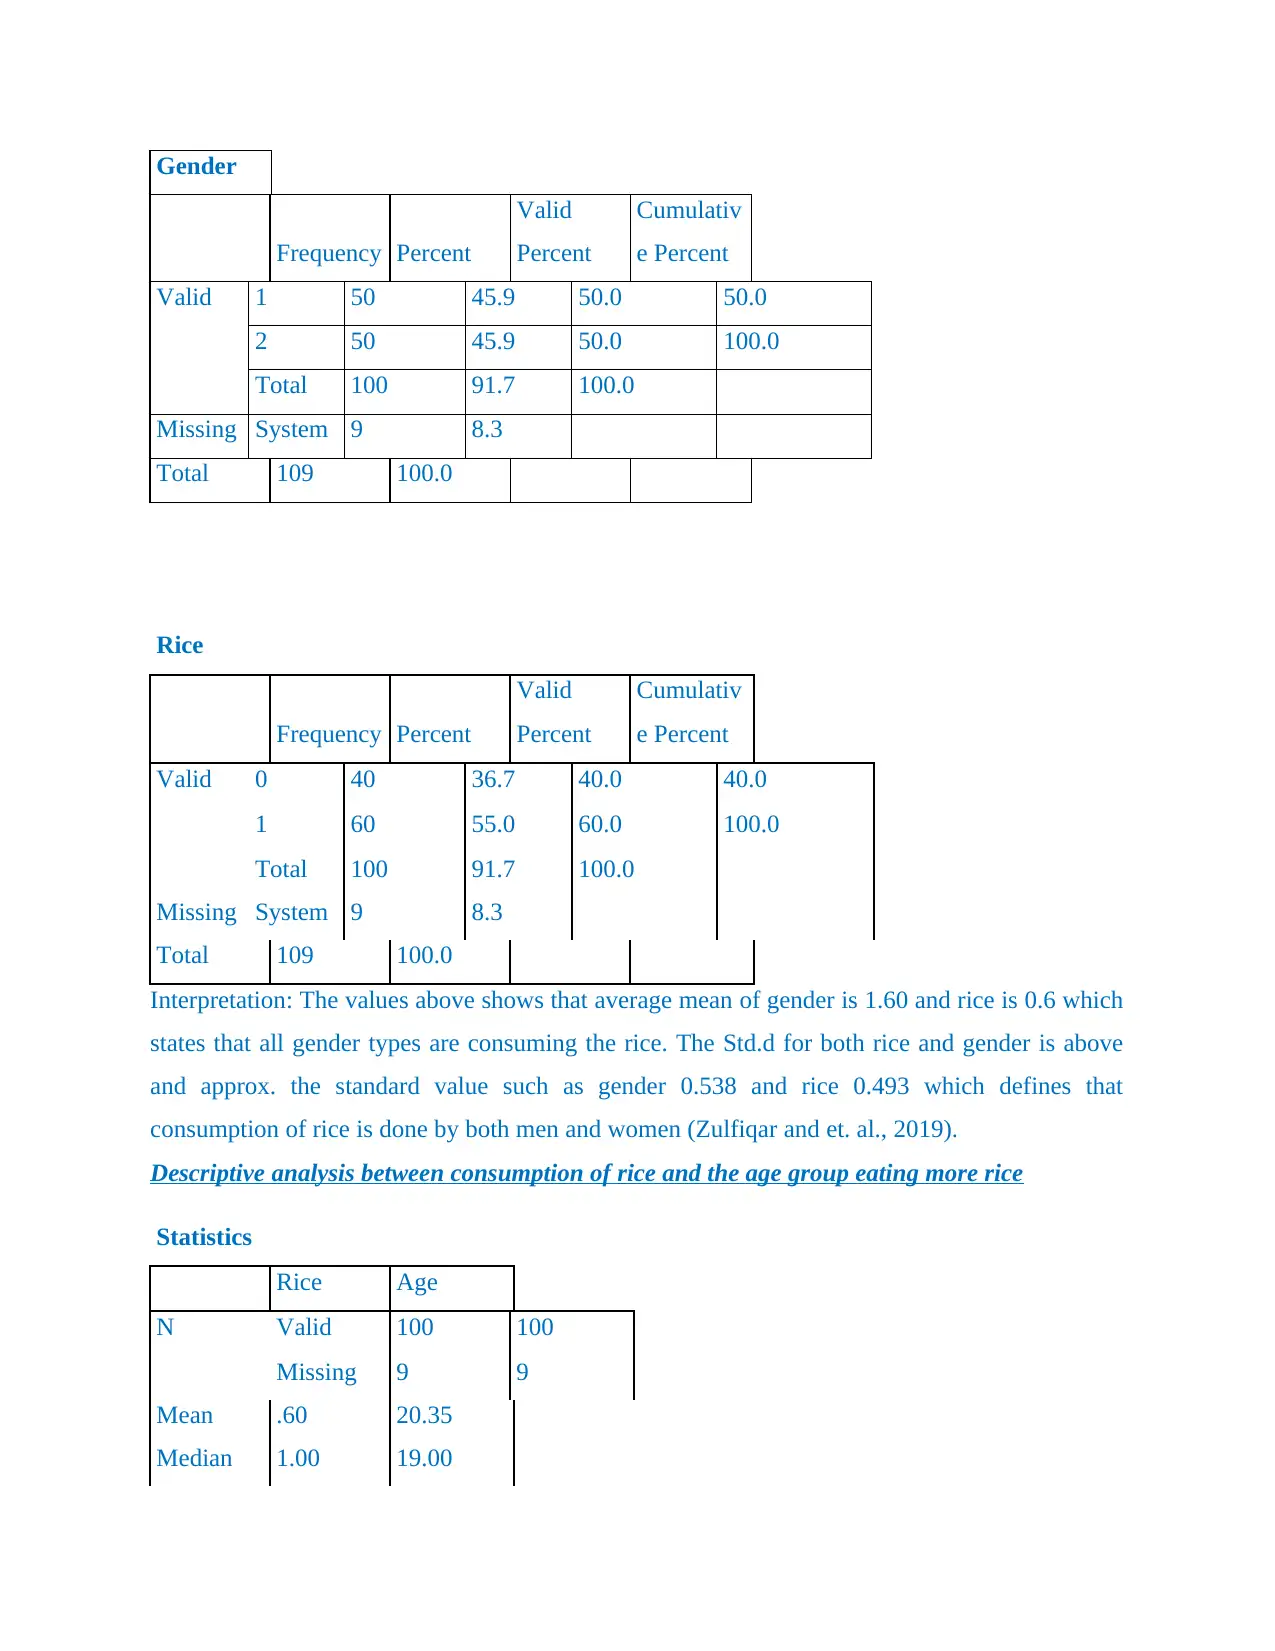
Interpretation: The values above shows that average mean of gender is 1.60 and rice is 0.6 which
states that all gender types are consuming the rice. The Std.d for both rice and gender is above
and approx. the standard value such as gender 0.538 and rice 0.493 which defines that
consumption of rice is done by both men and women (Zulfiqar and et. al., 2019).
Descriptive analysis between consumption of rice and the age group eating more rice
Statistics
Rice Age
N Valid 100 100
Missing 9 9
Mean .60 20.35
Median 1.00 19.00
Frequency Percent
Valid
Percent
Cumulativ
e Percent
Valid 1 50 45.9 50.0 50.0
2 50 45.9 50.0 100.0
Total 100 91.7 100.0
Missing System 9 8.3
Total 109 100.0
Rice
Frequency Percent
Valid
Percent
Cumulativ
e Percent
Valid 0 40 36.7 40.0 40.0
1 60 55.0 60.0 100.0
Total 100 91.7 100.0
Missing System 9 8.3
Total 109 100.0
Interpretation: The values above shows that average mean of gender is 1.60 and rice is 0.6 which
states that all gender types are consuming the rice. The Std.d for both rice and gender is above
and approx. the standard value such as gender 0.538 and rice 0.493 which defines that
consumption of rice is done by both men and women (Zulfiqar and et. al., 2019).
Descriptive analysis between consumption of rice and the age group eating more rice
Statistics
Rice Age
N Valid 100 100
Missing 9 9
Mean .60 20.35
Median 1.00 19.00
⊘ This is a preview!⊘
Do you want full access?
Subscribe today to unlock all pages.
Trusted by 1+ million students worldwide
Mode 1 22
Std.
Deviation .492 3.560
Range 1 13
Rice
Frequency Percent
Valid
Percent
Cumulativ
e Percent
Valid 0 40 36.7 40.0 40.0
1 60 55.0 60.0 100.0
Total 100 91.7 100.0
Missing System 9 8.3
Total 109 100.0
Age
Frequency Percent
Valid
Percent
Cumulativ
e Percent
Valid 13 5 4.6 5.0 5.0
15 5 4.6 5.0 10.0
17 8 7.3 8.0 18.0
18 13 11.9 13.0 31.0
19 20 18.3 20.0 51.0
20 5 4.6 5.0 56.0
22 21 19.3 21.0 77.0
23 1 .9 1.0 78.0
25 12 11.0 12.0 90.0
26 10 9.2 10.0 100.0
Total 100 91.7 100.0
Missing System 9 8.3
Total 109 100.0
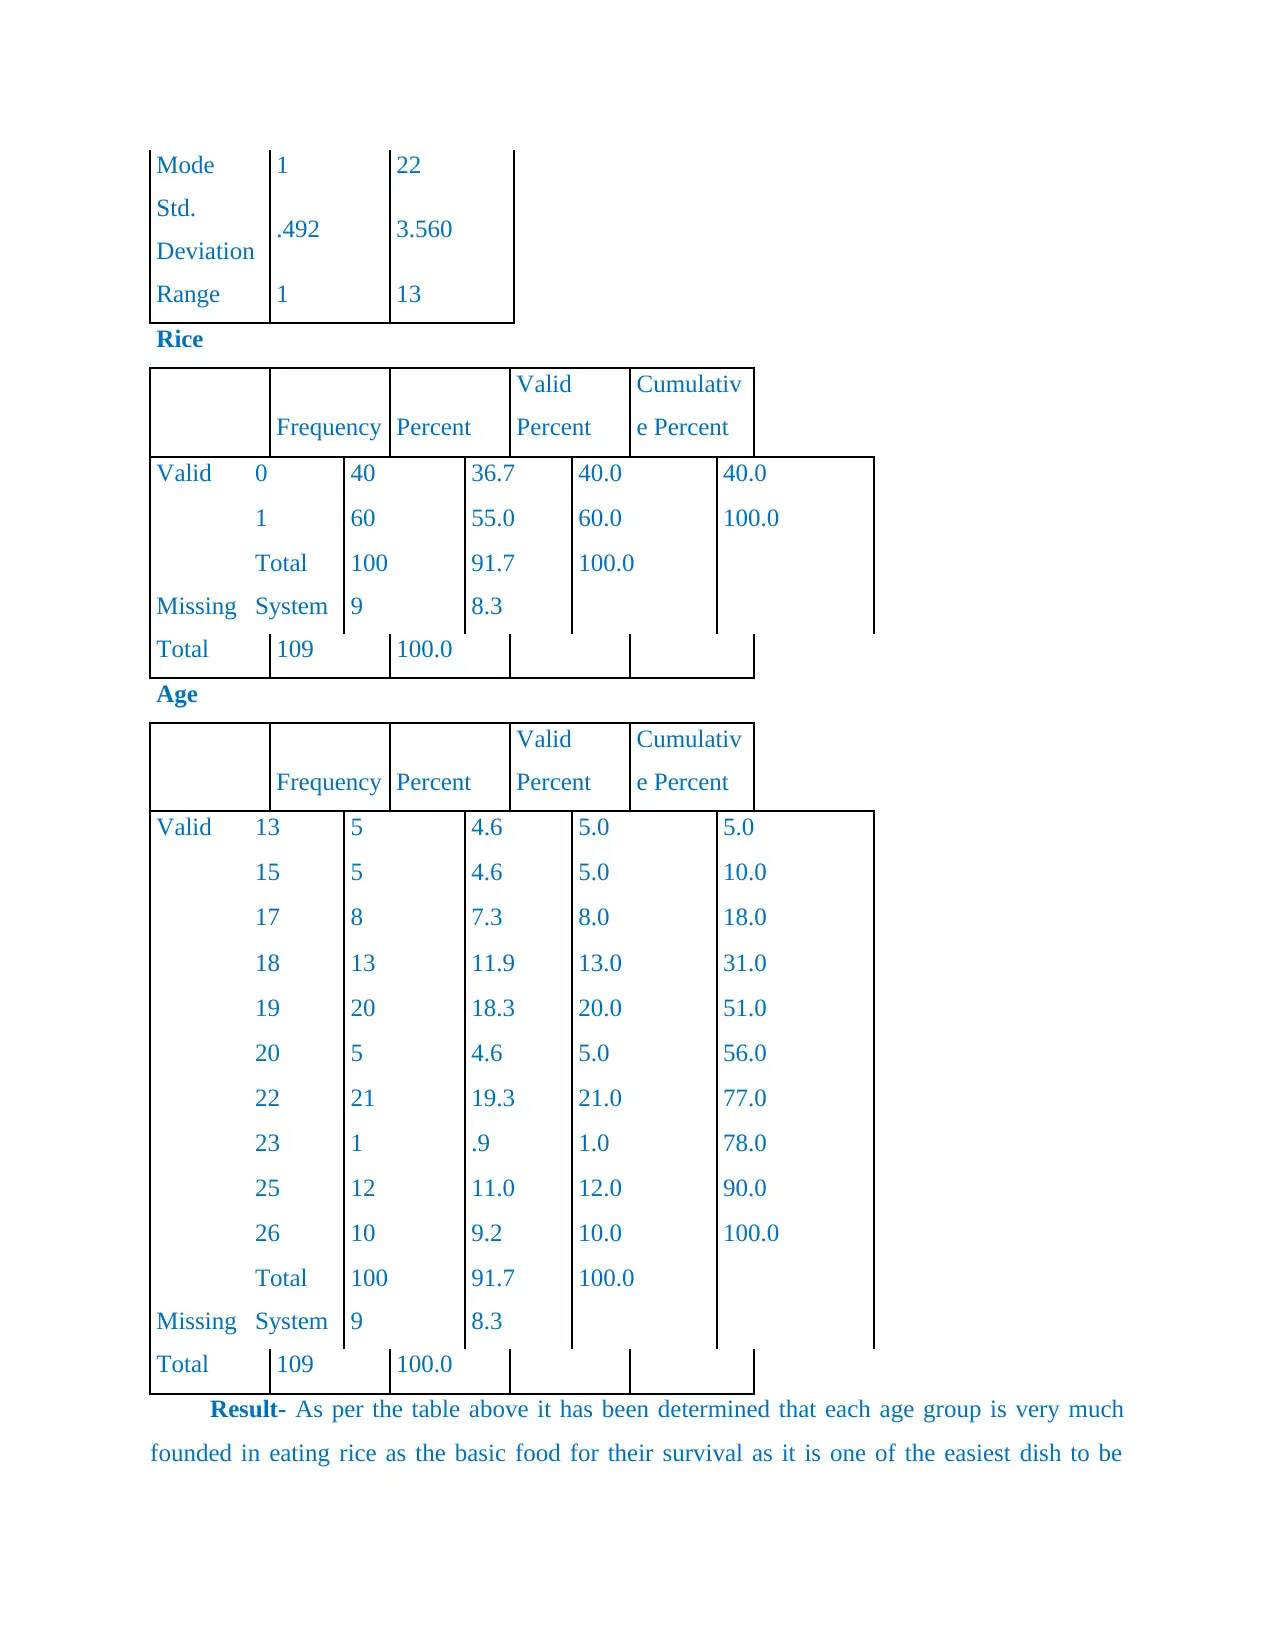
Result- As per the table above it has been determined that each age group is very much
founded in eating rice as the basic food for their survival as it is one of the easiest dish to be
Std.
Deviation .492 3.560
Range 1 13
Rice
Frequency Percent
Valid
Percent
Cumulativ
e Percent
Valid 0 40 36.7 40.0 40.0
1 60 55.0 60.0 100.0
Total 100 91.7 100.0
Missing System 9 8.3
Total 109 100.0
Age
Frequency Percent
Valid
Percent
Cumulativ
e Percent
Valid 13 5 4.6 5.0 5.0
15 5 4.6 5.0 10.0
17 8 7.3 8.0 18.0
18 13 11.9 13.0 31.0
19 20 18.3 20.0 51.0
20 5 4.6 5.0 56.0
22 21 19.3 21.0 77.0
23 1 .9 1.0 78.0
25 12 11.0 12.0 90.0
26 10 9.2 10.0 100.0
Total 100 91.7 100.0
Missing System 9 8.3
Total 109 100.0
Result- As per the table above it has been determined that each age group is very much
founded in eating rice as the basic food for their survival as it is one of the easiest dish to be
Paraphrase This Document
Need a fresh take? Get an instant paraphrase of this document with our AI Paraphraser
cooked in less time (Kiani Mavi and Standing, 2018). The value of standard deviation is 3.52
which clearly states that peoples of almost every age eat rice whenever needed.
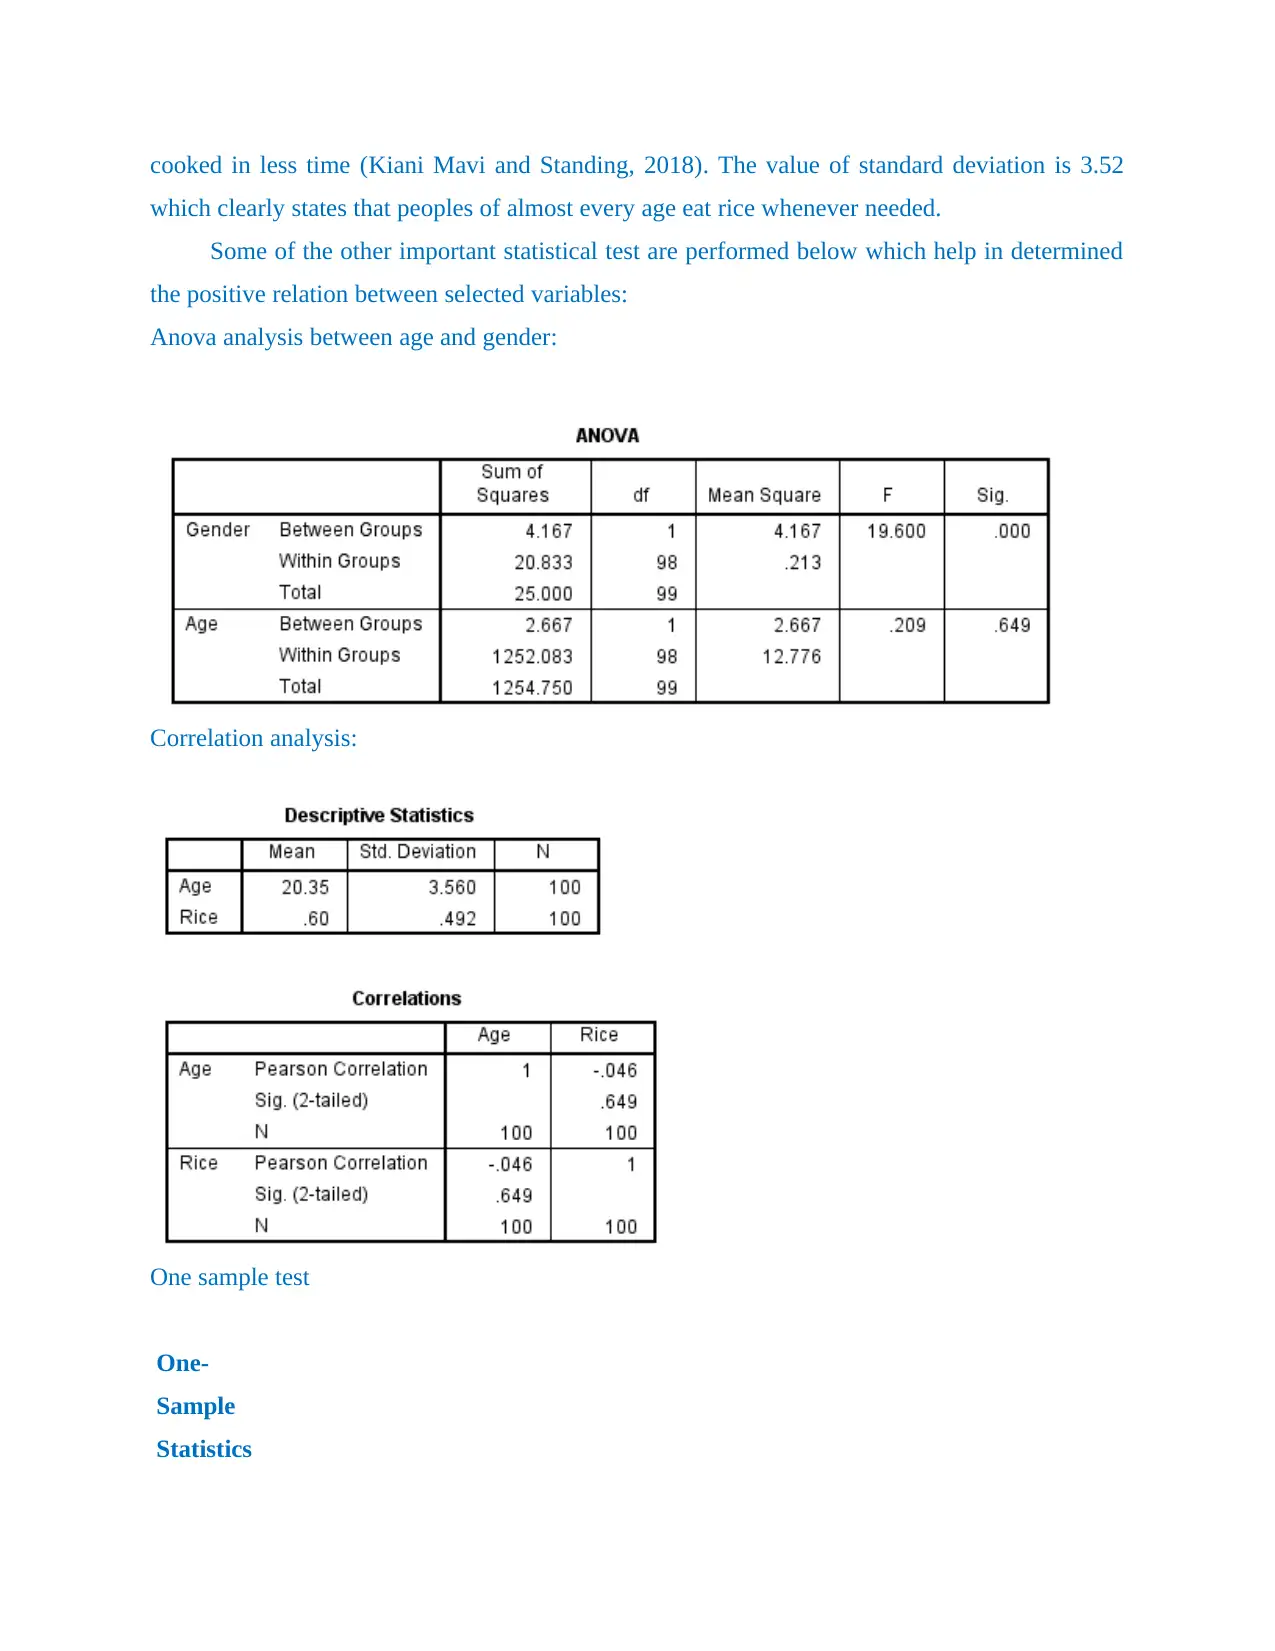
Some of the other important statistical test are performed below which help in determined
the positive relation between selected variables:
Anova analysis between age and gender:
Correlation analysis:
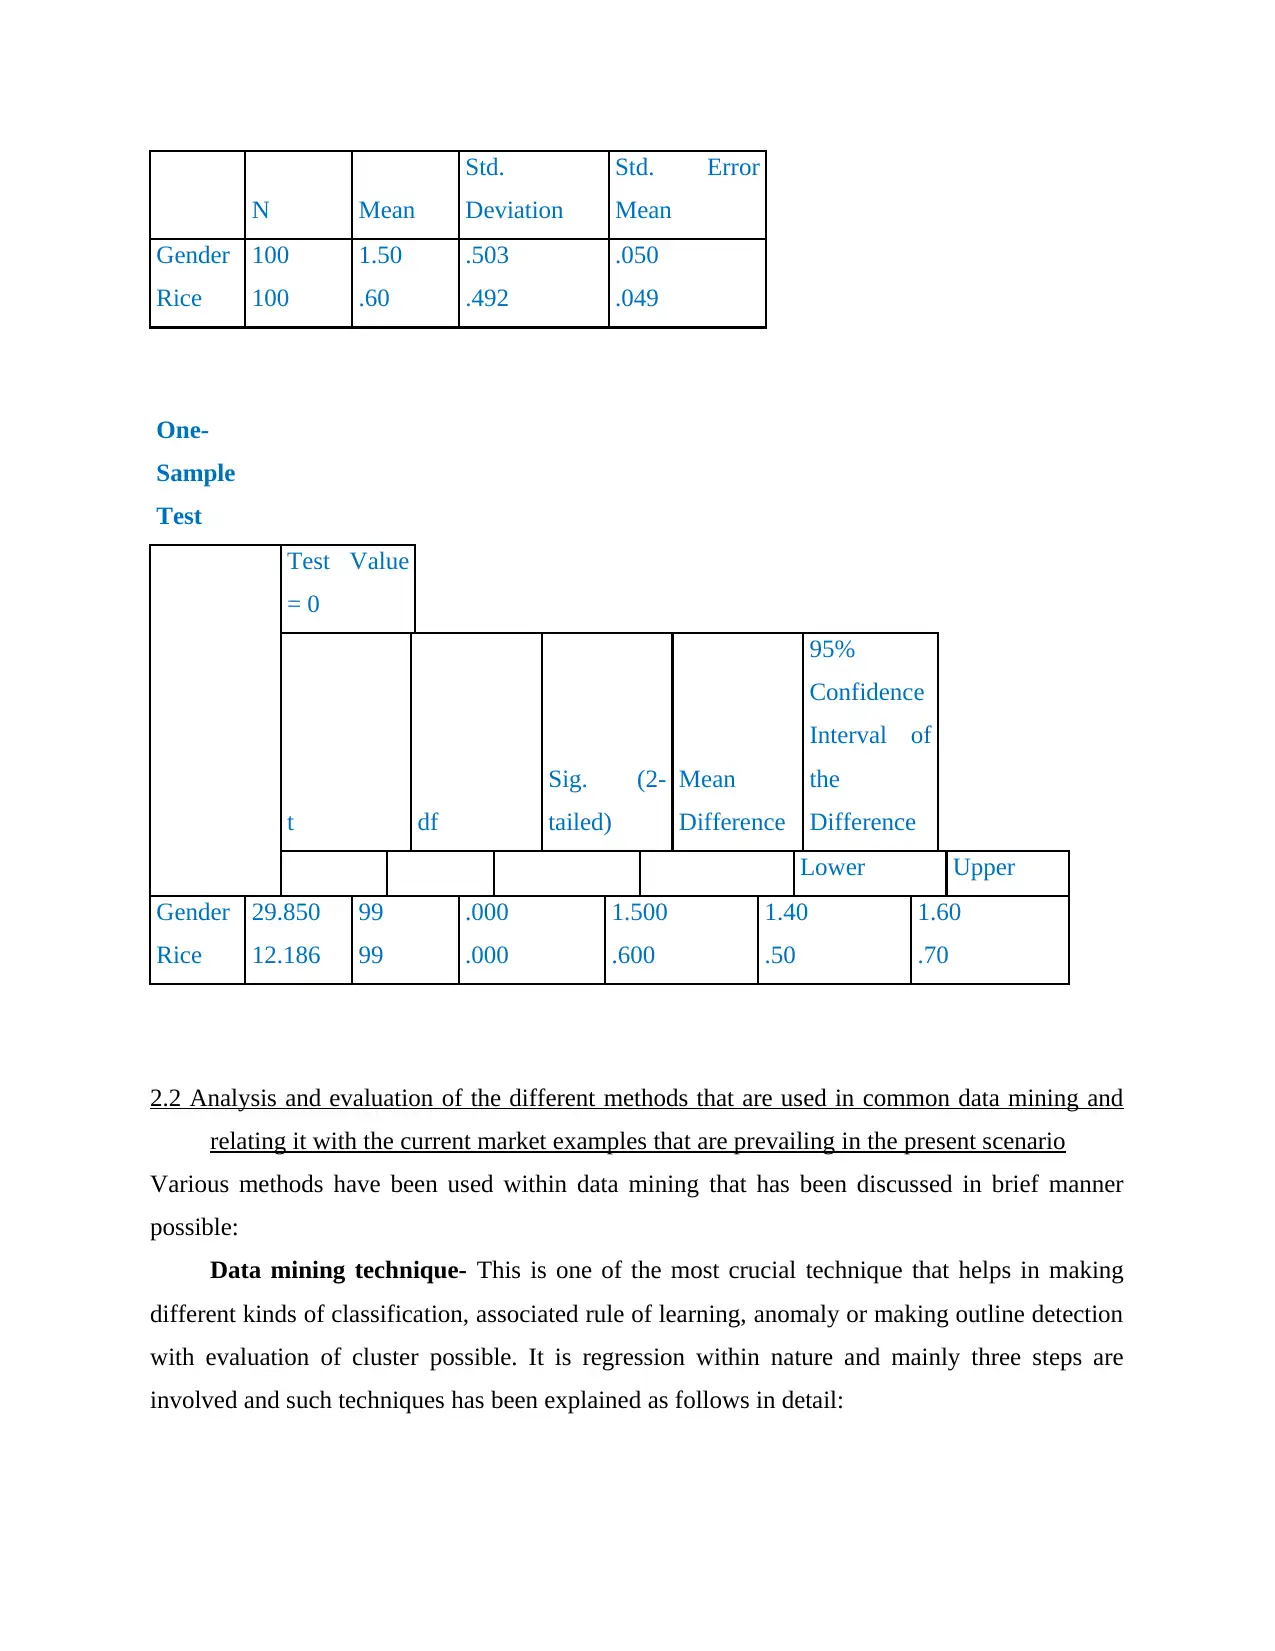
One sample test
One-
Sample
Statistics
which clearly states that peoples of almost every age eat rice whenever needed.
Some of the other important statistical test are performed below which help in determined
the positive relation between selected variables:
Anova analysis between age and gender:
Correlation analysis:
One sample test
One-
Sample
Statistics
N Mean
Std.
Deviation
Std. Error
Mean
Gender 100 1.50 .503 .050
Rice 100 .60 .492 .049
One-
Sample
Test
Test Value
= 0
t df
Sig. (2-
tailed)
Mean
Difference
95%
Confidence
Interval of
the
Difference
Lower Upper
Gender 29.850 99 .000 1.500 1.40 1.60
Rice 12.186 99 .000 .600 .50 .70
2.2 Analysis and evaluation of the different methods that are used in common data mining and
relating it with the current market examples that are prevailing in the present scenario
Various methods have been used within data mining that has been discussed in brief manner
possible:
Data mining technique- This is one of the most crucial technique that helps in making
different kinds of classification, associated rule of learning, anomaly or making outline detection
with evaluation of cluster possible. It is regression within nature and mainly three steps are
involved and such techniques has been explained as follows in detail:
⊘ This is a preview!⊘
Do you want full access?
Subscribe today to unlock all pages.
Trusted by 1+ million students worldwide
1 out of 16
Related Documents


Your All-in-One AI-Powered Toolkit for Academic Success.
+13062052269
info@desklib.com
Available 24*7 on WhatsApp / Email
![[object Object]](/_next/static/media/star-bottom.7253800d.svg)
Unlock your academic potential
Copyright © 2020–2026 A2Z Services. All Rights Reserved. Developed and managed by ZUCOL.