Report: Data Handling and Business Intelligence Trends and Analysis
VerifiedAdded on 2023/01/11
|14
|3773
|50
Report
AI Summary
This report delves into the crucial aspects of data handling and business intelligence, examining current trends in data warehousing, business intelligence, and data mining. It assesses the utility of Excel for data pre-processing, analysis, and visualization, including the use of pivot tables and graphs to determine relationships between variables like shipment mode, sales, and profit. The report also explores the application of Weka, a machine learning tool, providing an example of its use in clustering data for an Audi dealership. It compares the advantages and disadvantages of Weka over Excel. The analysis includes the interpretation of sales and profit data across customer segments and product categories, demonstrating the importance of data-driven decision-making for organizational success.
Data handling and business
intelligence
intelligence
Paraphrase This Document
Need a fresh take? Get an instant paraphrase of this document with our AI Paraphraser
TABLE OF CONTENTS
INTRODUCTION...........................................................................................................................1
MAIN BODY...................................................................................................................................1
PART 1............................................................................................................................................1
Current trends in data warehousing, business intelligence and data mining...............................1
Evaluating the use of Excel for pre- processing the data and determining the data...................4
PART 2............................................................................................................................................6
2.1 Providing the conjunction with Weka through an example..................................................6
2.2 Explain the most common methods associated with data mining which are used by the
organization.................................................................................................................................8
2.3 Critically evaluating the advantages and disadvantages of Weka over Excel......................9
CONCLUSION..............................................................................................................................10
REFERENCES..............................................................................................................................11
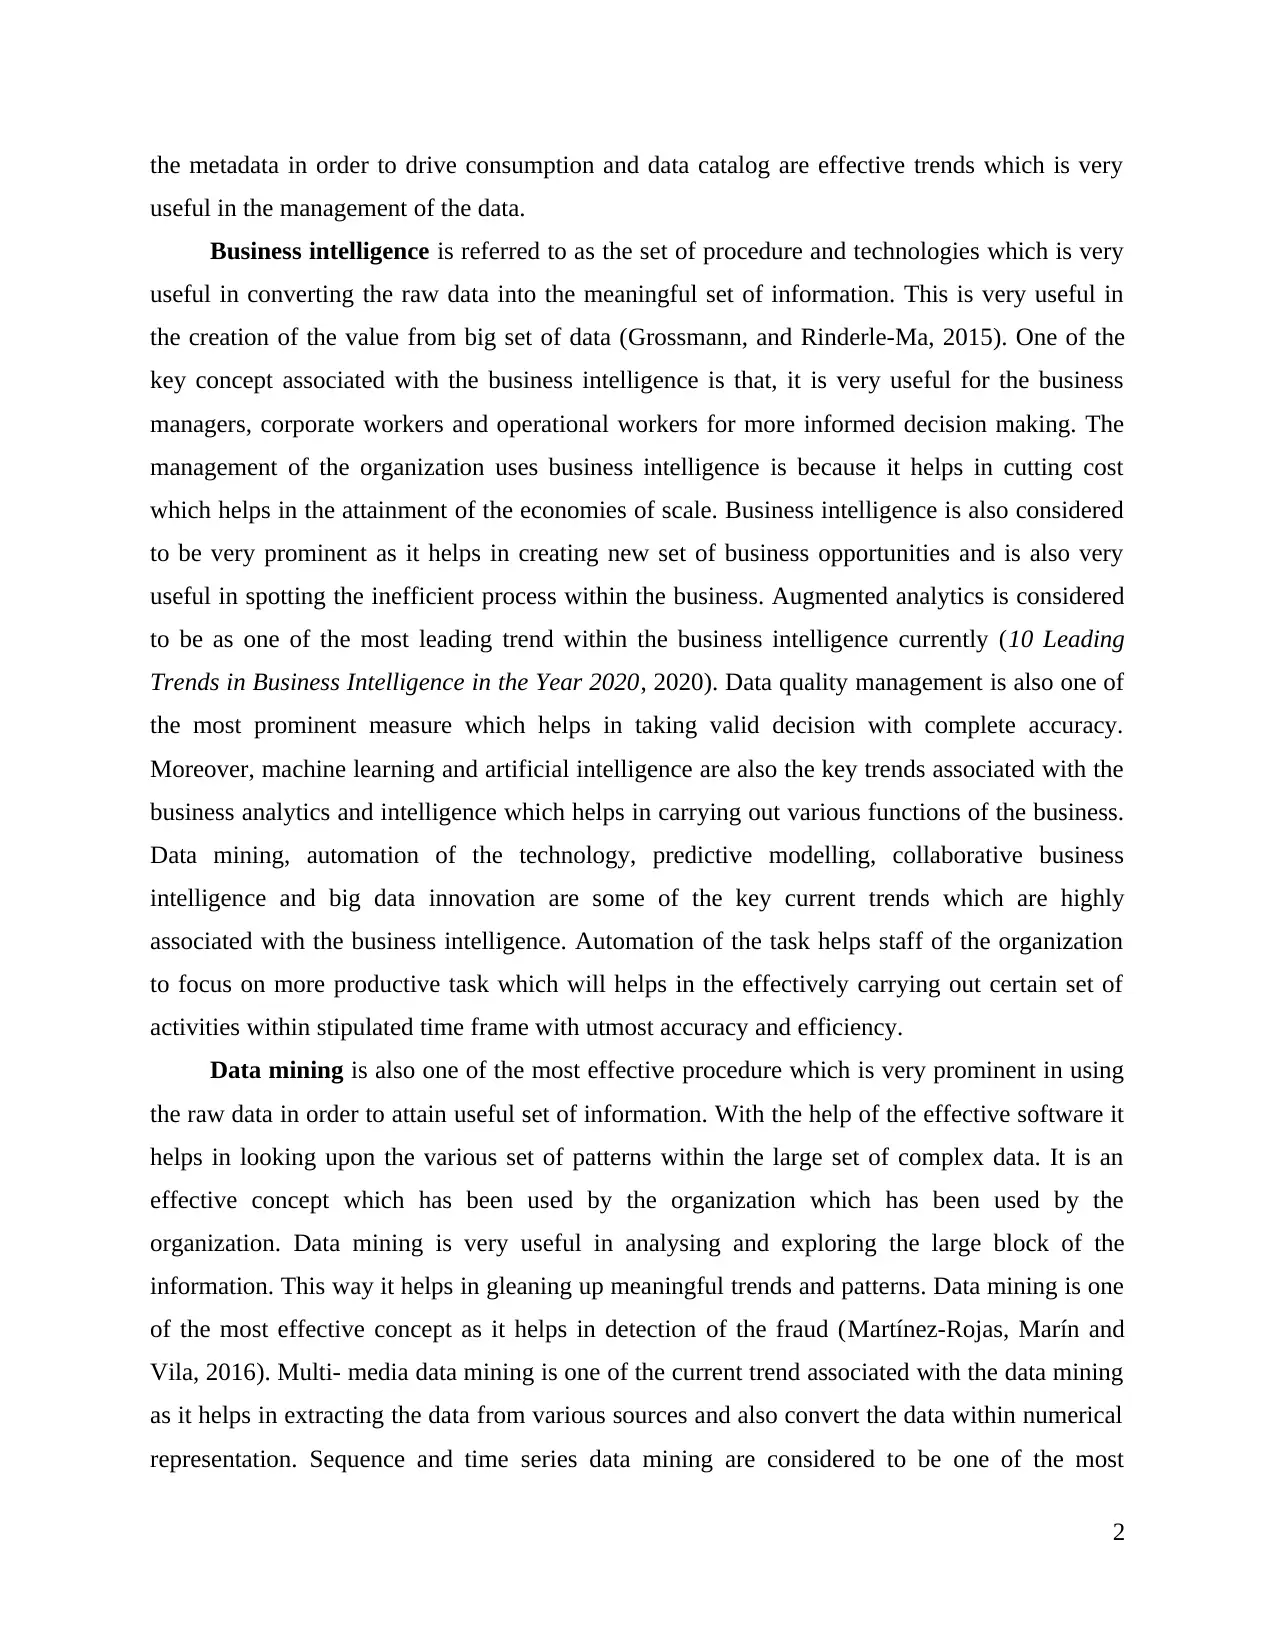
INTRODUCTION
Data handling is one of the most prominent procedure which helps in ensuring that the
data upon which research has been carried out is stored and disposed- off in a secure manner. It
is useful in managing the data both electronically as well as non- electronically (Obeidat and
et.al., 2015). Moreover, business intelligence is referred to as the set of procedure and
technologies which is very useful in converting the raw data into the meaningful set of
information. This is very useful in the creation of the value from big set of data. This study will
evaluate the current trends in data warehousing, business intelligence and data mining.
Moreover, this study is very useful as it helps in evaluating the Excel for visualising and
analysing the various data sets. This report will focus on evaluating the working of the Weka and
evaluating most common methods of data mining which can be used by organization. Moreover,
this study helps in predicting advantage or disadvantage of Weka tool.
MAIN BODY
PART 1
Current trends in data warehousing, business intelligence and data mining.
The current trend associated with the business intelligence, data warehousing and data
mining are considered to be of relevant importance for every organization because it helps in the
high degree of attainment of the operational goals and objectives. These trends are considered to
be of relevant importance as it helps in storing and classifying data which are highly suitable for
the decision making. Data warehousing is one of the effective procedure which helps in
effective using and constructing of the data warehouse (Kasemsap, 2015). A data warehouse is
very useful because it helps in supporting management to take strategic decision which leads to
the attainment of the goals and objectives of the organization. Information of technology is
considered to be as one of the most prominent measure which helps in understanding the
complex set of big data. Moreover, data warehousing is very prominent as it helps in protecting
large set of data which is very useful in enhancing the practice associated with the data
warehousing. It helps the individual in accessing the large data sets from anywhere across the
globe by the use of electronic devices. Big data analytics, effective cloud system are the key
trends which are useful for the effective functioning of the company. Adoption and integration
1
⊘ This is a preview!⊘
Do you want full access?
Subscribe today to unlock all pages.
Trusted by 1+ million students worldwide
the metadata in order to drive consumption and data catalog are effective trends which is very
useful in the management of the data.
Business intelligence is referred to as the set of procedure and technologies which is very
useful in converting the raw data into the meaningful set of information. This is very useful in
the creation of the value from big set of data (Grossmann, and Rinderle-Ma, 2015). One of the
key concept associated with the business intelligence is that, it is very useful for the business
managers, corporate workers and operational workers for more informed decision making. The
management of the organization uses business intelligence is because it helps in cutting cost
which helps in the attainment of the economies of scale. Business intelligence is also considered
to be very prominent as it helps in creating new set of business opportunities and is also very
useful in spotting the inefficient process within the business. Augmented analytics is considered
to be as one of the most leading trend within the business intelligence currently (10 Leading
Trends in Business Intelligence in the Year 2020, 2020). Data quality management is also one of
the most prominent measure which helps in taking valid decision with complete accuracy.
Moreover, machine learning and artificial intelligence are also the key trends associated with the
business analytics and intelligence which helps in carrying out various functions of the business.
Data mining, automation of the technology, predictive modelling, collaborative business
intelligence and big data innovation are some of the key current trends which are highly
associated with the business intelligence. Automation of the task helps staff of the organization
to focus on more productive task which will helps in the effectively carrying out certain set of
activities within stipulated time frame with utmost accuracy and efficiency.
Data mining is also one of the most effective procedure which is very prominent in using
the raw data in order to attain useful set of information. With the help of the effective software it
helps in looking upon the various set of patterns within the large set of complex data. It is an
effective concept which has been used by the organization which has been used by the
organization. Data mining is very useful in analysing and exploring the large block of the
information. This way it helps in gleaning up meaningful trends and patterns. Data mining is one
of the most effective concept as it helps in detection of the fraud (Martínez-Rojas, Marín and
Vila, 2016). Multi- media data mining is one of the current trend associated with the data mining
as it helps in extracting the data from various sources and also convert the data within numerical
representation. Sequence and time series data mining are considered to be one of the most
2
Paraphrase This Document
Need a fresh take? Get an instant paraphrase of this document with our AI Paraphraser
effective trend because it helps in analysing the events which helps in accessing the various key
elements. Data mining techniques are considered to be one of the most appropriate technique
such as regression, regression and classification which are considered to appropriate trends
which helps in evaluating complex set of data.
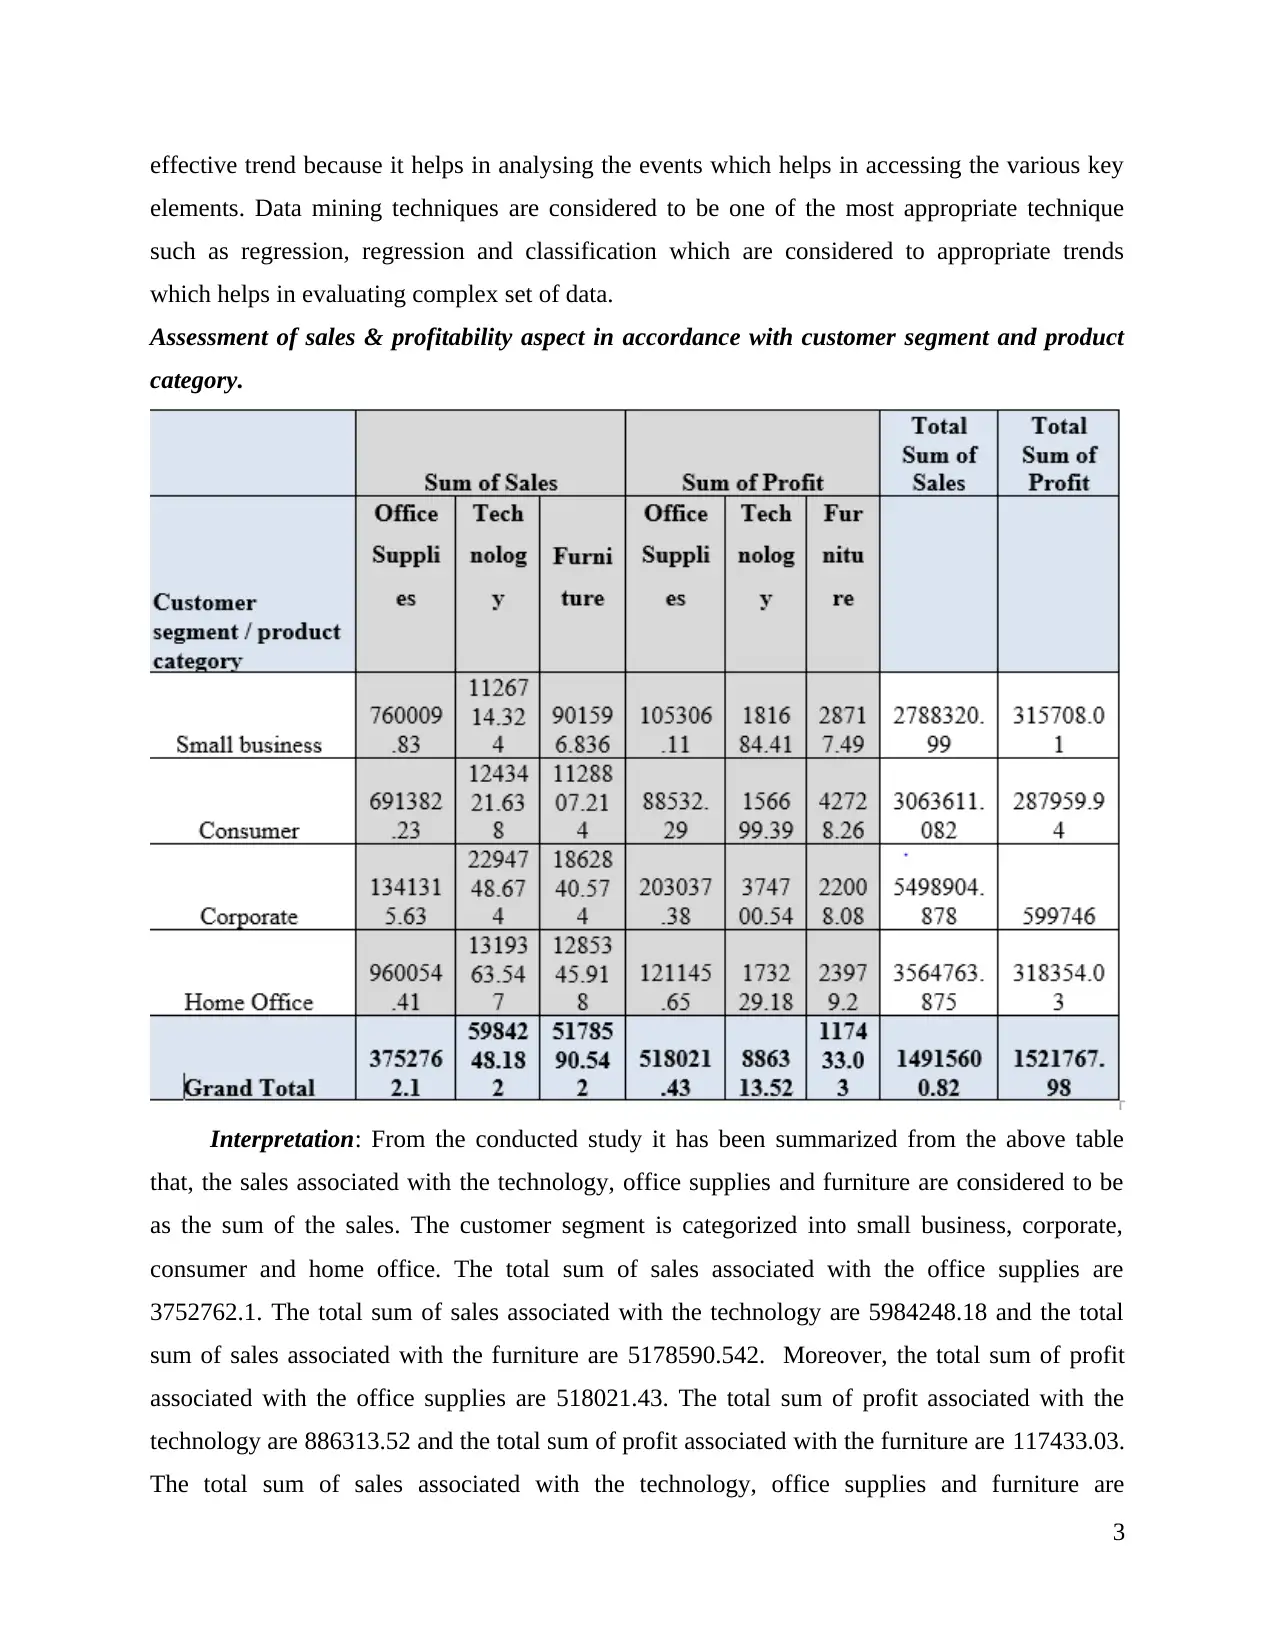
Assessment of sales & profitability aspect in accordance with customer segment and product
category.
Interpretation: From the conducted study it has been summarized from the above table
that, the sales associated with the technology, office supplies and furniture are considered to be
as the sum of the sales. The customer segment is categorized into small business, corporate,
consumer and home office. The total sum of sales associated with the office supplies are
3752762.1. The total sum of sales associated with the technology are 5984248.18 and the total
sum of sales associated with the furniture are 5178590.542. Moreover, the total sum of profit
associated with the office supplies are 518021.43. The total sum of profit associated with the
technology are 886313.52 and the total sum of profit associated with the furniture are 117433.03.
The total sum of sales associated with the technology, office supplies and furniture are
3
elements. Data mining techniques are considered to be one of the most appropriate technique
such as regression, regression and classification which are considered to appropriate trends
which helps in evaluating complex set of data.
Assessment of sales & profitability aspect in accordance with customer segment and product
category.
Interpretation: From the conducted study it has been summarized from the above table
that, the sales associated with the technology, office supplies and furniture are considered to be
as the sum of the sales. The customer segment is categorized into small business, corporate,
consumer and home office. The total sum of sales associated with the office supplies are
3752762.1. The total sum of sales associated with the technology are 5984248.18 and the total
sum of sales associated with the furniture are 5178590.542. Moreover, the total sum of profit
associated with the office supplies are 518021.43. The total sum of profit associated with the
technology are 886313.52 and the total sum of profit associated with the furniture are 117433.03.
The total sum of sales associated with the technology, office supplies and furniture are
3
14915600.82. The total sum of profit associated with the technology, office supplies and
furniture are 1521767.98. The sum of profit is higher which in turn demonstrates that the
company makes huge amount of profit from the sales of the technology, office supplies and
furniture. This eventually leads to high degree of profitability and sales for the company. This
leads to better business operations and productivity.
Evaluating the use of Excel for pre- processing the data and determining the data
In order to meet the present the data in better manner and recording and analyzing the
data to get better outcomes, Excel is used. Thus, it is that software application which assist the
user to understand all the numerical values and in the same, as per the current situation,
Superstore is also faces issue in decline its sales and profit over and years, so this software
application will assist to determine the answers.
Data Pre-process: It is the first step in which a user cleaning the data without leaving
any error. Thus, it helps to determine the values and with the help of shortcut, it will be easy for
the user to get accurate results and the key is Shift + F4. On the other side, it is also assist to
analyze the missing values by taking an average of the columns. For example, as stated in the
shipment mode, it is clearly analyze that in order to take sum, user put a formula i.e. SUM(all the
values are selected, which a user get an answers). On the other side, Pivot table is used in order
to examine the impact of profit and sales upon the superstores.
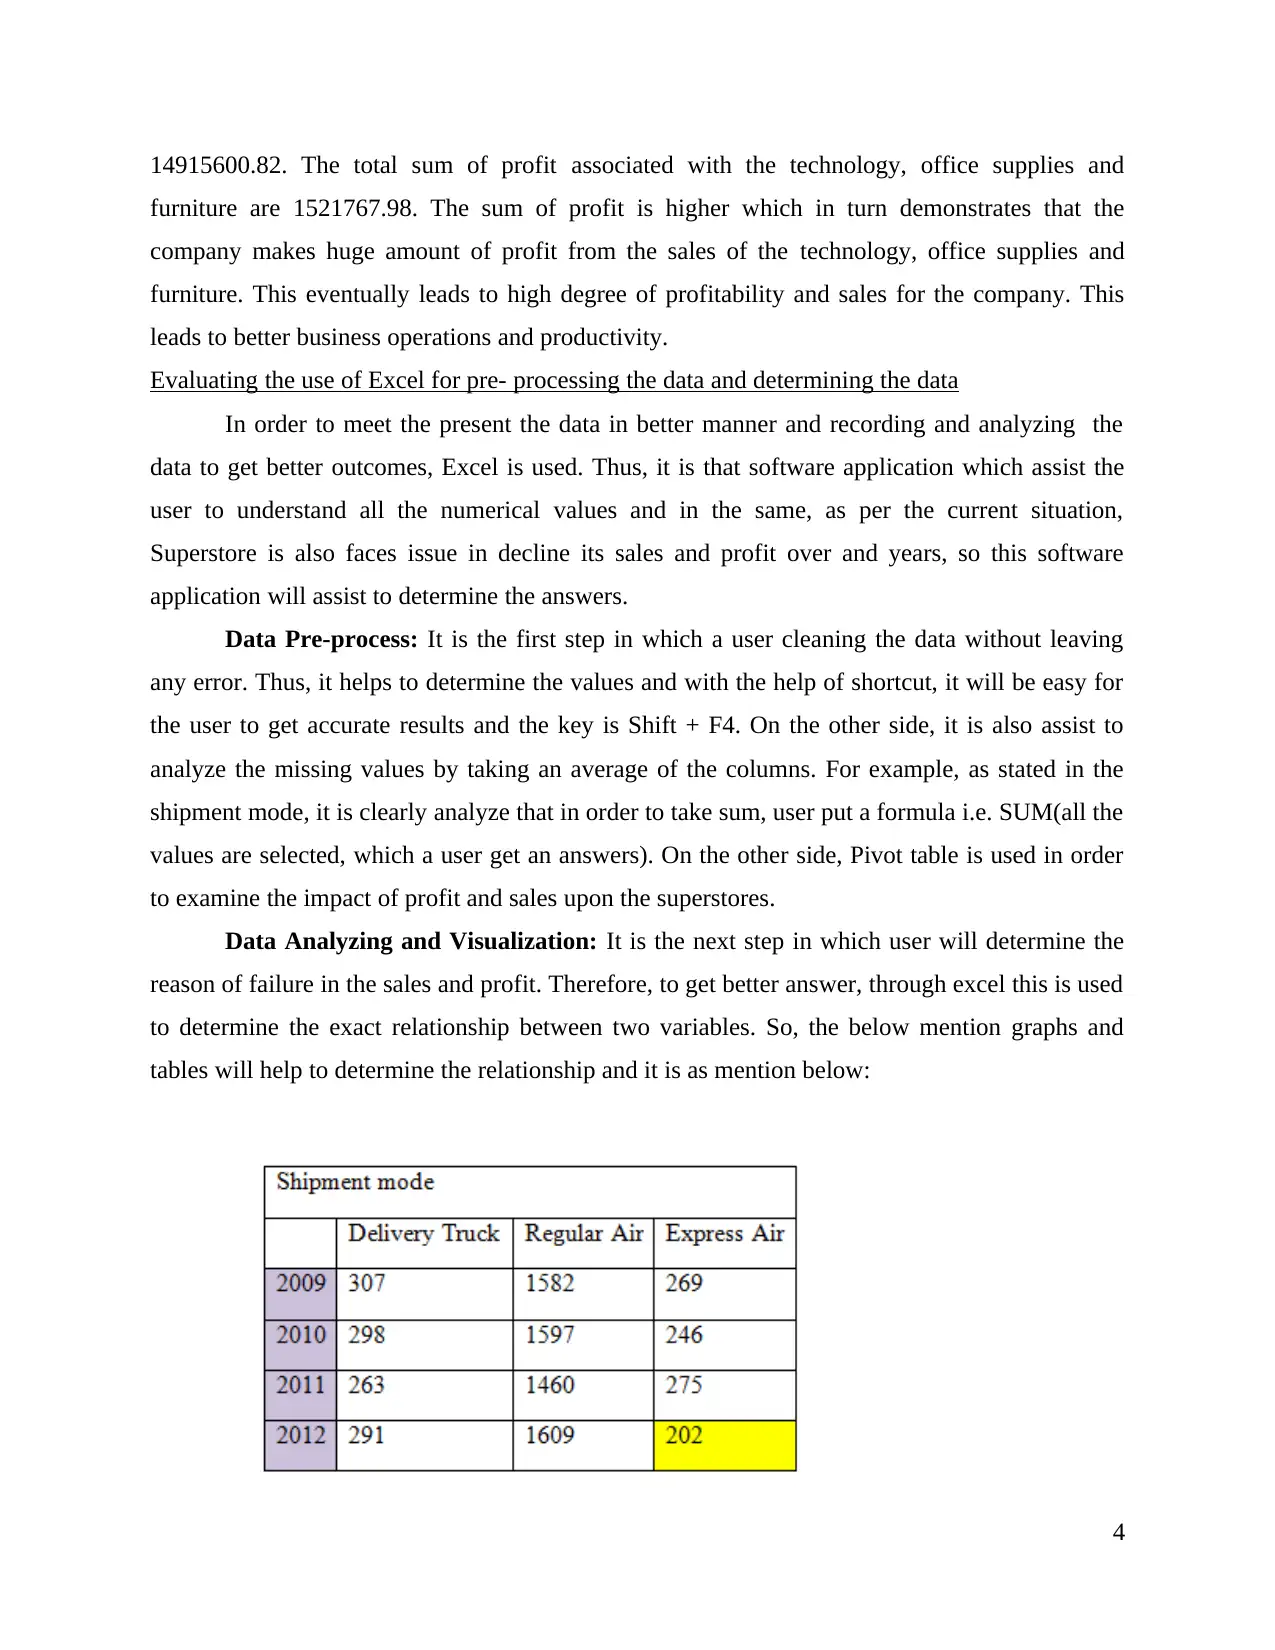
Data Analyzing and Visualization: It is the next step in which user will determine the
reason of failure in the sales and profit. Therefore, to get better answer, through excel this is used
to determine the exact relationship between two variables. So, the below mention graphs and
tables will help to determine the relationship and it is as mention below:
4
furniture are 1521767.98. The sum of profit is higher which in turn demonstrates that the
company makes huge amount of profit from the sales of the technology, office supplies and
furniture. This eventually leads to high degree of profitability and sales for the company. This
leads to better business operations and productivity.
Evaluating the use of Excel for pre- processing the data and determining the data
In order to meet the present the data in better manner and recording and analyzing the
data to get better outcomes, Excel is used. Thus, it is that software application which assist the
user to understand all the numerical values and in the same, as per the current situation,
Superstore is also faces issue in decline its sales and profit over and years, so this software
application will assist to determine the answers.
Data Pre-process: It is the first step in which a user cleaning the data without leaving
any error. Thus, it helps to determine the values and with the help of shortcut, it will be easy for
the user to get accurate results and the key is Shift + F4. On the other side, it is also assist to
analyze the missing values by taking an average of the columns. For example, as stated in the
shipment mode, it is clearly analyze that in order to take sum, user put a formula i.e. SUM(all the
values are selected, which a user get an answers). On the other side, Pivot table is used in order
to examine the impact of profit and sales upon the superstores.
Data Analyzing and Visualization: It is the next step in which user will determine the
reason of failure in the sales and profit. Therefore, to get better answer, through excel this is used
to determine the exact relationship between two variables. So, the below mention graphs and
tables will help to determine the relationship and it is as mention below:
4
⊘ This is a preview!⊘
Do you want full access?
Subscribe today to unlock all pages.
Trusted by 1+ million students worldwide
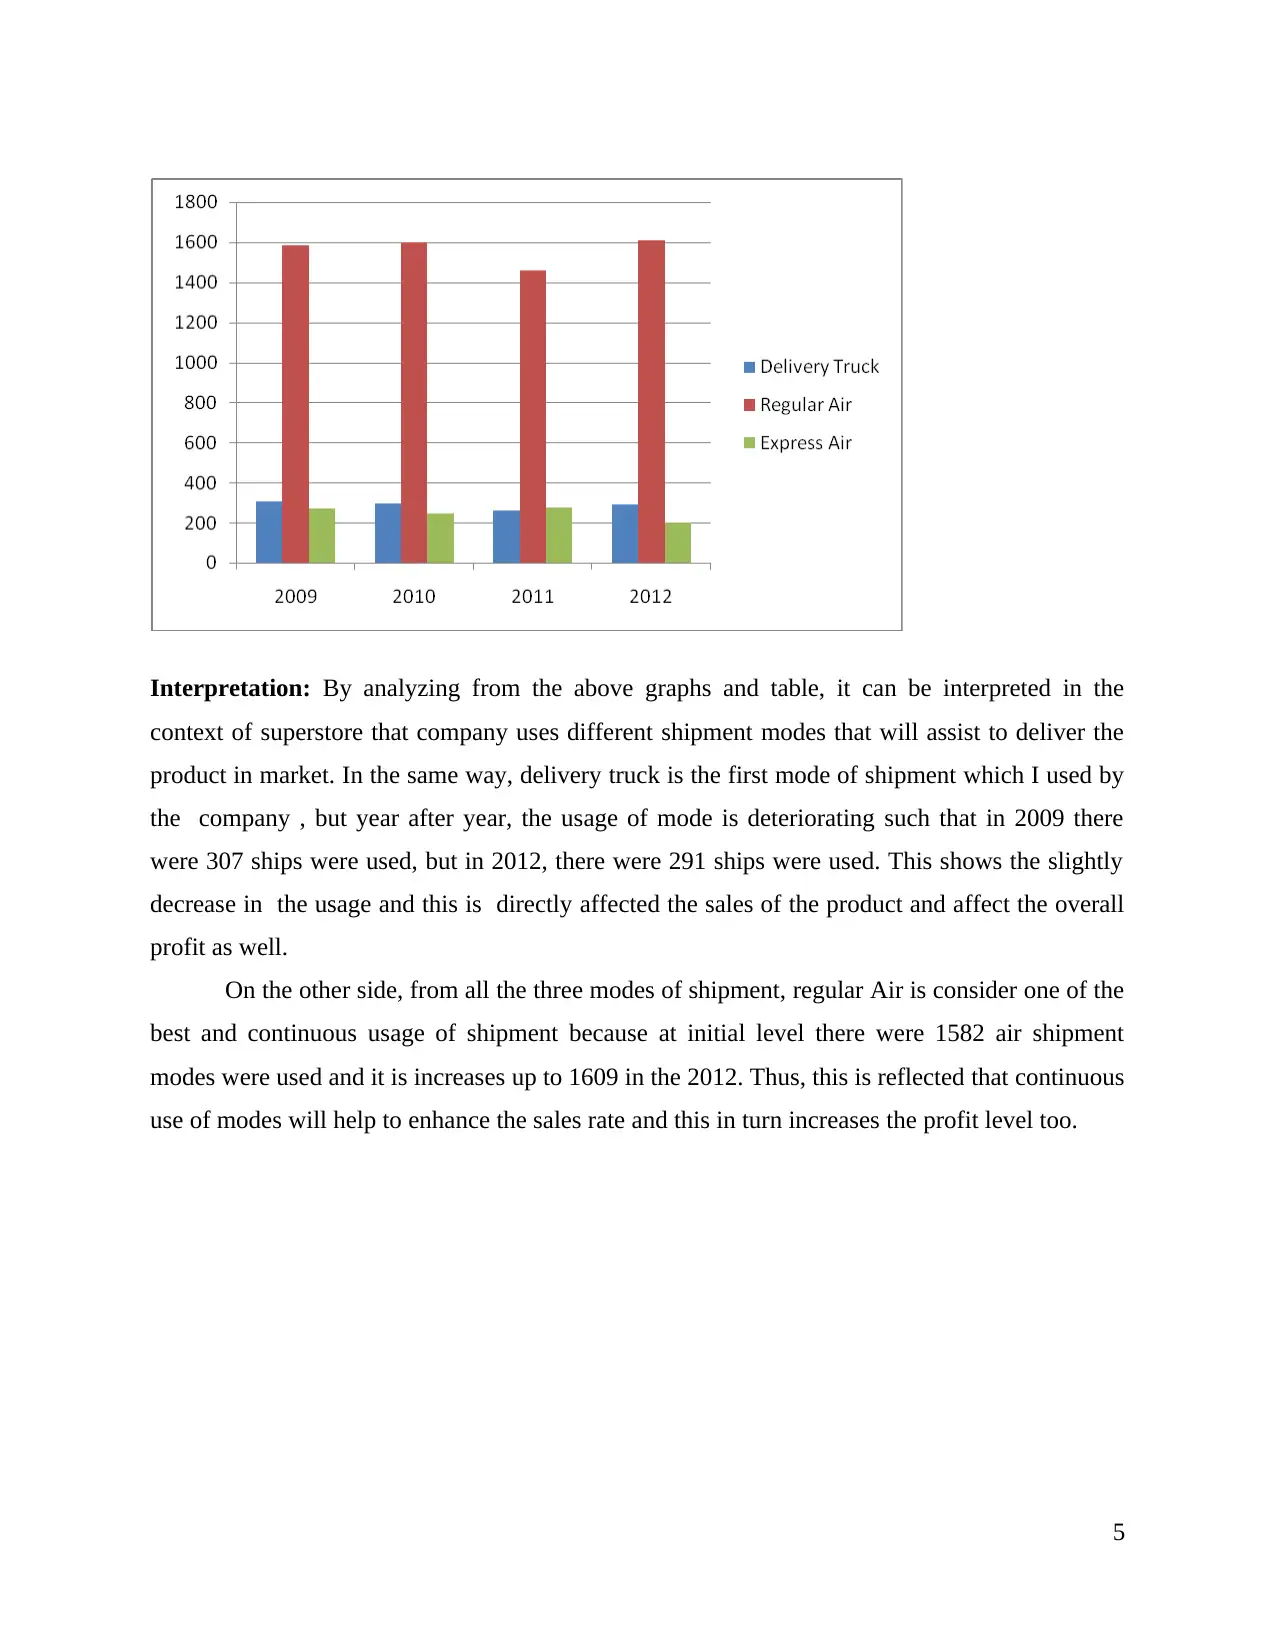
Interpretation: By analyzing from the above graphs and table, it can be interpreted in the
context of superstore that company uses different shipment modes that will assist to deliver the
product in market. In the same way, delivery truck is the first mode of shipment which I used by
the company , but year after year, the usage of mode is deteriorating such that in 2009 there
were 307 ships were used, but in 2012, there were 291 ships were used. This shows the slightly
decrease in the usage and this is directly affected the sales of the product and affect the overall
profit as well.
On the other side, from all the three modes of shipment, regular Air is consider one of the
best and continuous usage of shipment because at initial level there were 1582 air shipment
modes were used and it is increases up to 1609 in the 2012. Thus, this is reflected that continuous
use of modes will help to enhance the sales rate and this in turn increases the profit level too.
5
Paraphrase This Document
Need a fresh take? Get an instant paraphrase of this document with our AI Paraphraser
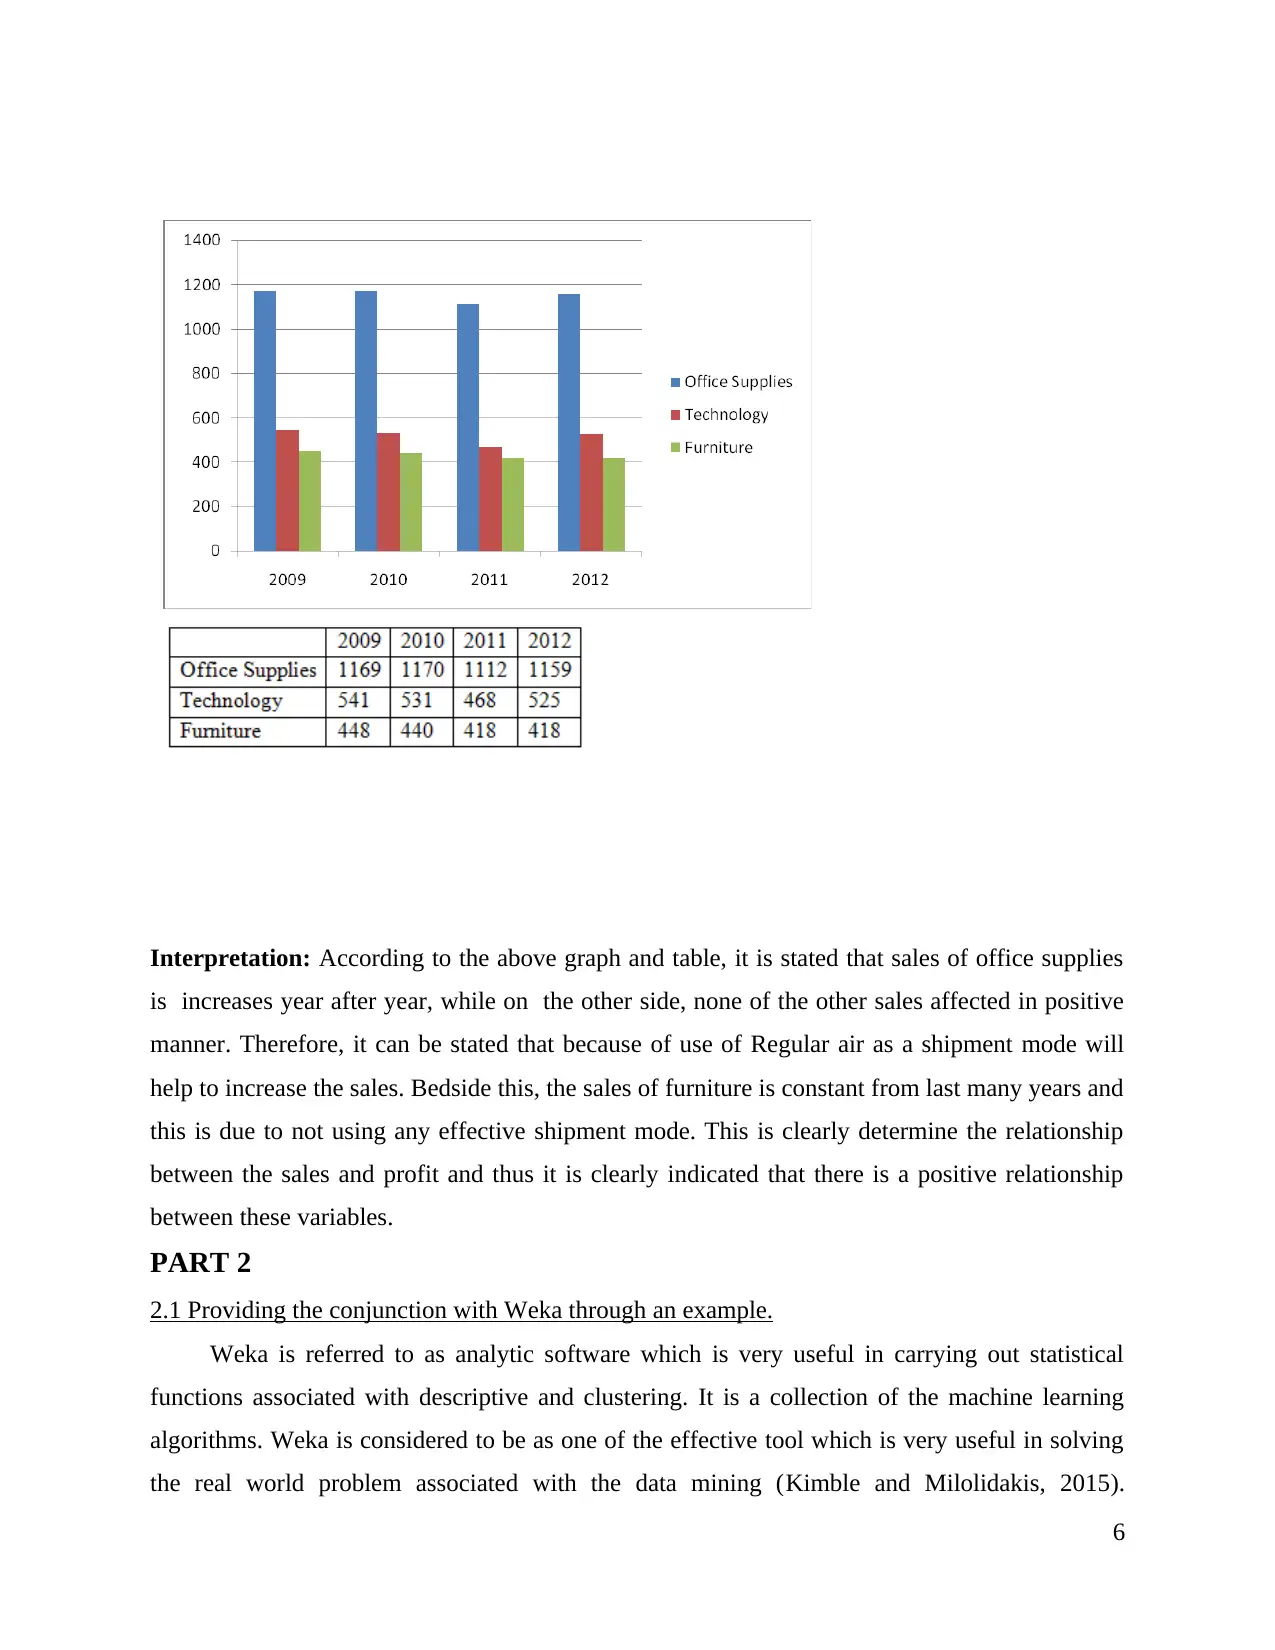
Interpretation: According to the above graph and table, it is stated that sales of office supplies
is increases year after year, while on the other side, none of the other sales affected in positive
manner. Therefore, it can be stated that because of use of Regular air as a shipment mode will
help to increase the sales. Bedside this, the sales of furniture is constant from last many years and
this is due to not using any effective shipment mode. This is clearly determine the relationship
between the sales and profit and thus it is clearly indicated that there is a positive relationship
between these variables.
PART 2
2.1 Providing the conjunction with Weka through an example.
Weka is referred to as analytic software which is very useful in carrying out statistical
functions associated with descriptive and clustering. It is a collection of the machine learning
algorithms. Weka is considered to be as one of the effective tool which is very useful in solving
the real world problem associated with the data mining (Kimble and Milolidakis, 2015).
6
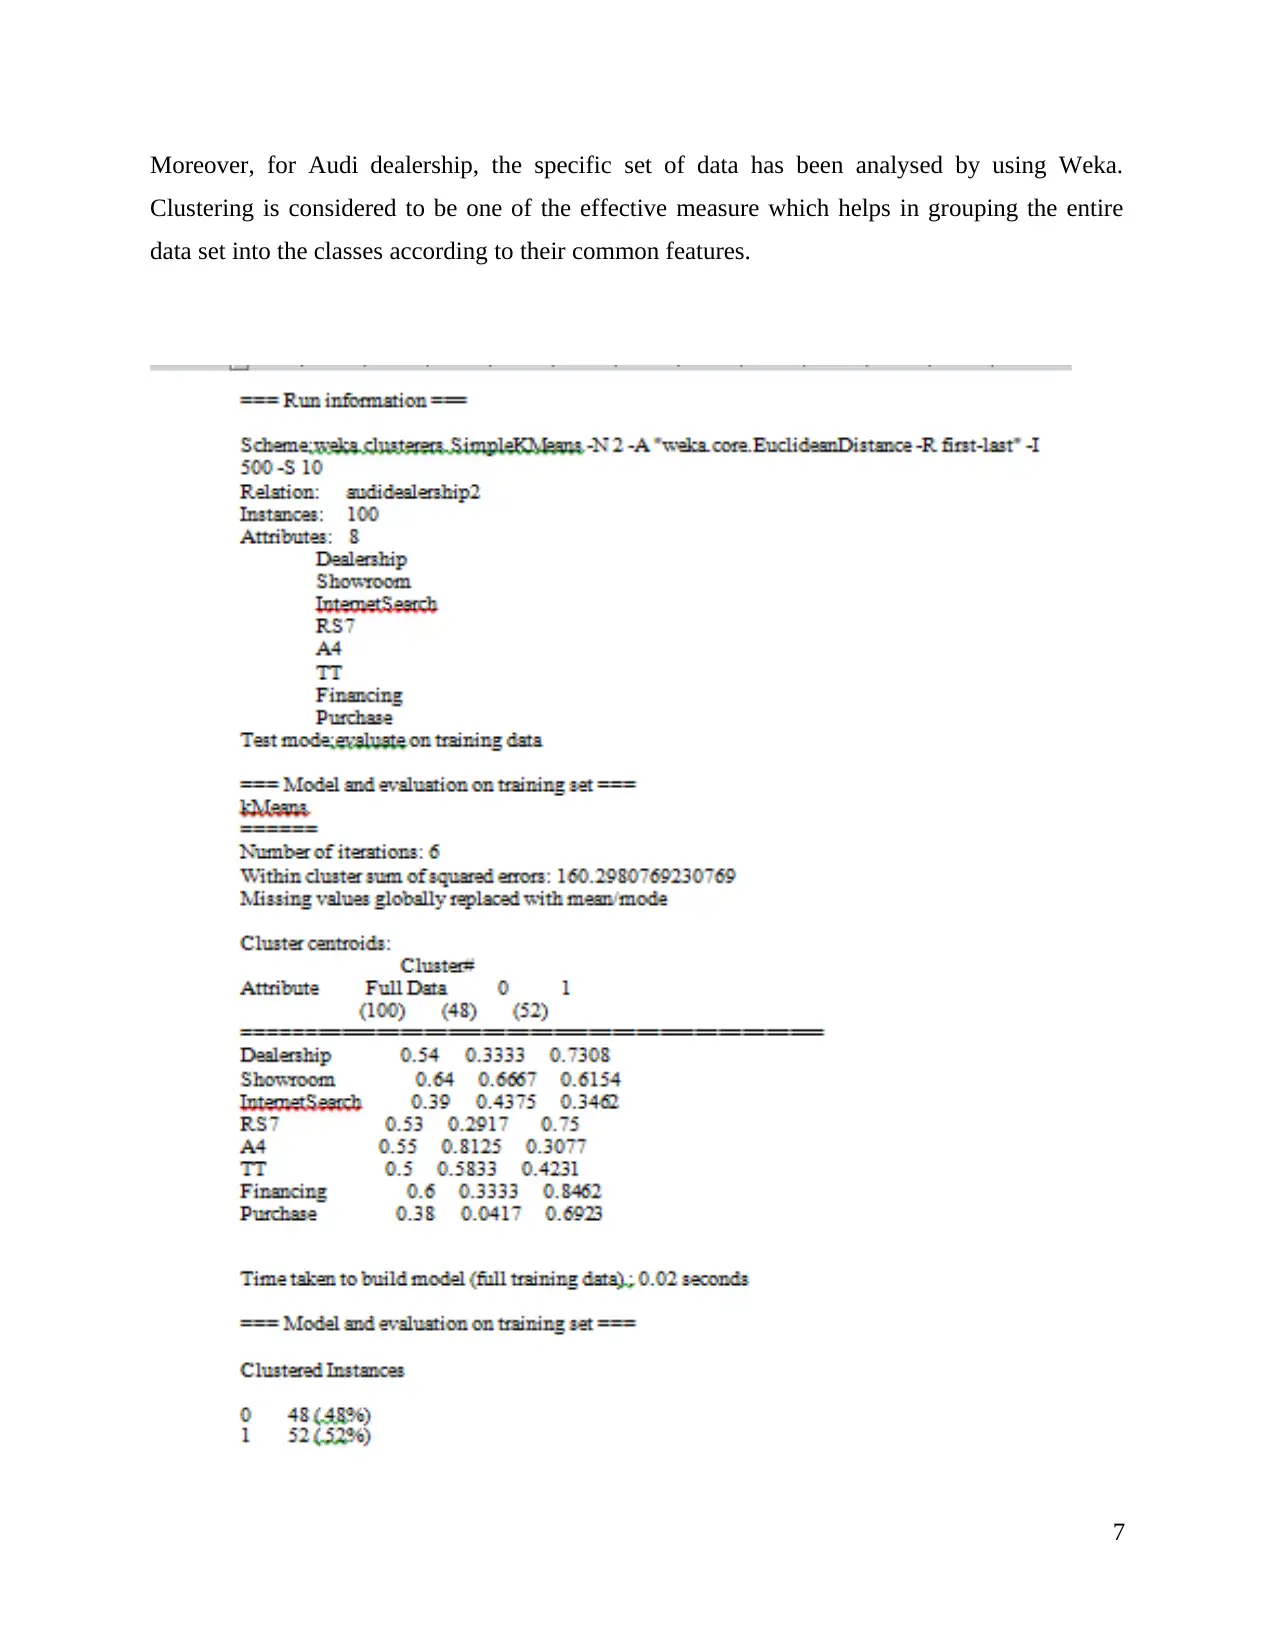
Moreover, for Audi dealership, the specific set of data has been analysed by using Weka.
Clustering is considered to be one of the effective measure which helps in grouping the entire
data set into the classes according to their common features.
7
Clustering is considered to be one of the effective measure which helps in grouping the entire
data set into the classes according to their common features.
7
⊘ This is a preview!⊘
Do you want full access?
Subscribe today to unlock all pages.
Trusted by 1+ million students worldwide
Interpretation: It is analyzed form the above coding that around 100 peoples were selected for
Audi dealership and two variables are used i.e. zero and one. So, zero is used for those person
who did not put further, while one represent sample are proceed further. But as per the coding
done by Weka it is observe that there are 48% of the sample who are under zero and 52% of
them are under 1. Thus, it can be stated that around 54 sample or respondents prefer for the
selected dealership while, 64 of them choose to go cars showroom and made a decision to
purchase from there only. After determining the views of all the sample, it is interpreted that
38% from 100% are actually prefer to buy a product from the Audi dealership. Hence, this Weka
tool is consider the best coding tool in order to determine the exact answer from the large volume
of information as it is also used in the current situation which helps to examine how much people
prefer to choose the Audi delarship.
2.2 Explain the most common methods associated with data mining which are used by the
organization.
Data mining is referred to as one of the most prominent procedure which uses the raw data in
order to attain useful set of information and take proper decision. Moreover, with the use of the
effective software it helps in looking upon the various set of patterns within the large set of
complex data. Data mining is very prominent in enhancing the current system and also reduces
and fault or error within the business process (Bahrami and Singhal, 2015). Data mining is
prominent in analysing the current trends of the business which are very useful in gaining wider
set of perspective by systematically arranging the complex data. It helps in analysing the patterns
and take proper decision on a timely manner. Data mining is very useful in the extraction of the
useful information which helps in generating appropriate information from large set of
information. There are certain common data mining techniques which are used by the
organization are as follow:
1. Tracking patterns: This is considered to be as one of the most prominent technique
associated with the data mining is to effectively recognize the various patterns within the
specific data sets (Alpar, and Schulz, 2016). It is considered to be as one of the most
fundamental technique which helps in monitoring and identifying the key trends within
the data in order. It is useful for the management to make strategic decision. It is very
8
Paraphrase This Document
Need a fresh take? Get an instant paraphrase of this document with our AI Paraphraser
useful for the organization to effectively evaluate and identify the trends associated with
the sales data. It is useful in making intelligent inferences associated with the outcomes
of the business.
2. Classification: Classification is also one of the most of Affective data mining technique
which helps in interpreting the various attributes and elements of the different datasets. It
is useful for the organisation which helps in appropriate decision-making. Classification
technique is considered to be one of the most complex data mining method which helps
in drawing various set of conclusion.
3. Regression: Regression is also one of the most affective data mining technique which is
primarily used for modelling and planning various sets of data. This type of technique is
mainly associated with identification of the nature of relationship associated with the
variables and datasets (Choi, Chan, and Yue, 2016). Set relationship between the
variables and the dataset can be causal. It is a straightforward technique which is very
prominent in clearly revealing the variables which are highly related to each other.
Regression technique is very useful for forecasting and modelling of the data.
4. Decision tree: Decision tree is also one of the most prominent method that is a specific
type of predictive model which helps organisation to mine data (Gallinucci, Golfarelli,
and Rizzi, 2015). Decision tree is considered to be part of the machine learning because it
is extremely straightforward in nature. A decision tree technique is very useful because it
helps the users to clearly iunderstand the various inputs of the data and how it actually
affects the output. When various decision tree model come together then they create
predictive analytics model which is also referred to as a random Forest. Such techniques
are very useful in understanding the outputs which are usually based on the inputs. This
model is useful in assembling model in an accurate manner.
2.3 Critically evaluating the advantages and disadvantages of Weka over Excel.
Waikato Environment for Knowledge Analysis (Weka) it is a collection of the machine
learning algorithms. Weka is also referred to as one of the effective tool which is very useful in
solving the real world problem associated with the data mining (Wang, 2015). Weka is very
prominent as it tends to offer an exploratory data analysis which helps in carrying specific
analysis on the related data sets.
Advantages of Weka
9
One of the key advantage which highly associated with the WEKA tool is that, it is very
useful in integrating the complete range of the data preparation, data mining algorithm and
feature selection (Park, El Sawy, and Fiss, 2017). This study is very useful because only one data
format is needed when compared with the several different approaches. WEKA tool comes with
GUI which helps in more easier and convenient access. One of the key advantage associated with
the Weka tool is related with the free availability under General Public License. It has high
degree of portability as it is fully implemented by the JAVA programming language. It is also
very useful in order to run on the modern computing platform. It is one of the most
comprehensive method to collect data with appropriate modelling technique.
Disadvantages of Weka
The major disadvantage which is highly associated with the WEKA tool is that, there is no
JAVA based data. There is no smooth functioning of this tool (Moro, Cortez and Rita, 2015).
Moreover there is not set of automated solution to the key factors associated with the machine
learning.
CONCLUSION
From the above study it has been summarized that, a data warehouse is very useful because
it helps in supporting management to take strategic decision which leads to the attainment of the
goals and objectives of the organization. Business intelligence is very useful for the business
managers, corporate workers and operational workers for more informed decision making. Data
mining is very useful in analysing and exploring the large block of the information. It has been
examined that, the sum of profit is higher which in turn demonstrates that the company makes
huge amount of profit from the sales of the technology, office supplies and furniture. There are
certain common data mining techniques such as tracking patterns, classification, regression and
decision tree. Weka is very prominent as it tends to offer an exploratory data analysis. The key
advantage which highly associated with the WEKA tool is that, it helps in integrating the
complete range of the data preparation, data mining algorithm and feature selection.
10
⊘ This is a preview!⊘
Do you want full access?
Subscribe today to unlock all pages.
Trusted by 1+ million students worldwide
1 out of 14
Related Documents


Your All-in-One AI-Powered Toolkit for Academic Success.
+13062052269
info@desklib.com
Available 24*7 on WhatsApp / Email
![[object Object]](/_next/static/media/star-bottom.7253800d.svg)
Unlock your academic potential
Copyright © 2020–2026 A2Z Services. All Rights Reserved. Developed and managed by ZUCOL.