A Comprehensive Report on Data Handling and Business Intelligence
VerifiedAdded on 2023/06/11
|17
|3100
|323
Report
AI Summary
This report provides a detailed analysis of data handling and business intelligence techniques, utilizing both Microsoft Excel and SPSS. Part 1 focuses on Excel, demonstrating its capabilities in handling large datasets, performing statistical analyses such as calculating mean, median, and mode, and creating data visualizations through charts and pivot tables to analyze crime data over a 10-year period. The report highlights the use of functions like VLOOKUP and COUNTIF for efficient data management. Part 2 shifts to an analysis using SPSS, examining data related to student preferences, including ice cream flavors, puzzle game scores, and video game scores. It presents statistical outputs, including frequency distributions and mean calculations, to draw conclusions about student choices and demographic distributions. The report also includes a comparison of the merits and demerits of using both Excel and SPSS for data analysis, providing insights for business decision-making. This document is available on Desklib, a platform offering a wide range of study resources for students.
Data handling and
Business intelligence
Business intelligence
Paraphrase This Document
Need a fresh take? Get an instant paraphrase of this document with our AI Paraphraser
Table of Contents
PART 1............................................................................................................................................3
INTRODUCTION...........................................................................................................................3
Main Body.......................................................................................................................................3
Valuation of use of excel for advance-handling of the data...................................................3
Evaluating of the Data fixed:..................................................................................................3
Indication of the data with the assist of excel purpose:..........................................................4
Graphical Exhibition of the data consuming suitable charts:.................................................4
CONCLUSION................................................................................................................................6
REFERENCES................................................................................................................................7
PART 2............................................................................................................................................8
INTRODUCTION...........................................................................................................................8
Main Body.......................................................................................................................................8
Data enquiry...........................................................................................................................8
Outcomes and consequences................................................................................................11
Argument..............................................................................................................................11
Merits and Demerits of using SPSS.....................................................................................12
Merits and Demerits of Excel...............................................................................................12
Conclusion.....................................................................................................................................12
References......................................................................................................................................13
Appendix........................................................................................................................................14
PART 1
INTRODUCTION
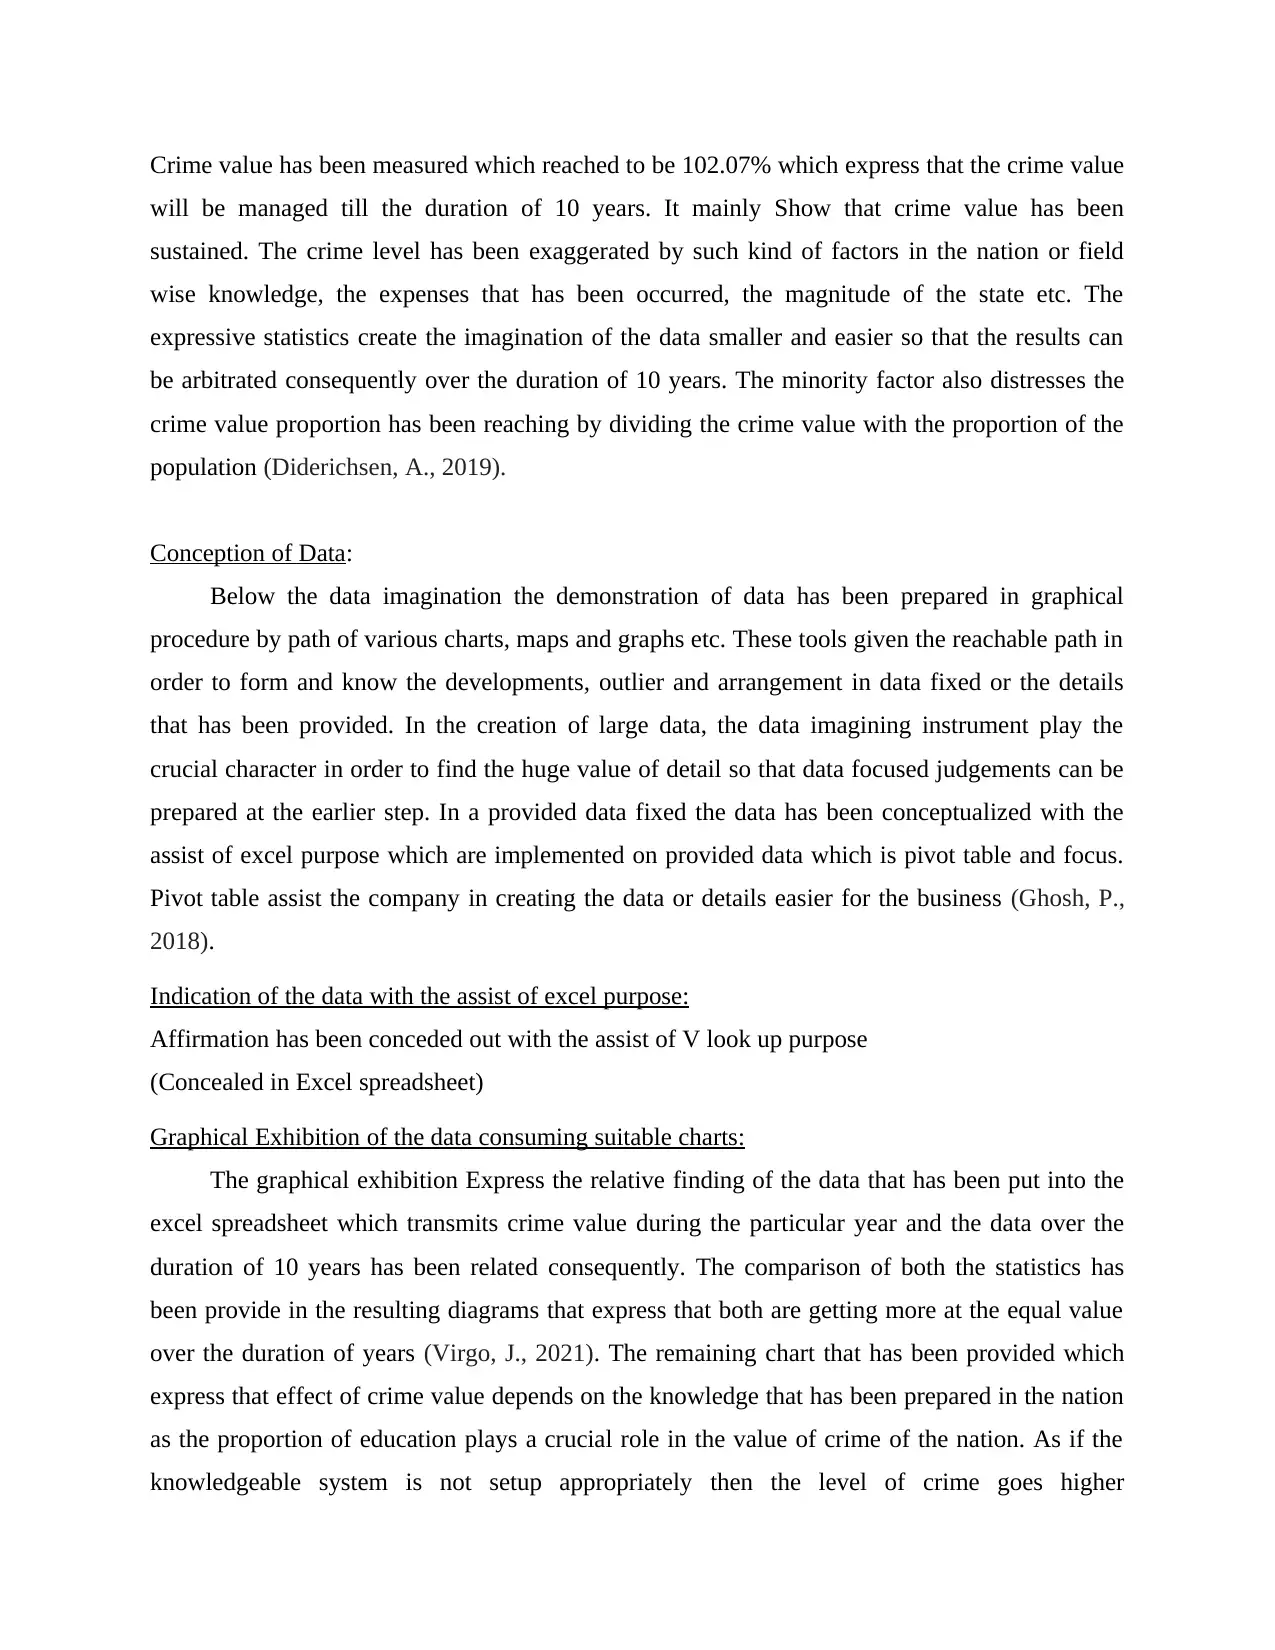
The case study describes about the data management which includes the series for gathering
the data, it also confirms precision of the details, it Assimilate concurrent function collected, and
assist in protecting the complete data administration plan in stripe with the aims and goals of the
company (Alhamadi, M.S., 2020). The efficiency of data administration plays a very important
objective in the achievement of the organization. This case comprises for the misconduct data
establish for the 10 years and utilizing such data set expertise on the excel has been estimated
and after such estimation V look up, count if etc. purpose has been accomplished on that kind of
data establish so that crime level can also be measured in percentage position also for the
company. With the assist of Microsoft excel the big handling of data has been carried out by the
firm very definitely and this will secure the time duration of the enterprise on a big scale.
Main Body
Valuation of use of excel for advance-handling of the data
The Microsoft excel spreadsheet assists the company in measuring the broad formulation
in minutes as it is the better instrument in finding the results of the organization. How it is not
appropriate for all type of assessment but still the consistent instrument for data analytics. The
advance handling of the data will develop easier with the assist of excel and in the provided data
set (Dar, P., 2021). The data establish which is provided in the question concerning to the crime
level for the present year and the crime stage during 10 years and kinds of remaining
circumstance has been provide on the basis of which the crime level has been exaggerated.
Various factors can be the education stage, the expenses, the southern area etc. on the basis of
which the stage diverges:
Evaluating of the Data fixed:
In the provided data it fixed the expressive statistics has been executed which comprises of
mean, median and mode etc. which are implemented on the data so given in the excel
spreadsheet. The mean of the misconduct rate has been reached to 102.80% which normally
show that the crime is more during the present annual year and same mean for the 10 years.
INTRODUCTION
The case study describes about the data management which includes the series for gathering
the data, it also confirms precision of the details, it Assimilate concurrent function collected, and
assist in protecting the complete data administration plan in stripe with the aims and goals of the
company (Alhamadi, M.S., 2020). The efficiency of data administration plays a very important
objective in the achievement of the organization. This case comprises for the misconduct data
establish for the 10 years and utilizing such data set expertise on the excel has been estimated
and after such estimation V look up, count if etc. purpose has been accomplished on that kind of
data establish so that crime level can also be measured in percentage position also for the
company. With the assist of Microsoft excel the big handling of data has been carried out by the
firm very definitely and this will secure the time duration of the enterprise on a big scale.
Main Body
Valuation of use of excel for advance-handling of the data
The Microsoft excel spreadsheet assists the company in measuring the broad formulation
in minutes as it is the better instrument in finding the results of the organization. How it is not
appropriate for all type of assessment but still the consistent instrument for data analytics. The
advance handling of the data will develop easier with the assist of excel and in the provided data
set (Dar, P., 2021). The data establish which is provided in the question concerning to the crime
level for the present year and the crime stage during 10 years and kinds of remaining
circumstance has been provide on the basis of which the crime level has been exaggerated.
Various factors can be the education stage, the expenses, the southern area etc. on the basis of
which the stage diverges:
Evaluating of the Data fixed:
In the provided data it fixed the expressive statistics has been executed which comprises of
mean, median and mode etc. which are implemented on the data so given in the excel
spreadsheet. The mean of the misconduct rate has been reached to 102.80% which normally
show that the crime is more during the present annual year and same mean for the 10 years.
⊘ This is a preview!⊘
Do you want full access?
Subscribe today to unlock all pages.
Trusted by 1+ million students worldwide
Crime value has been measured which reached to be 102.07% which express that the crime value
will be managed till the duration of 10 years. It mainly Show that crime value has been
sustained. The crime level has been exaggerated by such kind of factors in the nation or field
wise knowledge, the expenses that has been occurred, the magnitude of the state etc. The
expressive statistics create the imagination of the data smaller and easier so that the results can
be arbitrated consequently over the duration of 10 years. The minority factor also distresses the
crime value proportion has been reaching by dividing the crime value with the proportion of the
population (Diderichsen, A., 2019).
Conception of Data:
Below the data imagination the demonstration of data has been prepared in graphical
procedure by path of various charts, maps and graphs etc. These tools given the reachable path in
order to form and know the developments, outlier and arrangement in data fixed or the details
that has been provided. In the creation of large data, the data imagining instrument play the
crucial character in order to find the huge value of detail so that data focused judgements can be
prepared at the earlier step. In a provided data fixed the data has been conceptualized with the
assist of excel purpose which are implemented on provided data which is pivot table and focus.
Pivot table assist the company in creating the data or details easier for the business (Ghosh, P.,
2018).
Indication of the data with the assist of excel purpose:
Affirmation has been conceded out with the assist of V look up purpose
(Concealed in Excel spreadsheet)
Graphical Exhibition of the data consuming suitable charts:
The graphical exhibition Express the relative finding of the data that has been put into the
excel spreadsheet which transmits crime value during the particular year and the data over the
duration of 10 years has been related consequently. The comparison of both the statistics has
been provide in the resulting diagrams that express that both are getting more at the equal value
over the duration of years (Virgo, J., 2021). The remaining chart that has been provided which
express that effect of crime value depends on the knowledge that has been prepared in the nation
as the proportion of education plays a crucial role in the value of crime of the nation. As if the
knowledgeable system is not setup appropriately then the level of crime goes higher
Paraphrase This Document
Need a fresh take? Get an instant paraphrase of this document with our AI Paraphraser
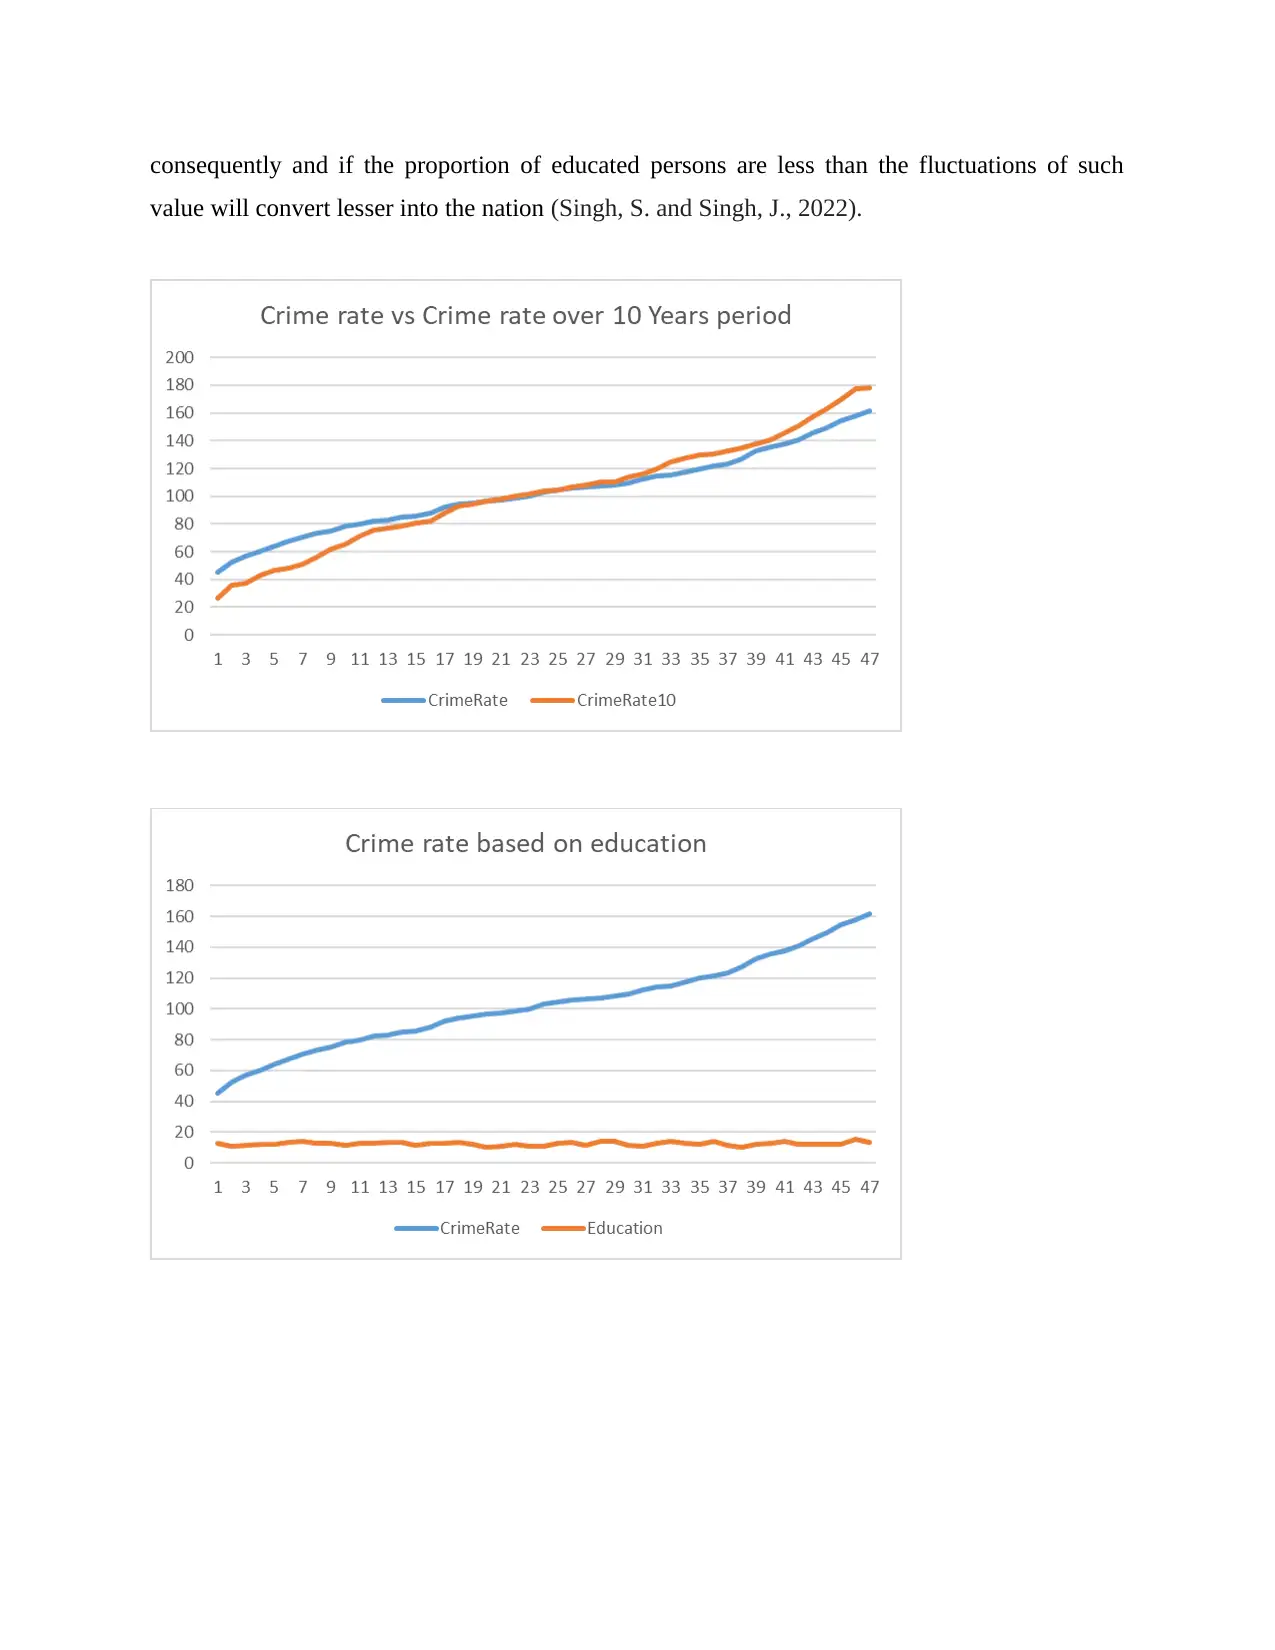
consequently and if the proportion of educated persons are less than the fluctuations of such
value will convert lesser into the nation (Singh, S. and Singh, J., 2022).
value will convert lesser into the nation (Singh, S. and Singh, J., 2022).
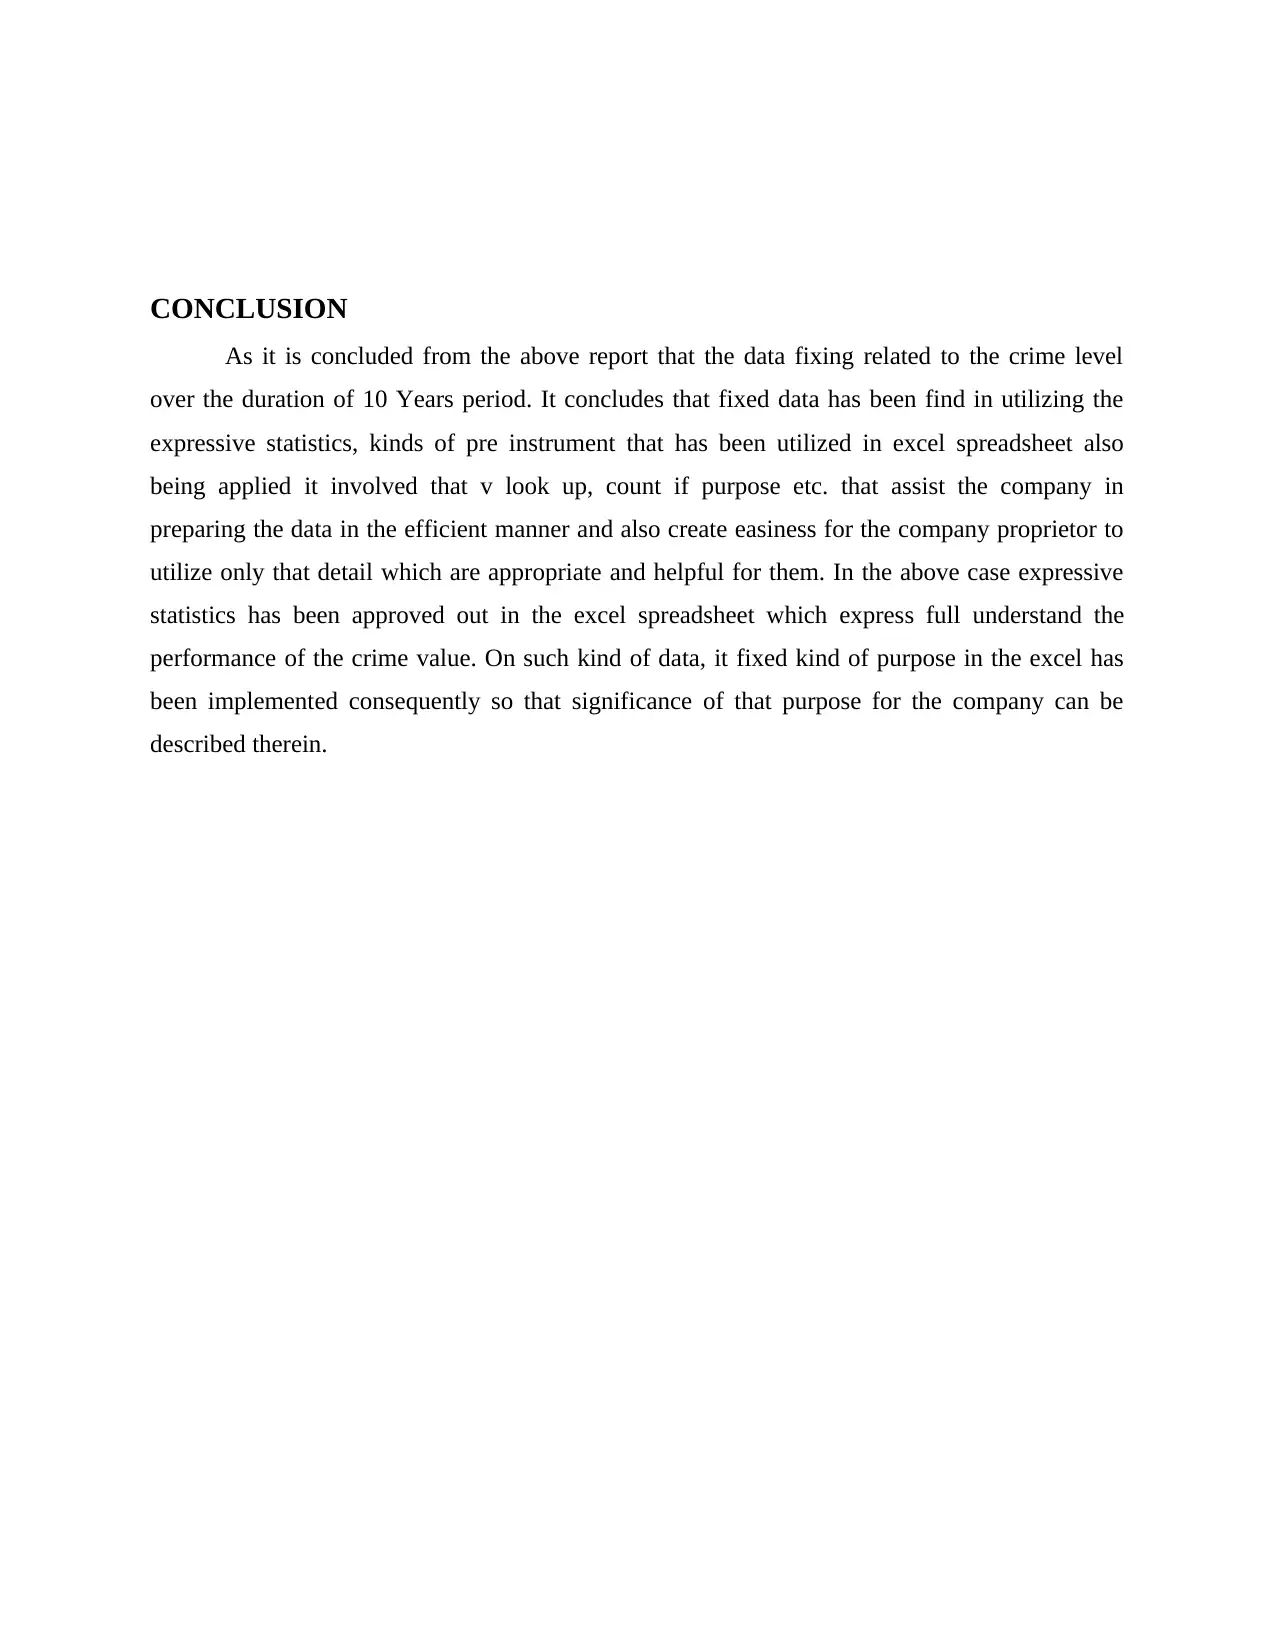
CONCLUSION
As it is concluded from the above report that the data fixing related to the crime level
over the duration of 10 Years period. It concludes that fixed data has been find in utilizing the
expressive statistics, kinds of pre instrument that has been utilized in excel spreadsheet also
being applied it involved that v look up, count if purpose etc. that assist the company in
preparing the data in the efficient manner and also create easiness for the company proprietor to
utilize only that detail which are appropriate and helpful for them. In the above case expressive
statistics has been approved out in the excel spreadsheet which express full understand the
performance of the crime value. On such kind of data, it fixed kind of purpose in the excel has
been implemented consequently so that significance of that purpose for the company can be
described therein.
⊘ This is a preview!⊘
Do you want full access?
Subscribe today to unlock all pages.
Trusted by 1+ million students worldwide
REFERENCES
Books and Journals
Alhamadi, M.S., 2020. Impact of Strategic Intelligence on the sustainable competitive advantage
of Industries Qatar. Global Journal of Management and Business Research.
Dar, P., 2021. What’s the best Business Intelligence and Analytics tool in the market.
Diderichsen, A., 2019. Spreading intelligence. Intelligence and National Security. 34(3). pp.409-
420.
Ghosh, P., 2018. Business Intelligence and Analytics Trends in 2018. Retrieved February. 21.
p.2018.
Singh, S. and Singh, J., 2022. A Survey on Master Data Management Techniques for Business
Perspective. In Cyber Intelligence and Information Retrieval (pp. 609-617). Springer,
Singapore.
Virgo, J., 2021. Power BI vs QlikView–Business Intelligence Tool Comparison.
Paraphrase This Document
Need a fresh take? Get an instant paraphrase of this document with our AI Paraphraser
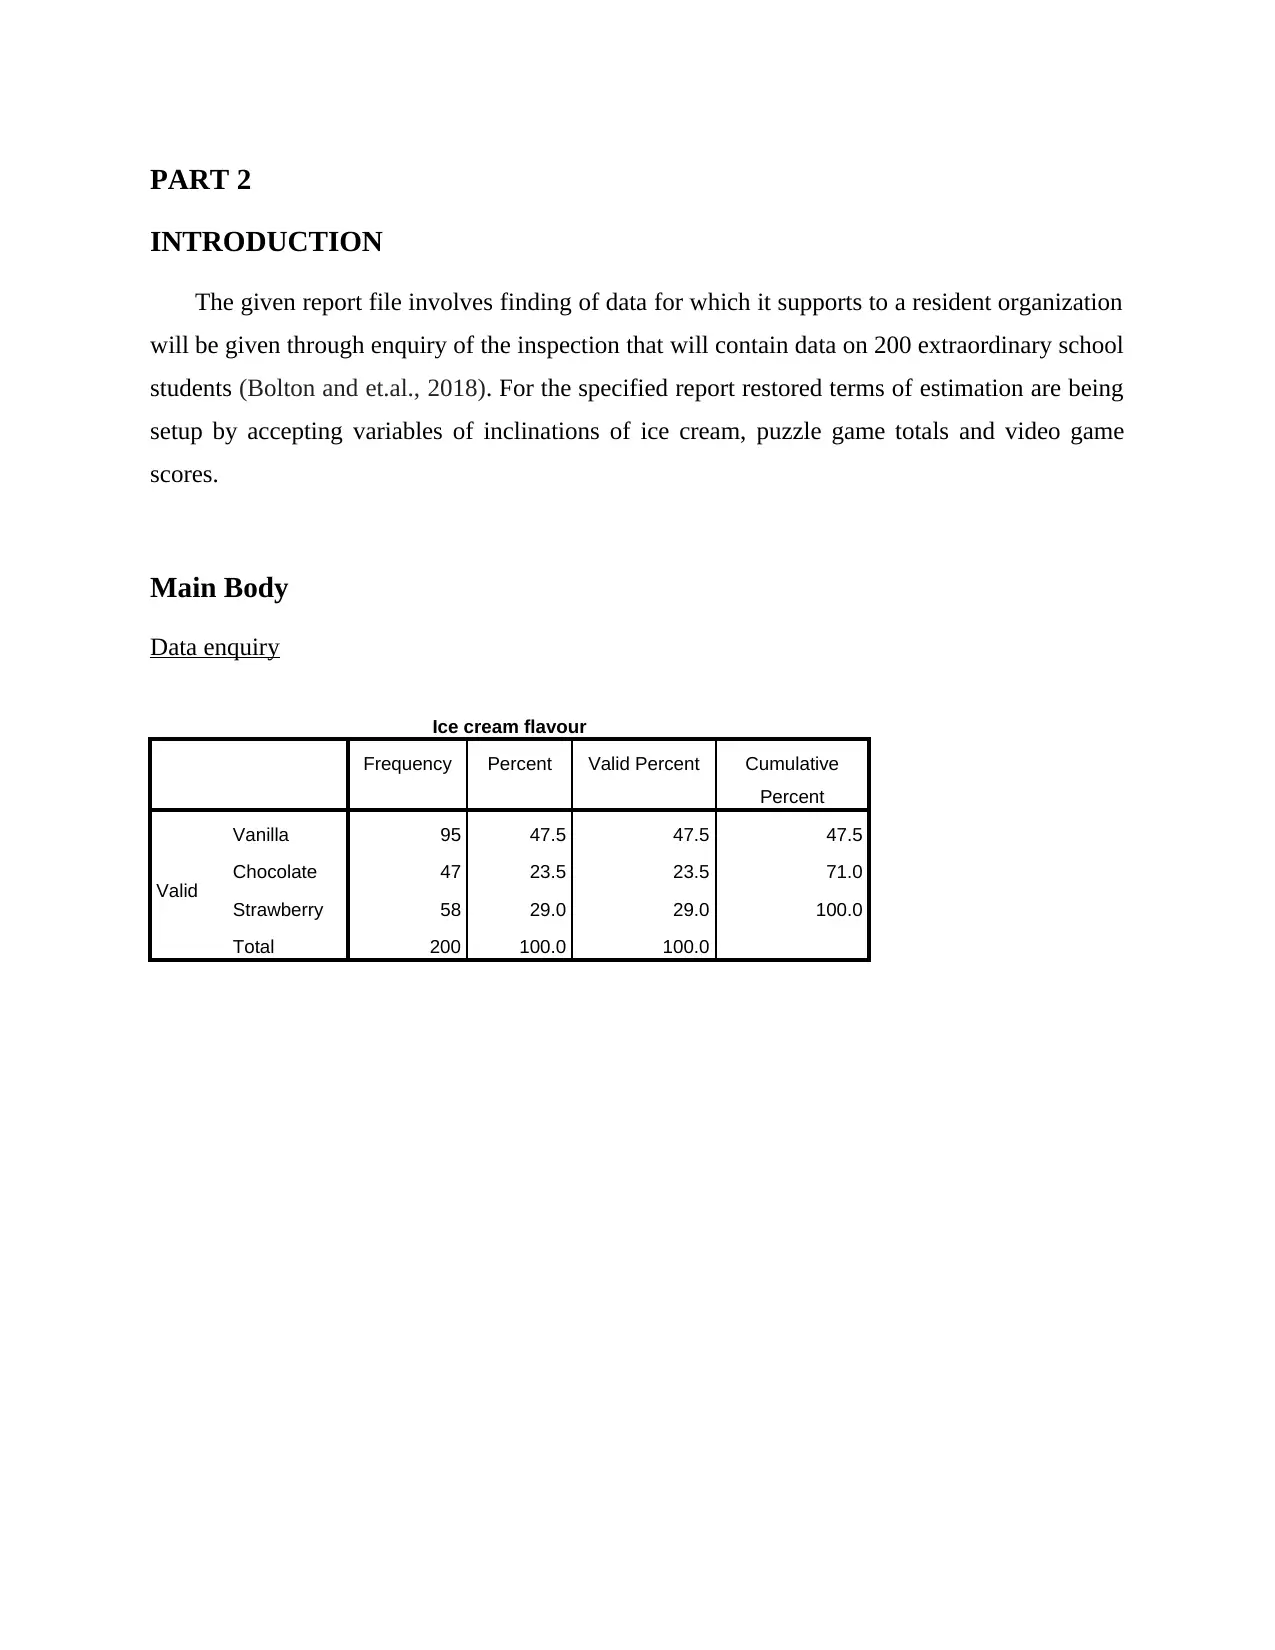
PART 2
INTRODUCTION
The given report file involves finding of data for which it supports to a resident organization
will be given through enquiry of the inspection that will contain data on 200 extraordinary school
students (Bolton and et.al., 2018). For the specified report restored terms of estimation are being
setup by accepting variables of inclinations of ice cream, puzzle game totals and video game
scores.
Main Body
Data enquiry
Ice cream flavour
Frequency Percent Valid Percent Cumulative
Percent
Valid
Vanilla 95 47.5 47.5 47.5
Chocolate 47 23.5 23.5 71.0
Strawberry 58 29.0 29.0 100.0
Total 200 100.0 100.0
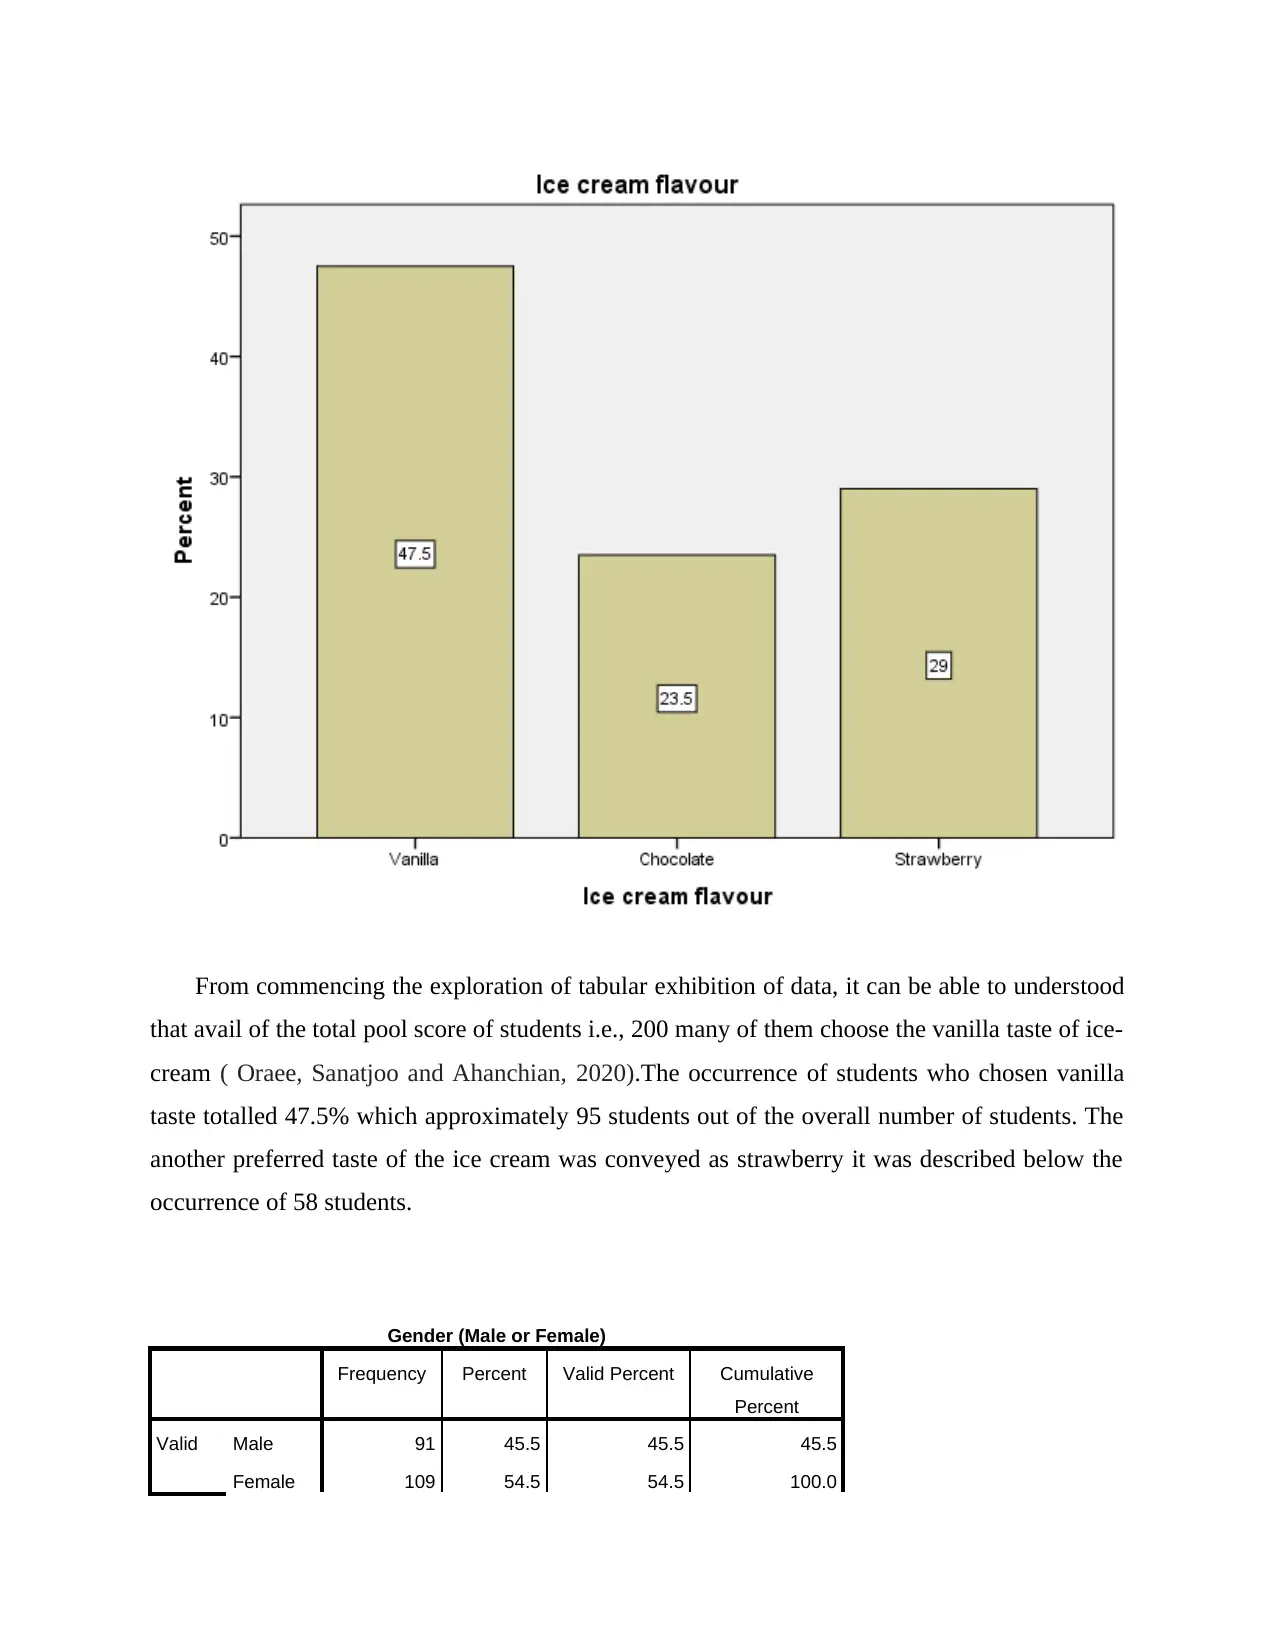
From commencing the exploration of tabular exhibition of data, it can be able to understood
that avail of the total pool score of students i.e., 200 many of them choose the vanilla taste of ice-
cream ( Oraee, Sanatjoo and Ahanchian, 2020).The occurrence of students who chosen vanilla
taste totalled 47.5% which approximately 95 students out of the overall number of students. The
another preferred taste of the ice cream was conveyed as strawberry it was described below the
occurrence of 58 students.
Gender (Male or Female)
Frequency Percent Valid Percent Cumulative
Percent
Valid Male 91 45.5 45.5 45.5
Female 109 54.5 54.5 100.0
⊘ This is a preview!⊘
Do you want full access?
Subscribe today to unlock all pages.
Trusted by 1+ million students worldwide
Total 200 100.0 100.0
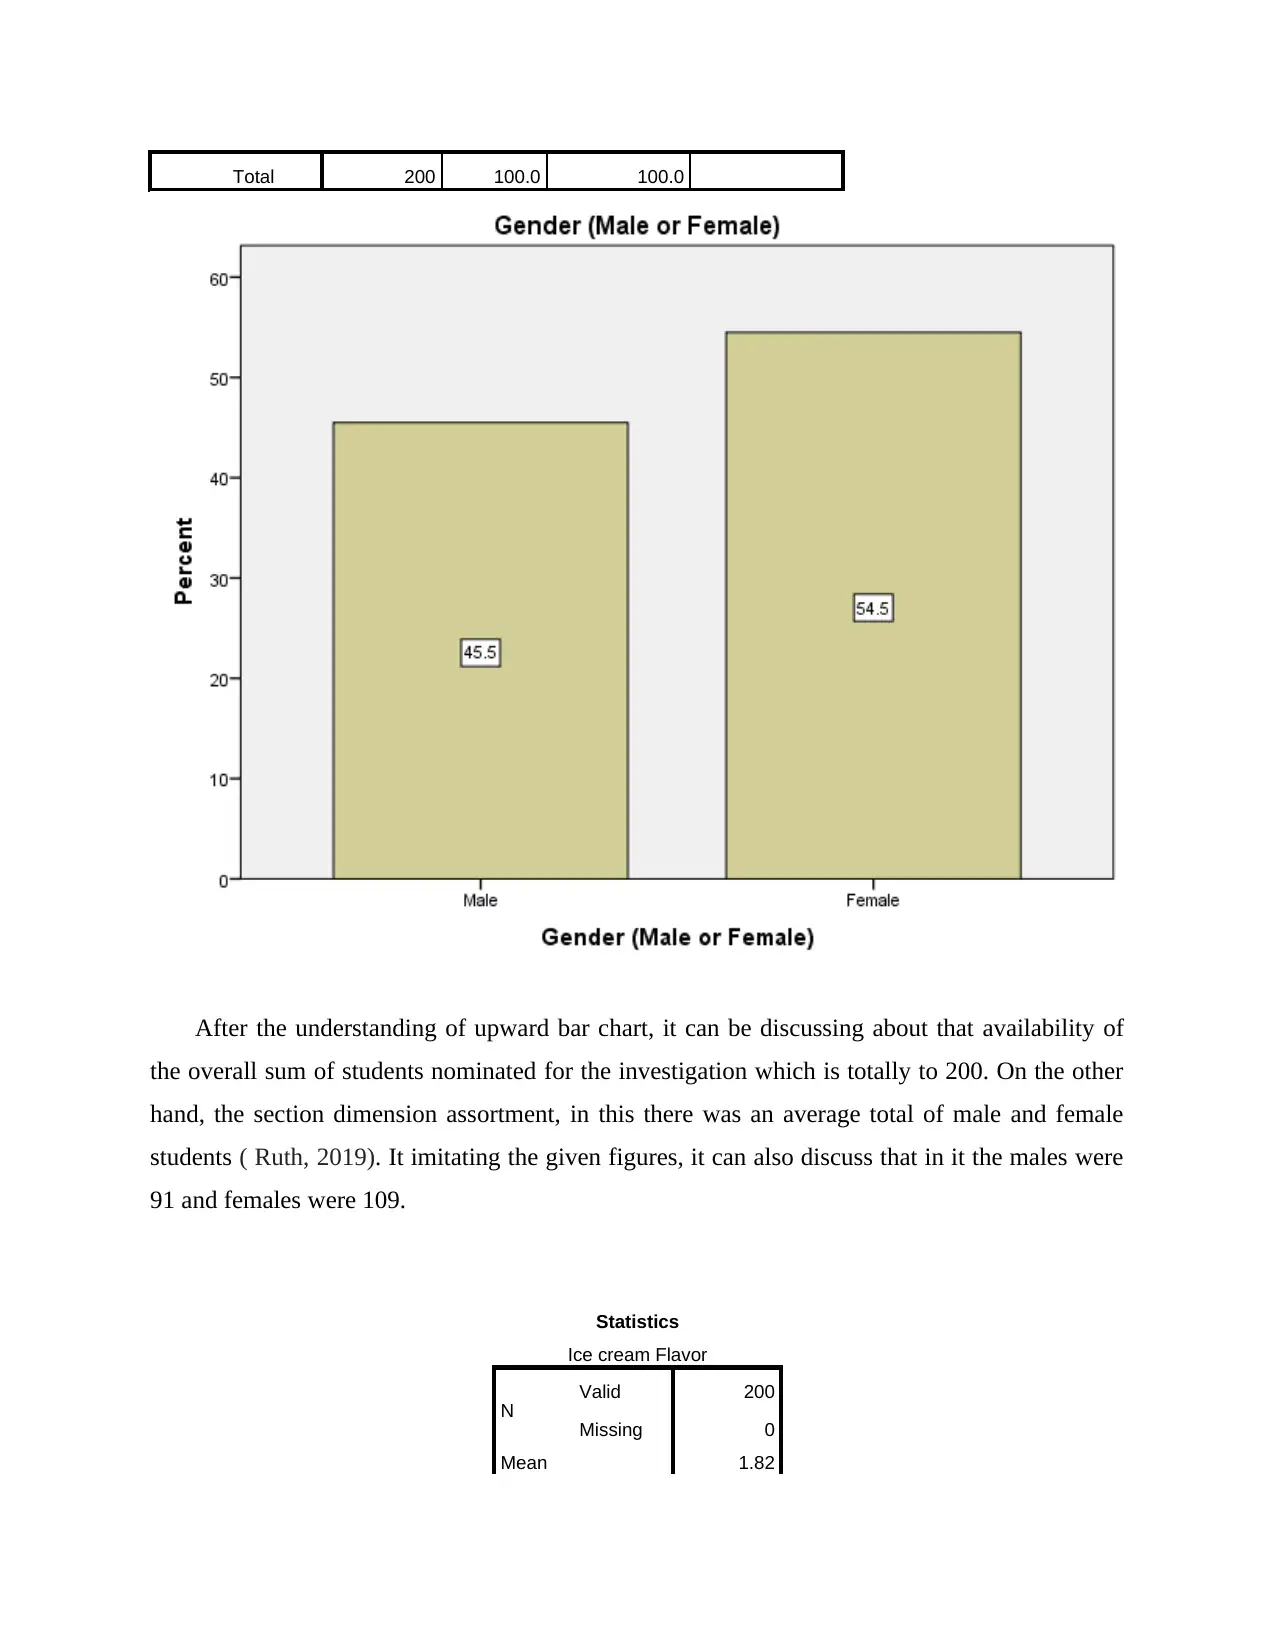
After the understanding of upward bar chart, it can be discussing about that availability of
the overall sum of students nominated for the investigation which is totally to 200. On the other
hand, the section dimension assortment, in this there was an average total of male and female
students ( Ruth, 2019). It imitating the given figures, it can also discuss that in it the males were
91 and females were 109.
Statistics
Ice cream Flavor
N Valid 200
Missing 0
Mean 1.82
Paraphrase This Document
Need a fresh take? Get an instant paraphrase of this document with our AI Paraphraser
Median 2.00
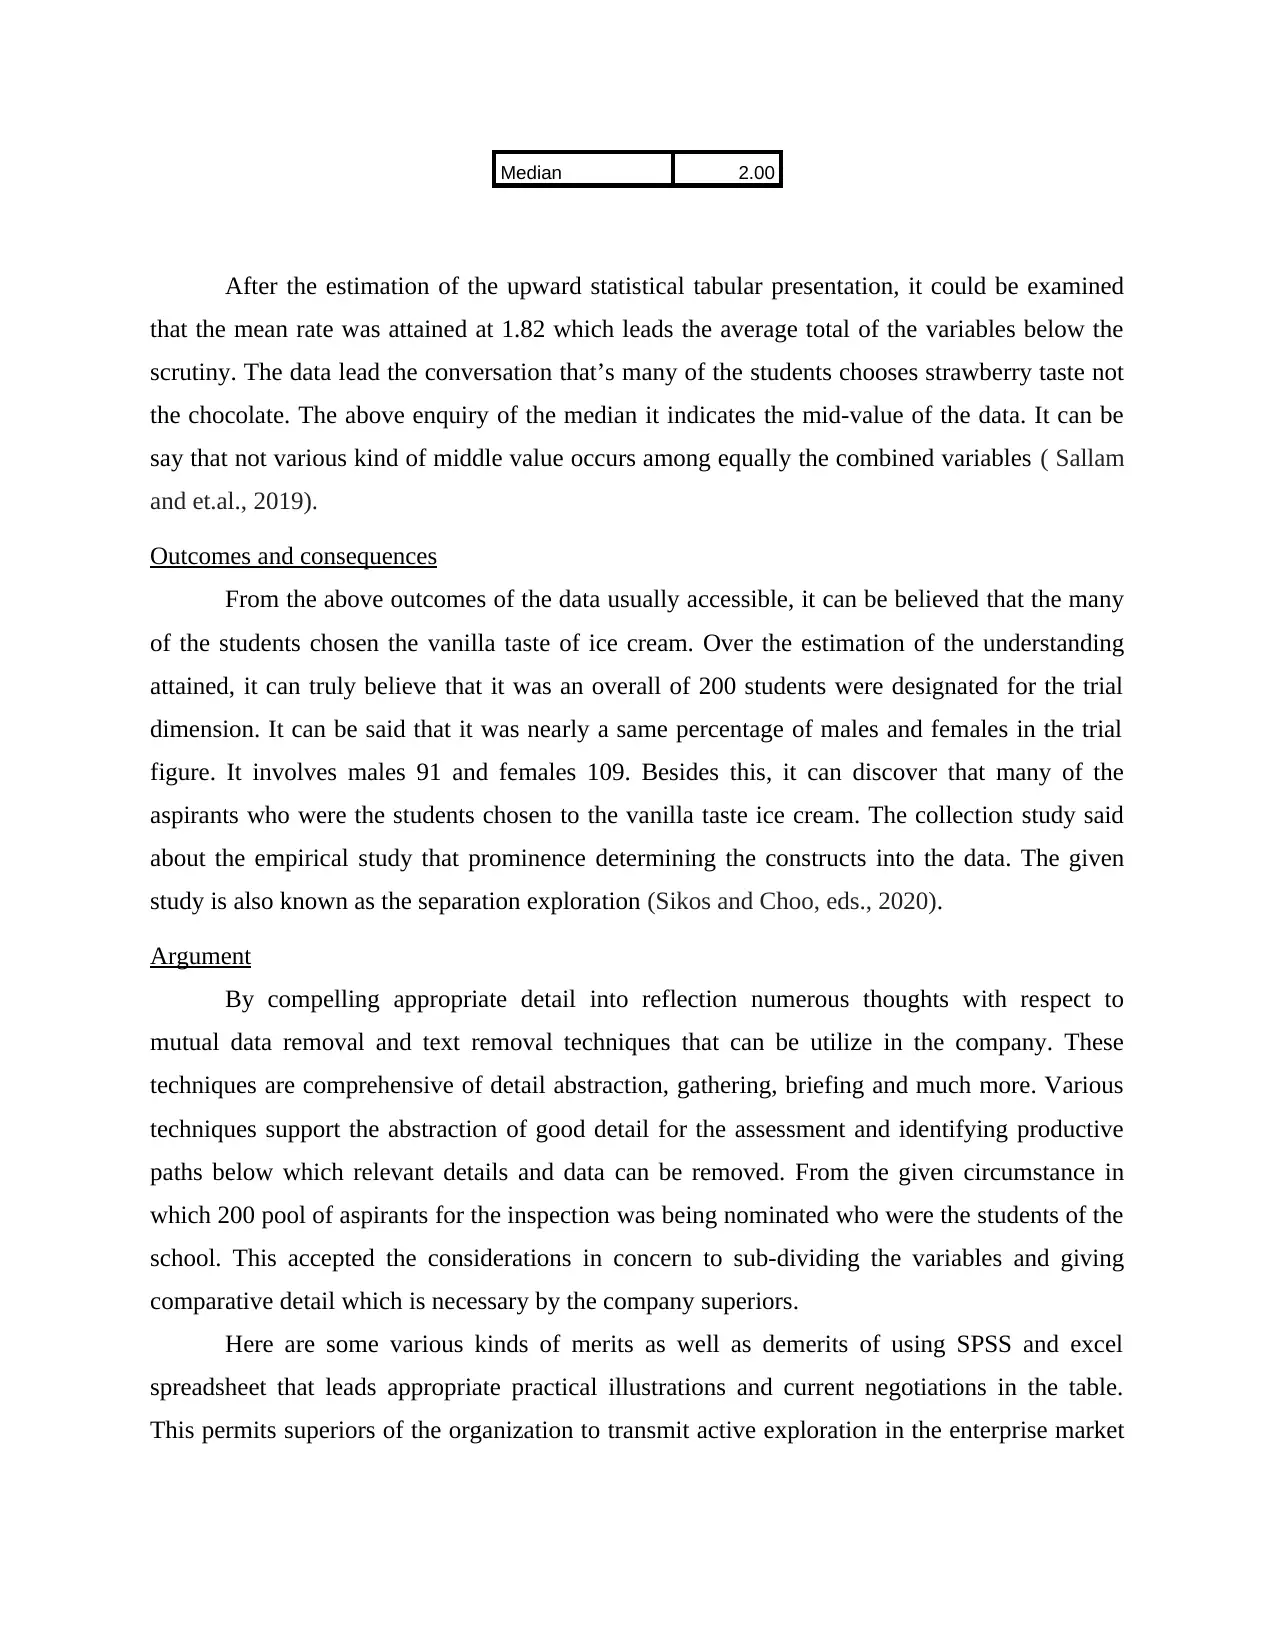
After the estimation of the upward statistical tabular presentation, it could be examined
that the mean rate was attained at 1.82 which leads the average total of the variables below the
scrutiny. The data lead the conversation that’s many of the students chooses strawberry taste not
the chocolate. The above enquiry of the median it indicates the mid-value of the data. It can be
say that not various kind of middle value occurs among equally the combined variables ( Sallam
and et.al., 2019).
Outcomes and consequences
From the above outcomes of the data usually accessible, it can be believed that the many
of the students chosen the vanilla taste of ice cream. Over the estimation of the understanding
attained, it can truly believe that it was an overall of 200 students were designated for the trial
dimension. It can be said that it was nearly a same percentage of males and females in the trial
figure. It involves males 91 and females 109. Besides this, it can discover that many of the
aspirants who were the students chosen to the vanilla taste ice cream. The collection study said
about the empirical study that prominence determining the constructs into the data. The given
study is also known as the separation exploration (Sikos and Choo, eds., 2020).
Argument
By compelling appropriate detail into reflection numerous thoughts with respect to
mutual data removal and text removal techniques that can be utilize in the company. These
techniques are comprehensive of detail abstraction, gathering, briefing and much more. Various
techniques support the abstraction of good detail for the assessment and identifying productive
paths below which relevant details and data can be removed. From the given circumstance in
which 200 pool of aspirants for the inspection was being nominated who were the students of the
school. This accepted the considerations in concern to sub-dividing the variables and giving
comparative detail which is necessary by the company superiors.
Here are some various kinds of merits as well as demerits of using SPSS and excel
spreadsheet that leads appropriate practical illustrations and current negotiations in the table.
This permits superiors of the organization to transmit active exploration in the enterprise market
and identify efficiently formulate on the basis of it performance can be attained ( Wright and
Schultz, 2018).
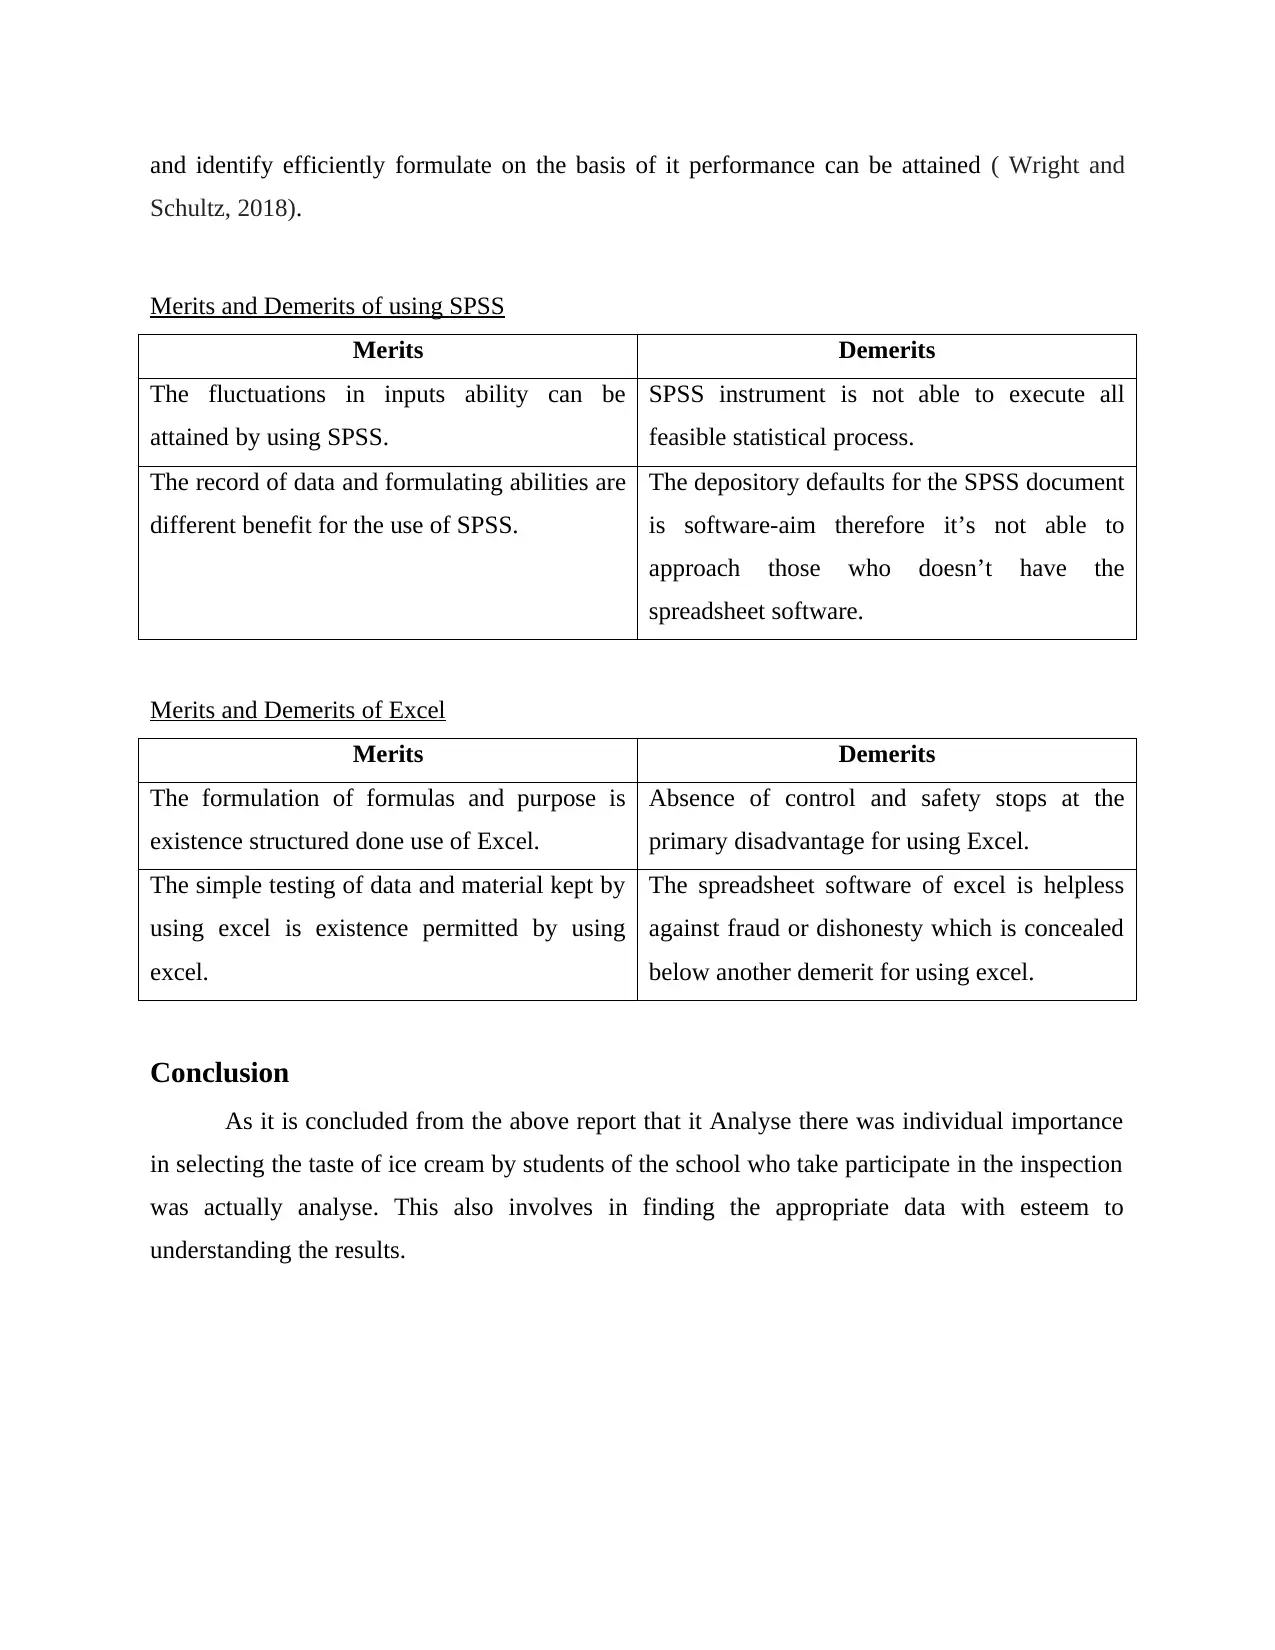
Merits and Demerits of using SPSS
Merits Demerits
The fluctuations in inputs ability can be
attained by using SPSS.
SPSS instrument is not able to execute all
feasible statistical process.
The record of data and formulating abilities are
different benefit for the use of SPSS.
The depository defaults for the SPSS document
is software-aim therefore it’s not able to
approach those who doesn’t have the
spreadsheet software.
Merits and Demerits of Excel
Merits Demerits
The formulation of formulas and purpose is
existence structured done use of Excel.
Absence of control and safety stops at the
primary disadvantage for using Excel.
The simple testing of data and material kept by
using excel is existence permitted by using
excel.
The spreadsheet software of excel is helpless
against fraud or dishonesty which is concealed
below another demerit for using excel.
Conclusion
As it is concluded from the above report that it Analyse there was individual importance
in selecting the taste of ice cream by students of the school who take participate in the inspection
was actually analyse. This also involves in finding the appropriate data with esteem to
understanding the results.
Schultz, 2018).
Merits and Demerits of using SPSS
Merits Demerits
The fluctuations in inputs ability can be
attained by using SPSS.
SPSS instrument is not able to execute all
feasible statistical process.
The record of data and formulating abilities are
different benefit for the use of SPSS.
The depository defaults for the SPSS document
is software-aim therefore it’s not able to
approach those who doesn’t have the
spreadsheet software.
Merits and Demerits of Excel
Merits Demerits
The formulation of formulas and purpose is
existence structured done use of Excel.
Absence of control and safety stops at the
primary disadvantage for using Excel.
The simple testing of data and material kept by
using excel is existence permitted by using
excel.
The spreadsheet software of excel is helpless
against fraud or dishonesty which is concealed
below another demerit for using excel.
Conclusion
As it is concluded from the above report that it Analyse there was individual importance
in selecting the taste of ice cream by students of the school who take participate in the inspection
was actually analyse. This also involves in finding the appropriate data with esteem to
understanding the results.
⊘ This is a preview!⊘
Do you want full access?
Subscribe today to unlock all pages.
Trusted by 1+ million students worldwide
1 out of 17
Related Documents


Your All-in-One AI-Powered Toolkit for Academic Success.
+13062052269
info@desklib.com
Available 24*7 on WhatsApp / Email
![[object Object]](/_next/static/media/star-bottom.7253800d.svg)
Unlock your academic potential
Copyright © 2020–2026 A2Z Services. All Rights Reserved. Developed and managed by ZUCOL.