Report on Data Handling and Business Intelligence with Excel, SPSS
VerifiedAdded on 2023/06/18
|15
|3333
|114
Report
AI Summary
This report explores data handling and business intelligence techniques, focusing on the use of Excel for preprocessing data and SPSS for analysis. It evaluates Excel's capabilities in data preprocessing, including feature sealing, encoding, and handling missing data. The report analyzes sales and profit data, visualizing trends and potential improvements. It also examines a dataset from Smile Clinic using SPSS, calculating statistics like mean, median, and mode for customer demographics and dietary habits. Furthermore, the report discusses common data mining methods used in businesses and compares the advantages and limitations of SPSS over Excel, highlighting their respective strengths in data analysis and decision-making. Desklib provides this student contributed assignment along with a wealth of study resources for students.
Data Handling And Business
Intelligence-2
Intelligence-2
Paraphrase This Document
Need a fresh take? Get an instant paraphrase of this document with our AI Paraphraser
TABLE OF CONTENTS
INTRODUCTION...........................................................................................................................3
MAIN BODY..................................................................................................................................3
PART 1............................................................................................................................................3
Evaluate the use of Excel for pre-processing the data.................................................................3
Analysing the data and visualising the data.................................................................................4
PART 2............................................................................................................................................7
Numbers of customers of Smile clinic who eat rice along with mean, median and mode..........7
Number of male and female customers of Smile Clinic..............................................................9
Mean and median of the ages....................................................................................................10
Specific example of clustering by showing what does K means...............................................11
The most common data mining methods used in businesses....................................................12
Advantages and limitations of SPSS over excel........................................................................12
CONCLUSION..............................................................................................................................13
REFERENCES................................................................................................................................1
INTRODUCTION
Data Handling And Business Intelligence is the process for storing the data, gathering,
access and secure data with various software technology. Employment data management enables
for the efficient access of data insights and they are usually required for having the biggest
solution. This report will explain about use of excel for pre-processing data and use of excel with
having one function such as chart and graph. Along with this also examined about the
smile_clinic.csv provided conjunction with SPSS and various methods of data mining that could
used in business context. Also, discuss the advantage and disadvantage of SPSS in excel.
MAIN BODY
PART 1
Evaluate the use of Excel for pre-processing the data
Data processing that could prefer the raw data which could converted into the
understandable format data. This could also help the business for processing their dataset and
make sure for highly securing their data (Venkatesh and Rengaraj, 2021). As employee can
prefers their dataset for having the excel sheet and that could contain the frequency about various
terms in working with dataset. Data processing techniques such as feature sealing, encoding data,
importing and finding missing data. Alongside this will help the business and data processing
about the important has increased more accuracy of using models. This might be more helpful
for having their identification about those data which are missing with the securing data sources
and that could also come to know about those activities which could make their better terms and
policies. Excel this could with the great tool and that could make sure for having those tools
which could help the business or organization for working with having their proper connection.
While having such kind of software this could led with having the proper estimation in
dataset and make sure about their sufficient uses. This could also helpful for knowing about how
the data will work and completion over those things which could keep those activities for
working with more effectiveness (Dabhade and et.al., 2021). Being able for applying their
techniques for dealing with many common problems and that could led with having their various
impacts. This could also make sure for having their many possible things and that might be more
raw data including those missing data and data from the various multiple sources. While such
kind of activities helpful for the business in keeping their working records and that could be
⊘ This is a preview!⊘
Do you want full access?
Subscribe today to unlock all pages.
Trusted by 1+ million students worldwide
useful for having various types of submission in process. Data pre-processing consists about
those variable data steps up for transferring many sources for the data and keeping them for
working with many more future aspects. Pre-processing aims at assessing and improving the
quality of data to allow for reliable statistical analysis. As the excel keep working with many
more things that could led them for working with many more processing terms and make sure for
having their high effective process.
During pre-processing those activities make sure about their statistical concepts and kind
of activities which could keep them for working with high effectiveness. Similarly, avoid the
reaching out various other sources and that might be more helpful for concepts and effectively
come to know about those things which could working. Moreover, significant about the trial and
error on differently pre-process about those sources which are might be important for the
business (Bang and Kim, 2020). As data processing is also seems important steps about the data
mining which could keep the business methods for using those further activities which could
help for making the organization for working with high process. While this should resulting out
of range and income sources about the impossible data those combination process. Sometime,
this could keep affected the ways for finding out the results for working and keeping high
measure effective.
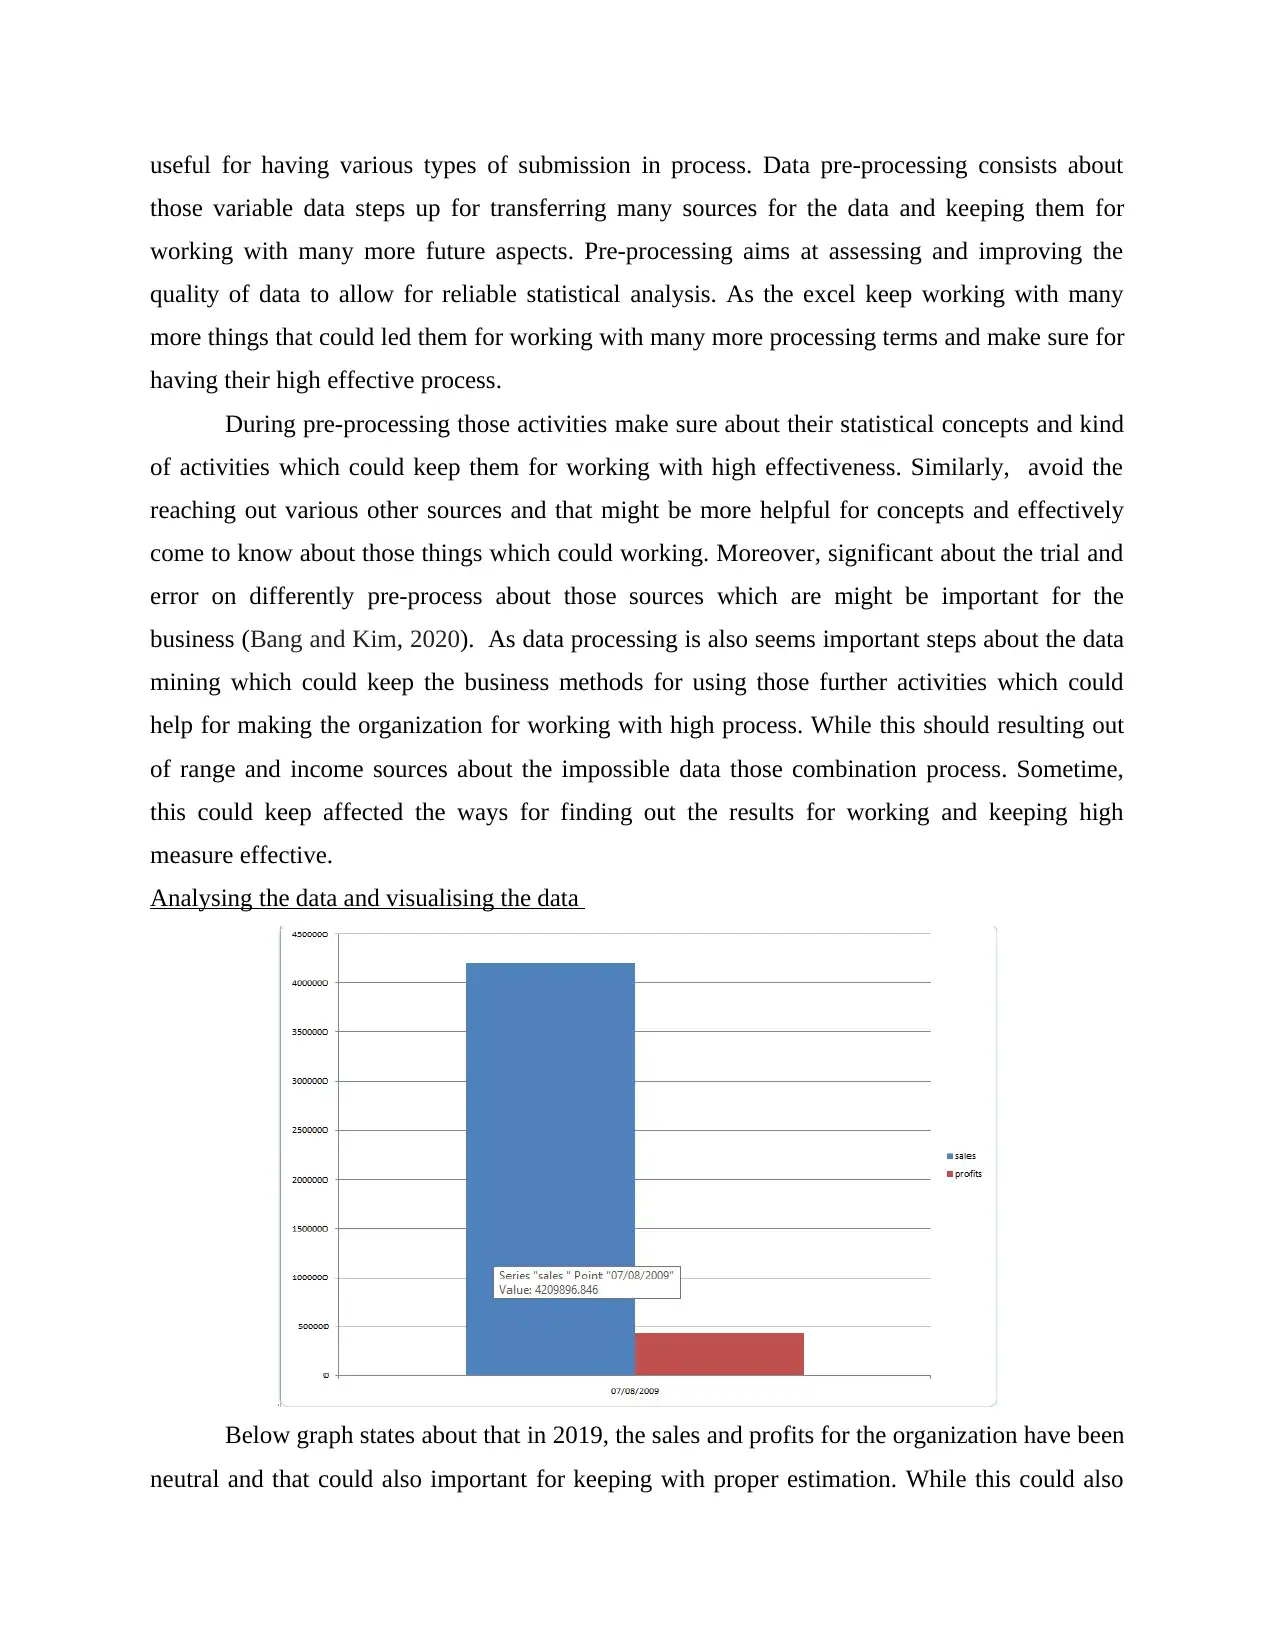
Analysing the data and visualising the data
Below graph states about that in 2019, the sales and profits for the organization have been
neutral and that could also important for keeping with proper estimation. While this could also
those variable data steps up for transferring many sources for the data and keeping them for
working with many more future aspects. Pre-processing aims at assessing and improving the
quality of data to allow for reliable statistical analysis. As the excel keep working with many
more things that could led them for working with many more processing terms and make sure for
having their high effective process.
During pre-processing those activities make sure about their statistical concepts and kind
of activities which could keep them for working with high effectiveness. Similarly, avoid the
reaching out various other sources and that might be more helpful for concepts and effectively
come to know about those things which could working. Moreover, significant about the trial and
error on differently pre-process about those sources which are might be important for the
business (Bang and Kim, 2020). As data processing is also seems important steps about the data
mining which could keep the business methods for using those further activities which could
help for making the organization for working with high process. While this should resulting out
of range and income sources about the impossible data those combination process. Sometime,
this could keep affected the ways for finding out the results for working and keeping high
measure effective.
Analysing the data and visualising the data
Below graph states about that in 2019, the sales and profits for the organization have been
neutral and that could also important for keeping with proper estimation. While this could also
Paraphrase This Document
Need a fresh take? Get an instant paraphrase of this document with our AI Paraphraser
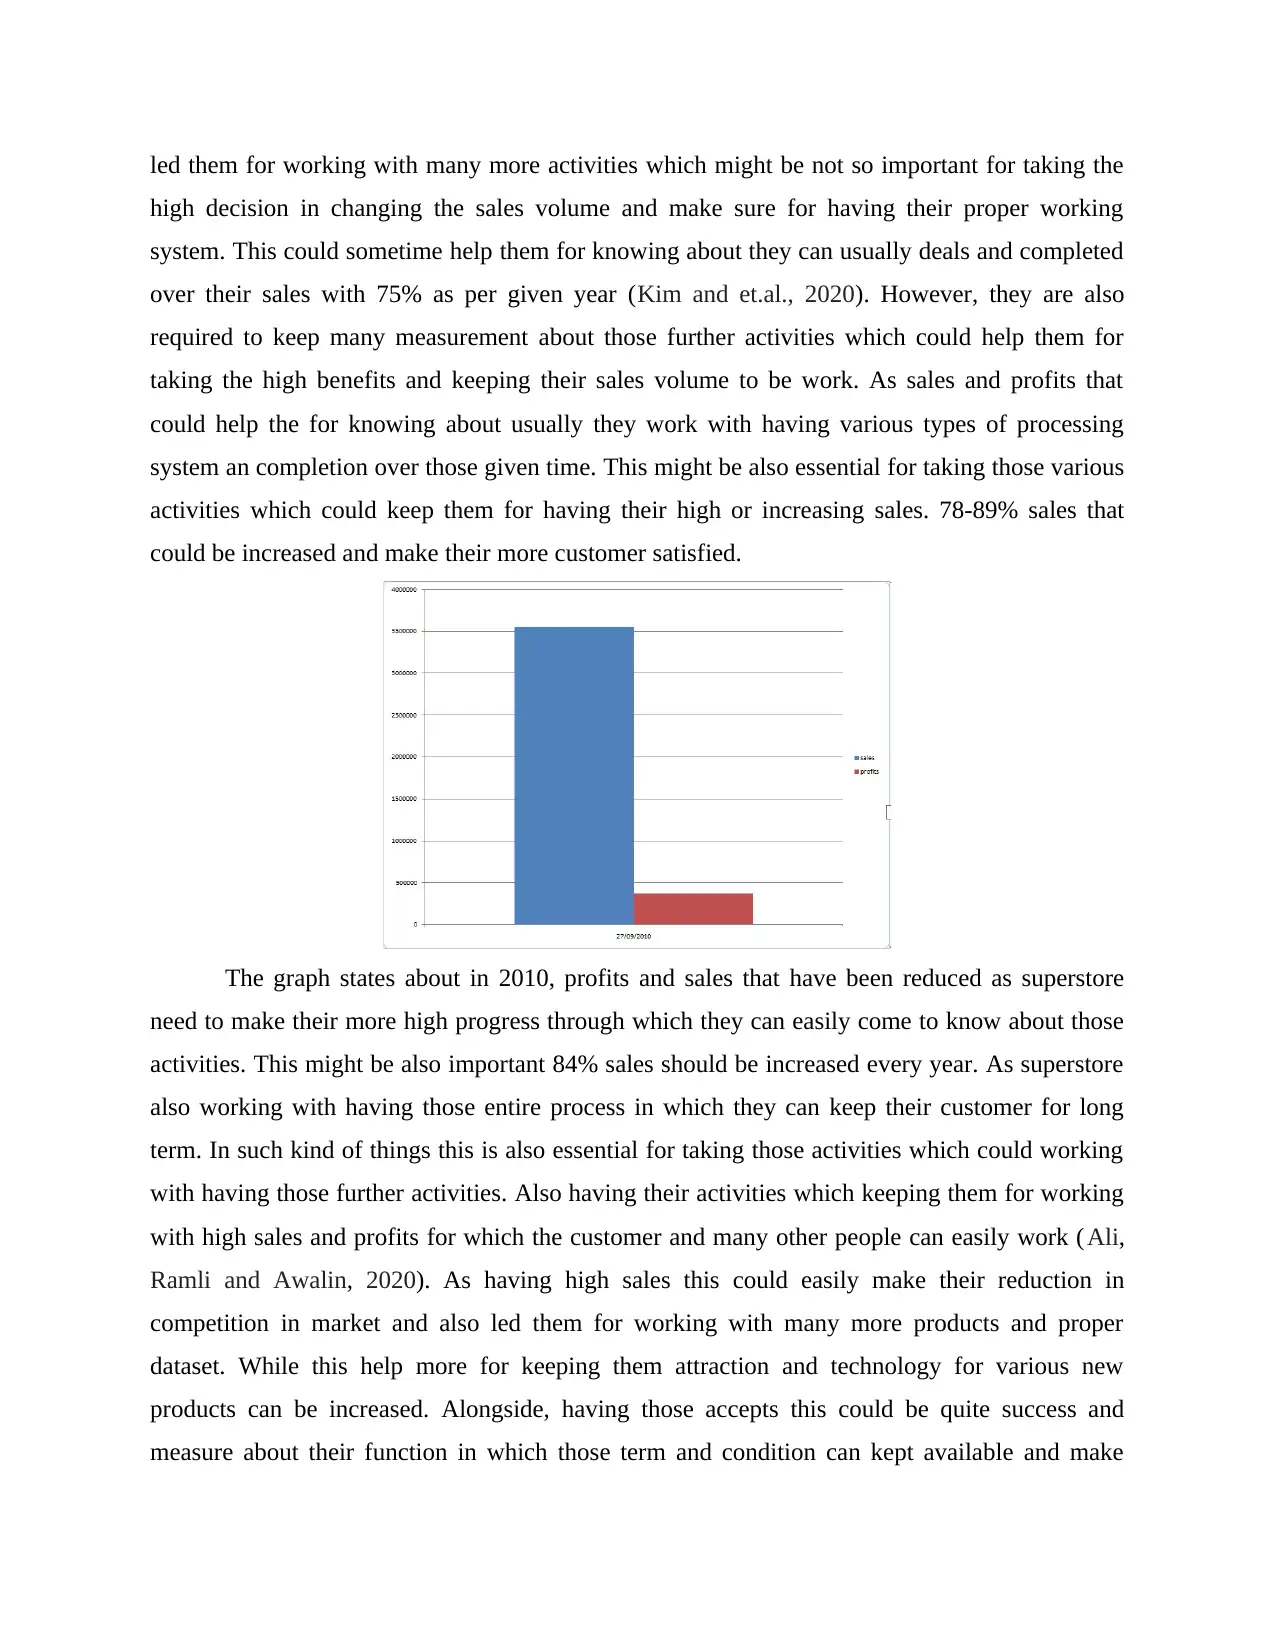
led them for working with many more activities which might be not so important for taking the
high decision in changing the sales volume and make sure for having their proper working
system. This could sometime help them for knowing about they can usually deals and completed
over their sales with 75% as per given year (Kim and et.al., 2020). However, they are also
required to keep many measurement about those further activities which could help them for
taking the high benefits and keeping their sales volume to be work. As sales and profits that
could help the for knowing about usually they work with having various types of processing
system an completion over those given time. This might be also essential for taking those various
activities which could keep them for having their high or increasing sales. 78-89% sales that
could be increased and make their more customer satisfied.
The graph states about in 2010, profits and sales that have been reduced as superstore
need to make their more high progress through which they can easily come to know about those
activities. This might be also important 84% sales should be increased every year. As superstore
also working with having those entire process in which they can keep their customer for long
term. In such kind of things this is also essential for taking those activities which could working
with having those further activities. Also having their activities which keeping them for working
with high sales and profits for which the customer and many other people can easily work ( Ali,
Ramli and Awalin, 2020). As having high sales this could easily make their reduction in
competition in market and also led them for working with many more products and proper
dataset. While this help more for keeping them attraction and technology for various new
products can be increased. Alongside, having those accepts this could be quite success and
measure about their function in which those term and condition can kept available and make
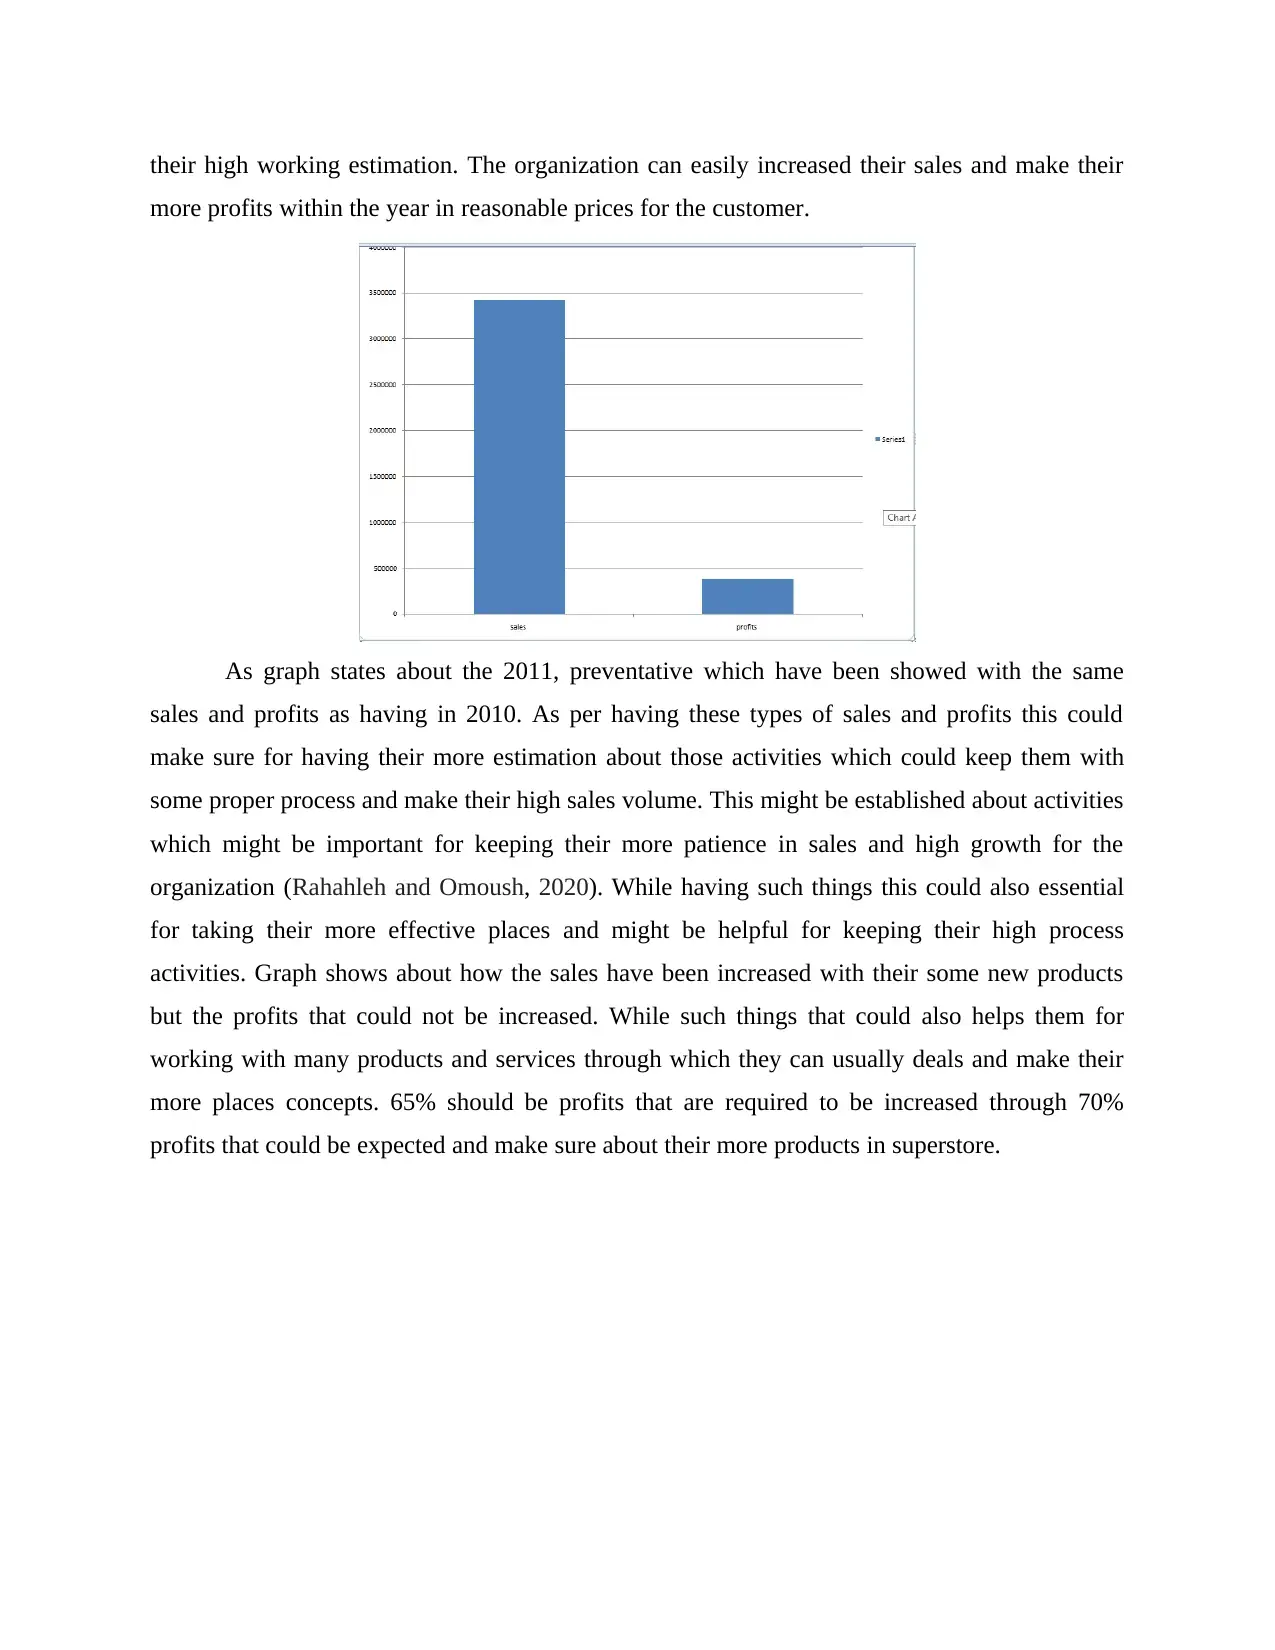
their high working estimation. The organization can easily increased their sales and make their
more profits within the year in reasonable prices for the customer.
As graph states about the 2011, preventative which have been showed with the same
sales and profits as having in 2010. As per having these types of sales and profits this could
make sure for having their more estimation about those activities which could keep them with
some proper process and make their high sales volume. This might be established about activities
which might be important for keeping their more patience in sales and high growth for the
organization (Rahahleh and Omoush, 2020). While having such things this could also essential
for taking their more effective places and might be helpful for keeping their high process
activities. Graph shows about how the sales have been increased with their some new products
but the profits that could not be increased. While such things that could also helps them for
working with many products and services through which they can usually deals and make their
more places concepts. 65% should be profits that are required to be increased through 70%
profits that could be expected and make sure about their more products in superstore.
⊘ This is a preview!⊘
Do you want full access?
Subscribe today to unlock all pages.
Trusted by 1+ million students worldwide
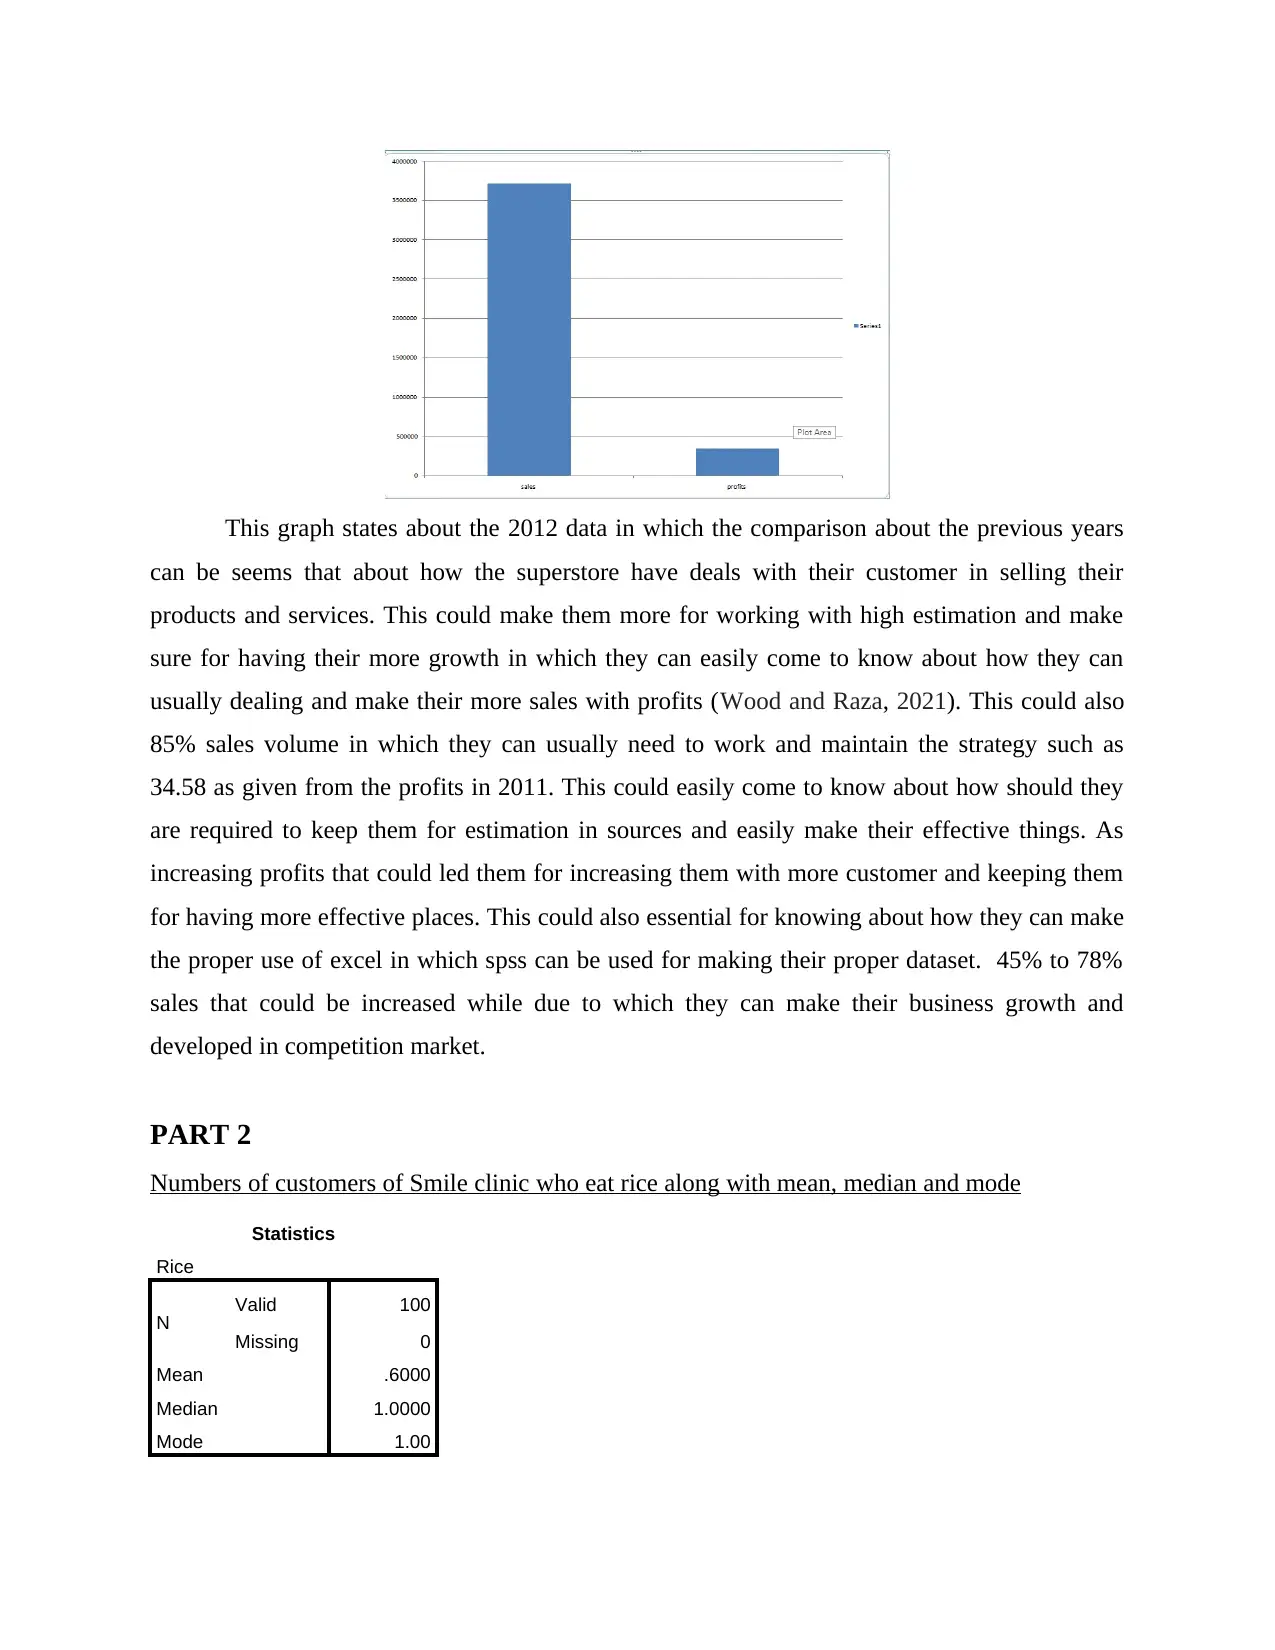
This graph states about the 2012 data in which the comparison about the previous years
can be seems that about how the superstore have deals with their customer in selling their
products and services. This could make them more for working with high estimation and make
sure for having their more growth in which they can easily come to know about how they can
usually dealing and make their more sales with profits (Wood and Raza, 2021). This could also
85% sales volume in which they can usually need to work and maintain the strategy such as
34.58 as given from the profits in 2011. This could easily come to know about how should they
are required to keep them for estimation in sources and easily make their effective things. As
increasing profits that could led them for increasing them with more customer and keeping them
for having more effective places. This could also essential for knowing about how they can make
the proper use of excel in which spss can be used for making their proper dataset. 45% to 78%
sales that could be increased while due to which they can make their business growth and
developed in competition market.
PART 2
Numbers of customers of Smile clinic who eat rice along with mean, median and mode
Statistics
Rice
N Valid 100
Missing 0
Mean .6000
Median 1.0000
Mode 1.00
Paraphrase This Document
Need a fresh take? Get an instant paraphrase of this document with our AI Paraphraser
Rice
Frequency Percent Valid Percent Cumulative
Percent
Valid
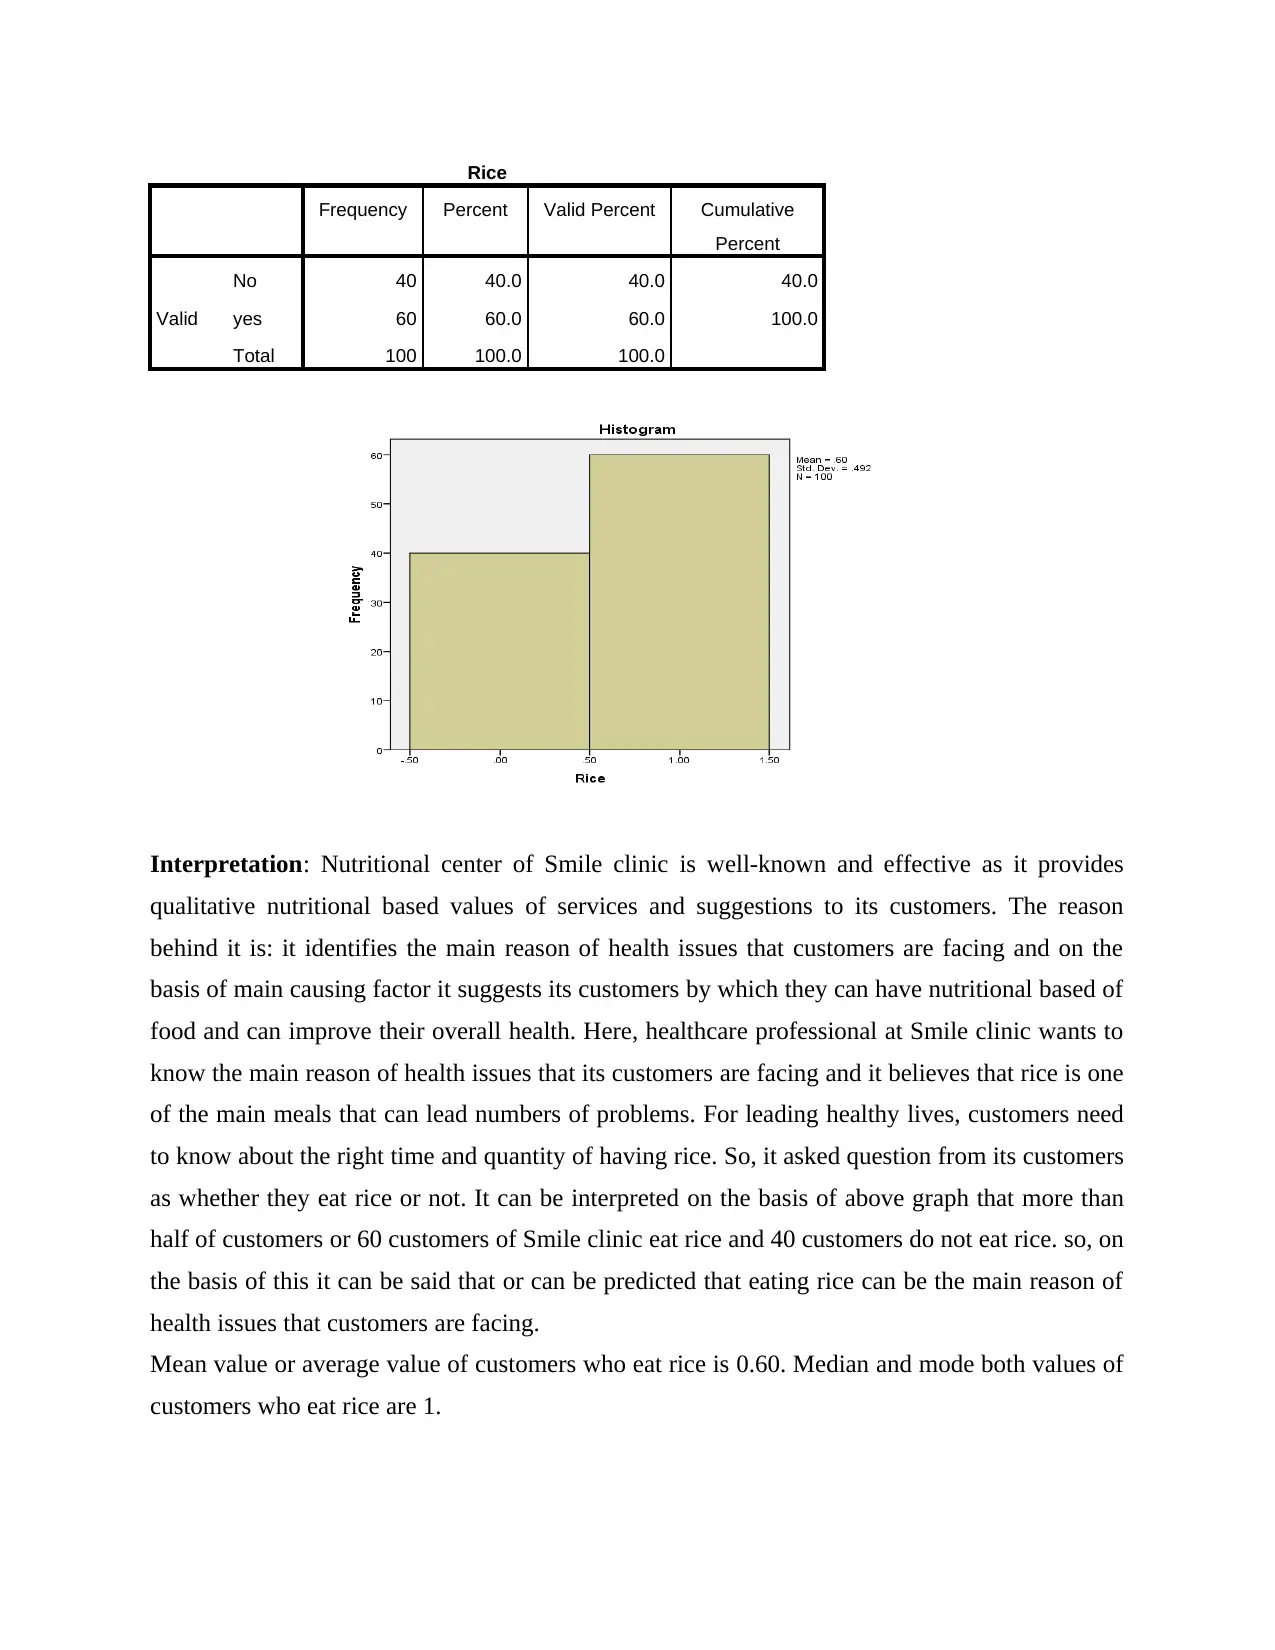
No 40 40.0 40.0 40.0
yes 60 60.0 60.0 100.0
Total 100 100.0 100.0
Interpretation: Nutritional center of Smile clinic is well-known and effective as it provides
qualitative nutritional based values of services and suggestions to its customers. The reason
behind it is: it identifies the main reason of health issues that customers are facing and on the
basis of main causing factor it suggests its customers by which they can have nutritional based of
food and can improve their overall health. Here, healthcare professional at Smile clinic wants to
know the main reason of health issues that its customers are facing and it believes that rice is one
of the main meals that can lead numbers of problems. For leading healthy lives, customers need
to know about the right time and quantity of having rice. So, it asked question from its customers
as whether they eat rice or not. It can be interpreted on the basis of above graph that more than
half of customers or 60 customers of Smile clinic eat rice and 40 customers do not eat rice. so, on
the basis of this it can be said that or can be predicted that eating rice can be the main reason of
health issues that customers are facing.
Mean value or average value of customers who eat rice is 0.60. Median and mode both values of
customers who eat rice are 1.
Frequency Percent Valid Percent Cumulative
Percent
Valid
No 40 40.0 40.0 40.0
yes 60 60.0 60.0 100.0
Total 100 100.0 100.0
Interpretation: Nutritional center of Smile clinic is well-known and effective as it provides
qualitative nutritional based values of services and suggestions to its customers. The reason
behind it is: it identifies the main reason of health issues that customers are facing and on the
basis of main causing factor it suggests its customers by which they can have nutritional based of
food and can improve their overall health. Here, healthcare professional at Smile clinic wants to
know the main reason of health issues that its customers are facing and it believes that rice is one
of the main meals that can lead numbers of problems. For leading healthy lives, customers need
to know about the right time and quantity of having rice. So, it asked question from its customers
as whether they eat rice or not. It can be interpreted on the basis of above graph that more than
half of customers or 60 customers of Smile clinic eat rice and 40 customers do not eat rice. so, on
the basis of this it can be said that or can be predicted that eating rice can be the main reason of
health issues that customers are facing.
Mean value or average value of customers who eat rice is 0.60. Median and mode both values of
customers who eat rice are 1.
Number of male and female customers of Smile Clinic
Statistics
Gender
N Valid 100
Missing 0
Gender
Frequency Percent Valid Percent Cumulative
Percent
Valid
Male 50 50.0 50.0 50.0
Female 50 50.0 50.0 100.0
Total 100 100.0 100.0
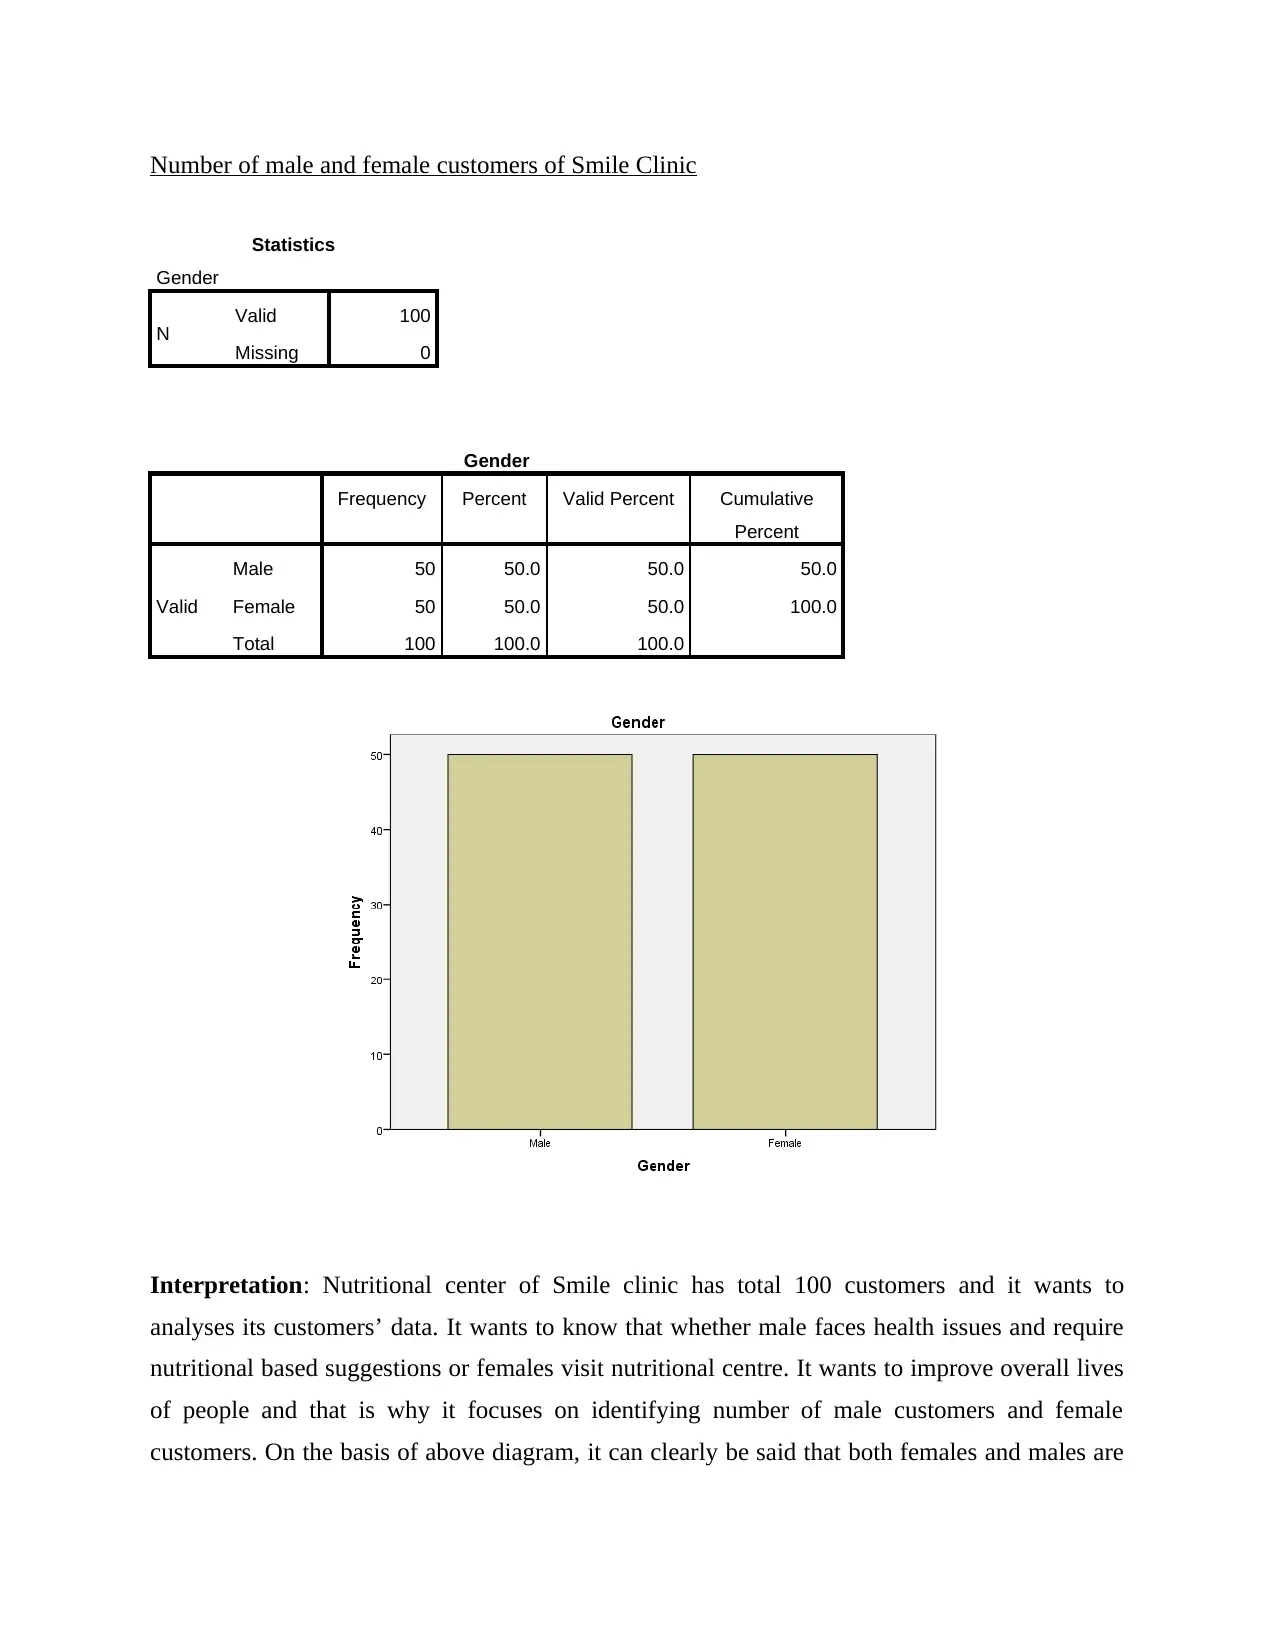
Interpretation: Nutritional center of Smile clinic has total 100 customers and it wants to
analyses its customers’ data. It wants to know that whether male faces health issues and require
nutritional based suggestions or females visit nutritional centre. It wants to improve overall lives
of people and that is why it focuses on identifying number of male customers and female
customers. On the basis of above diagram, it can clearly be said that both females and males are
Statistics
Gender
N Valid 100
Missing 0
Gender
Frequency Percent Valid Percent Cumulative
Percent
Valid
Male 50 50.0 50.0 50.0
Female 50 50.0 50.0 100.0
Total 100 100.0 100.0
Interpretation: Nutritional center of Smile clinic has total 100 customers and it wants to
analyses its customers’ data. It wants to know that whether male faces health issues and require
nutritional based suggestions or females visit nutritional centre. It wants to improve overall lives
of people and that is why it focuses on identifying number of male customers and female
customers. On the basis of above diagram, it can clearly be said that both females and males are
⊘ This is a preview!⊘
Do you want full access?
Subscribe today to unlock all pages.
Trusted by 1+ million students worldwide
equal in numbers which means the ratio female and male customer of smile clinic who visit and
go for better suggestions for improving health is 1:1. Out of 100 customers, male customers of
smile clinic are 50 and female customers are also 50. On this basis, it can be said that both males
and females are health conscious and wants to know about food and other things by which they
can improve their health.
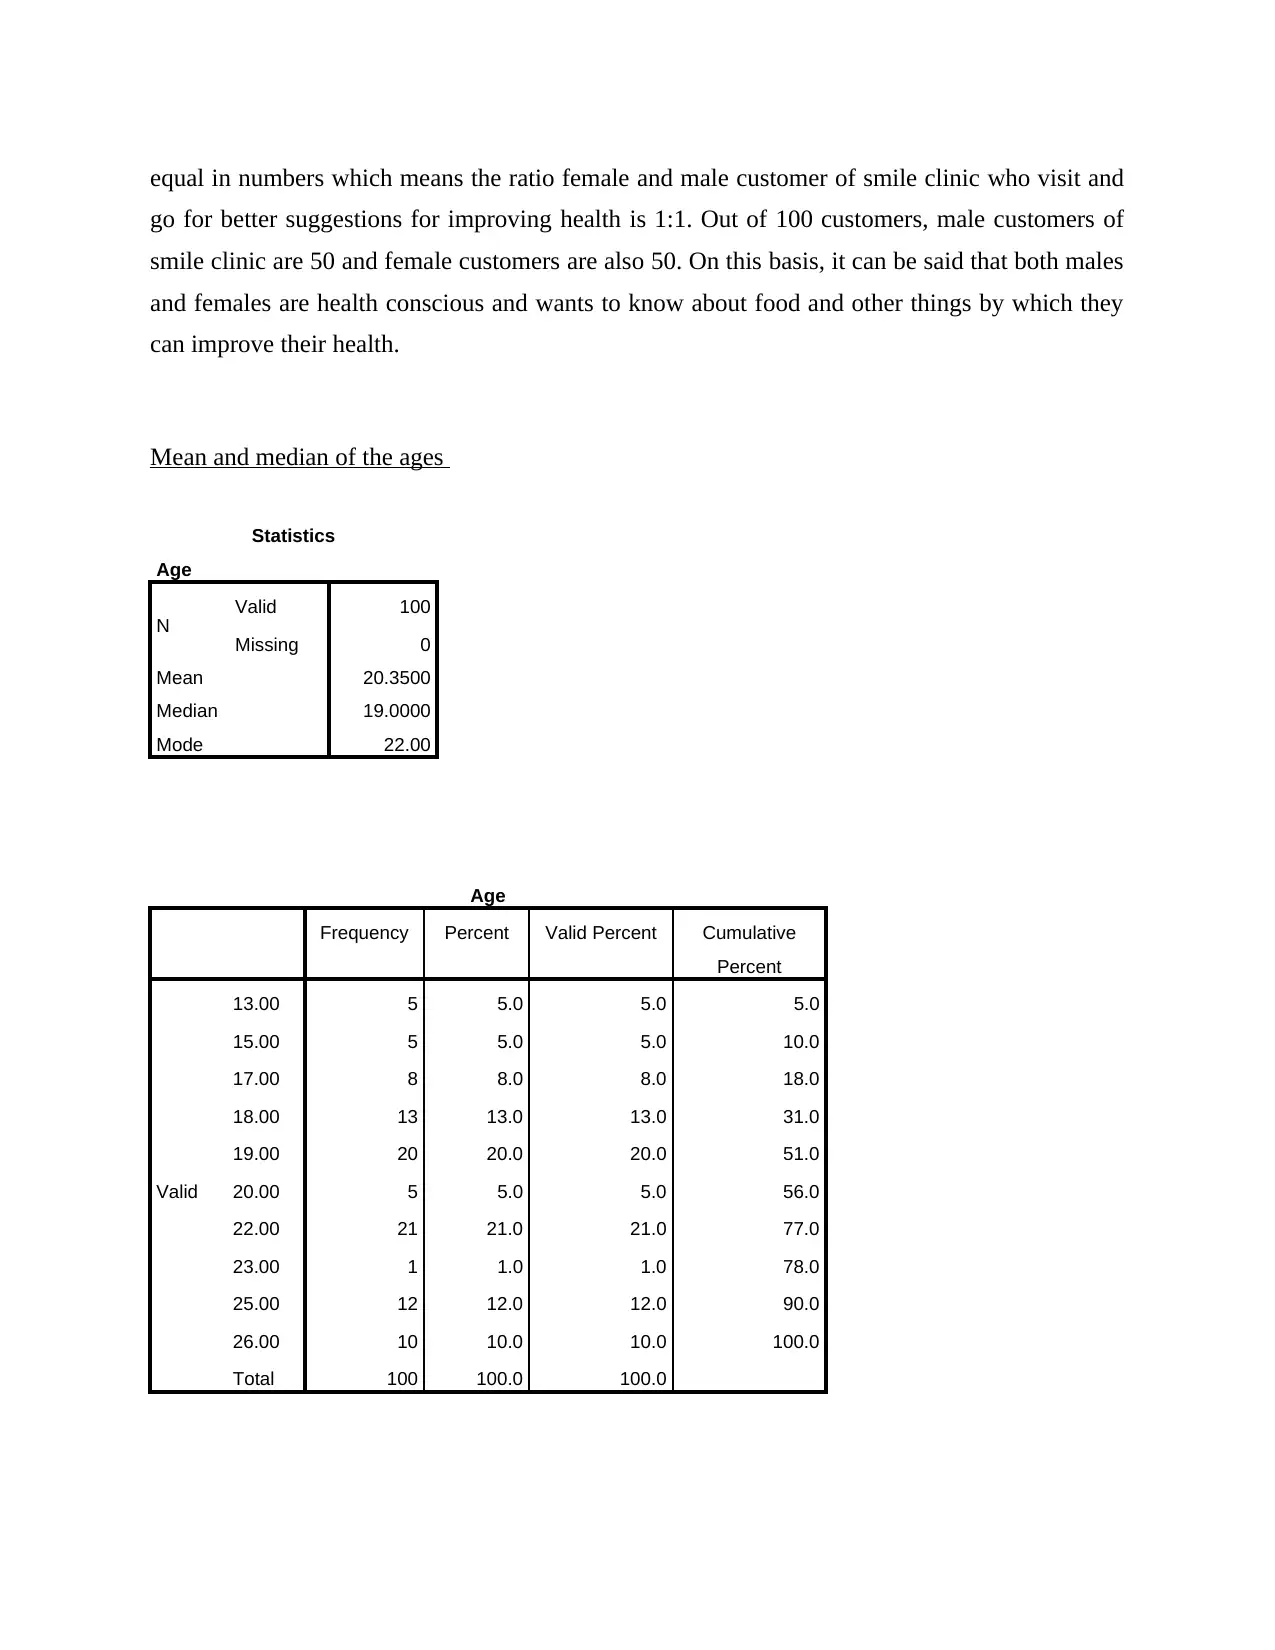
Mean and median of the ages
Statistics
Age
N Valid 100
Missing 0
Mean 20.3500
Median 19.0000
Mode 22.00
Age
Frequency Percent Valid Percent Cumulative
Percent
Valid
13.00 5 5.0 5.0 5.0
15.00 5 5.0 5.0 10.0
17.00 8 8.0 8.0 18.0
18.00 13 13.0 13.0 31.0
19.00 20 20.0 20.0 51.0
20.00 5 5.0 5.0 56.0
22.00 21 21.0 21.0 77.0
23.00 1 1.0 1.0 78.0
25.00 12 12.0 12.0 90.0
26.00 10 10.0 10.0 100.0
Total 100 100.0 100.0
go for better suggestions for improving health is 1:1. Out of 100 customers, male customers of
smile clinic are 50 and female customers are also 50. On this basis, it can be said that both males
and females are health conscious and wants to know about food and other things by which they
can improve their health.
Mean and median of the ages
Statistics
Age
N Valid 100
Missing 0
Mean 20.3500
Median 19.0000
Mode 22.00
Age
Frequency Percent Valid Percent Cumulative
Percent
Valid
13.00 5 5.0 5.0 5.0
15.00 5 5.0 5.0 10.0
17.00 8 8.0 8.0 18.0
18.00 13 13.0 13.0 31.0
19.00 20 20.0 20.0 51.0
20.00 5 5.0 5.0 56.0
22.00 21 21.0 21.0 77.0
23.00 1 1.0 1.0 78.0
25.00 12 12.0 12.0 90.0
26.00 10 10.0 10.0 100.0
Total 100 100.0 100.0
Paraphrase This Document
Need a fresh take? Get an instant paraphrase of this document with our AI Paraphraser
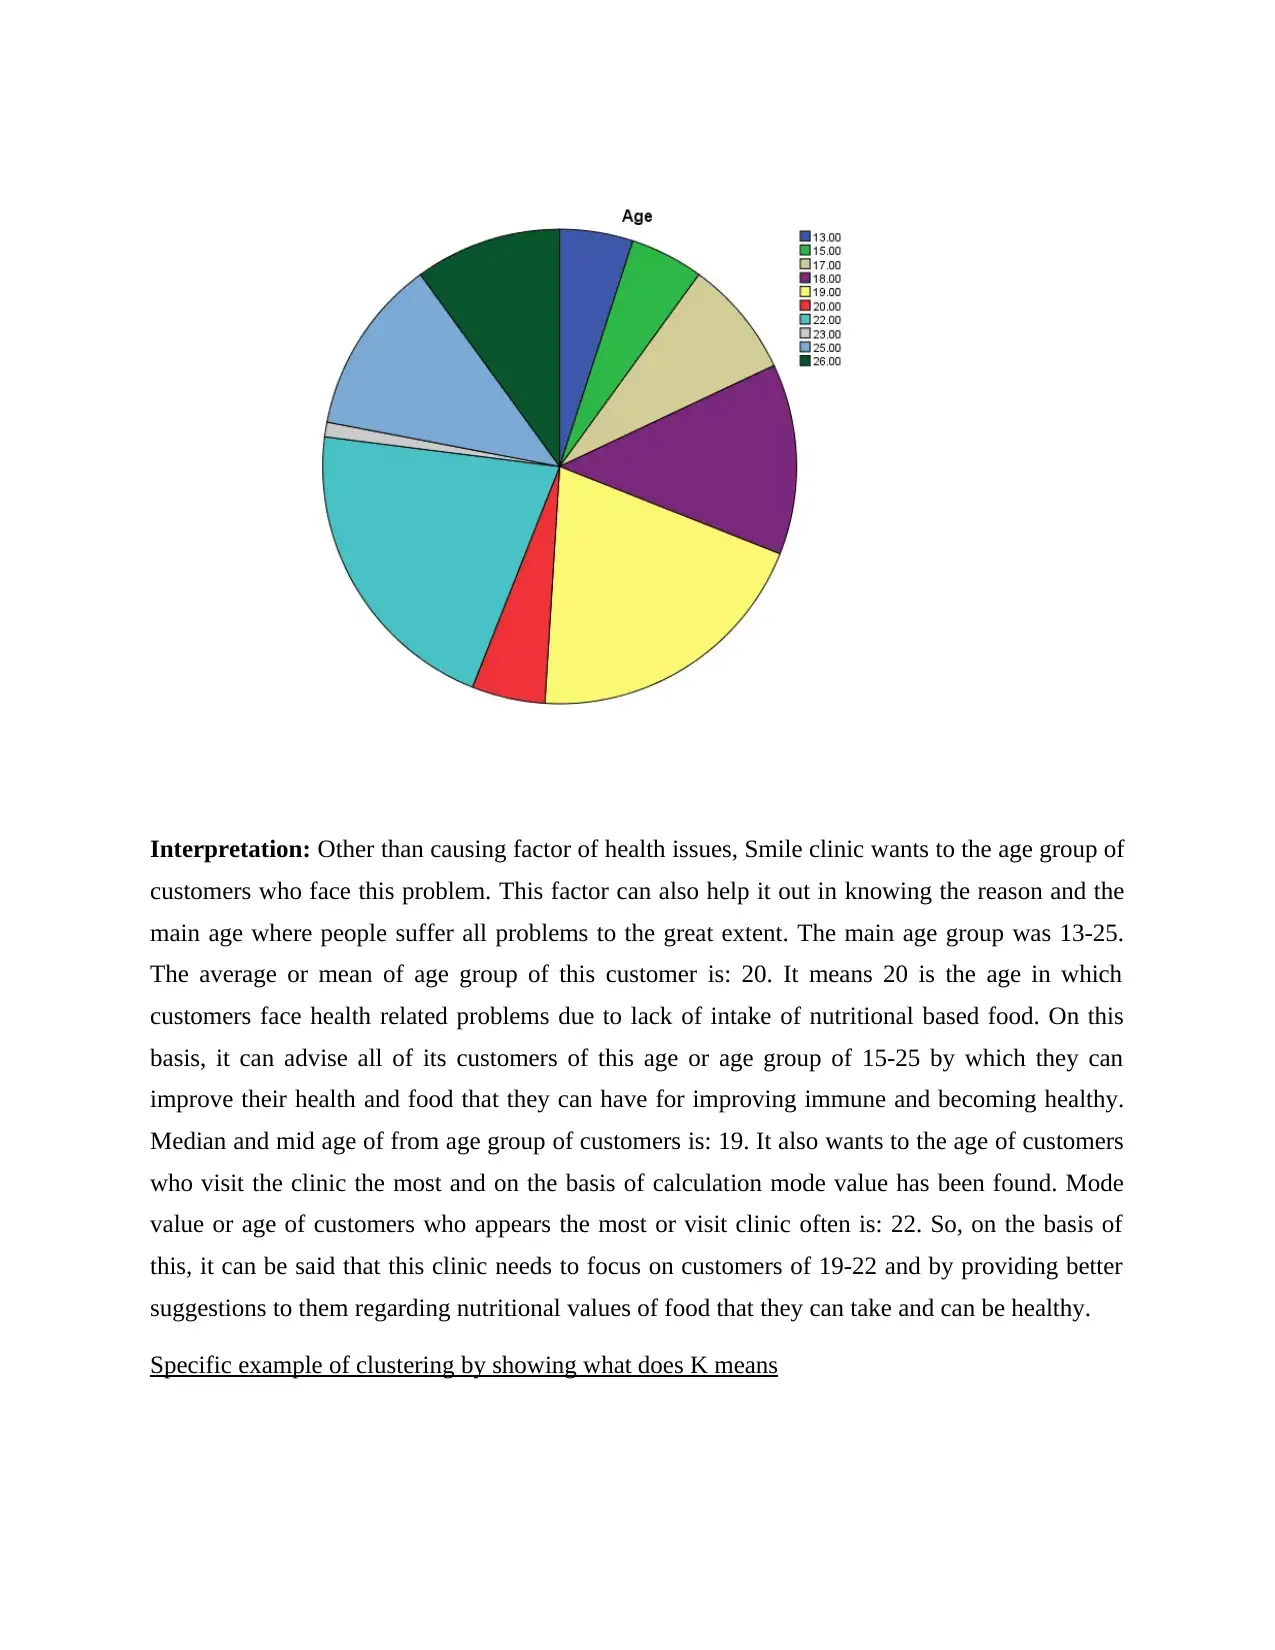
Interpretation: Other than causing factor of health issues, Smile clinic wants to the age group of
customers who face this problem. This factor can also help it out in knowing the reason and the
main age where people suffer all problems to the great extent. The main age group was 13-25.
The average or mean of age group of this customer is: 20. It means 20 is the age in which
customers face health related problems due to lack of intake of nutritional based food. On this
basis, it can advise all of its customers of this age or age group of 15-25 by which they can
improve their health and food that they can have for improving immune and becoming healthy.
Median and mid age of from age group of customers is: 19. It also wants to the age of customers
who visit the clinic the most and on the basis of calculation mode value has been found. Mode
value or age of customers who appears the most or visit clinic often is: 22. So, on the basis of
this, it can be said that this clinic needs to focus on customers of 19-22 and by providing better
suggestions to them regarding nutritional values of food that they can take and can be healthy.
Specific example of clustering by showing what does K means
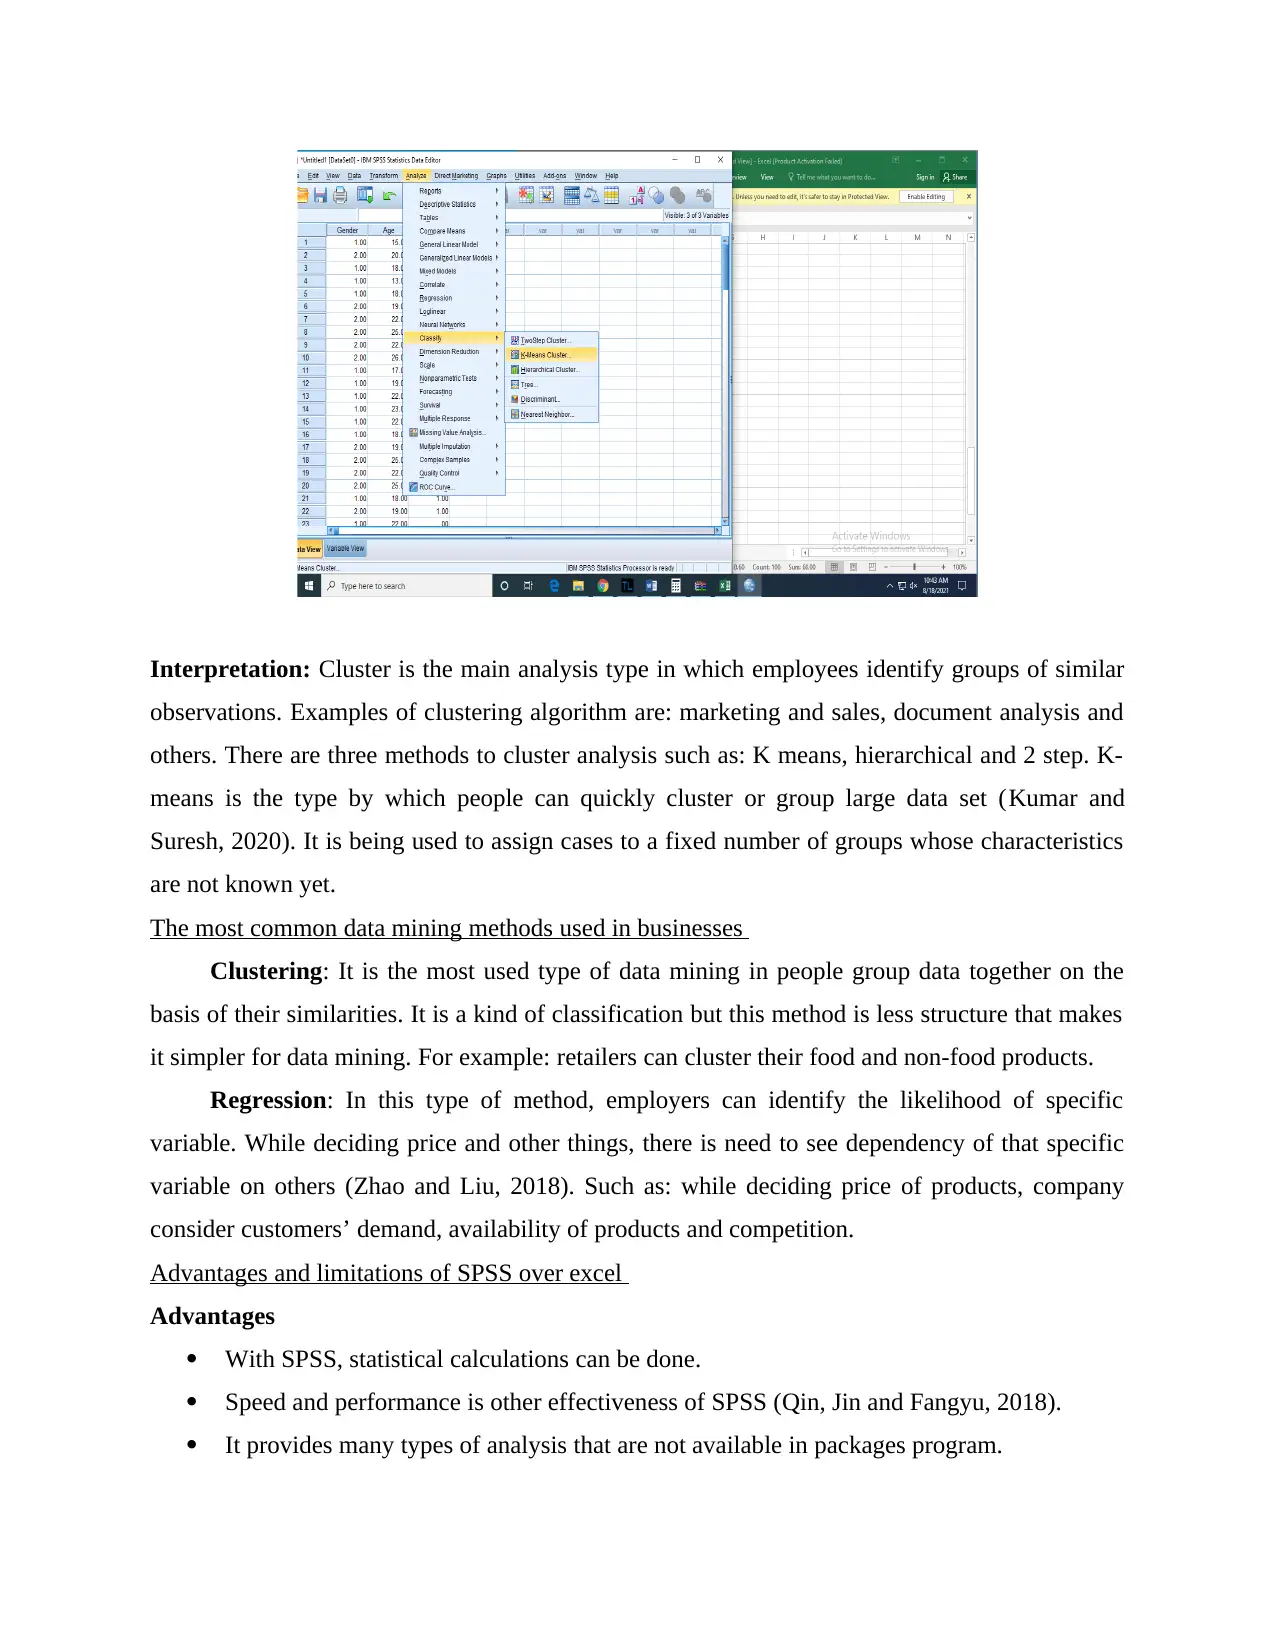
Interpretation: Cluster is the main analysis type in which employees identify groups of similar
observations. Examples of clustering algorithm are: marketing and sales, document analysis and
others. There are three methods to cluster analysis such as: K means, hierarchical and 2 step. K-
means is the type by which people can quickly cluster or group large data set (Kumar and
Suresh, 2020). It is being used to assign cases to a fixed number of groups whose characteristics
are not known yet.
The most common data mining methods used in businesses
Clustering: It is the most used type of data mining in people group data together on the
basis of their similarities. It is a kind of classification but this method is less structure that makes
it simpler for data mining. For example: retailers can cluster their food and non-food products.
Regression: In this type of method, employers can identify the likelihood of specific
variable. While deciding price and other things, there is need to see dependency of that specific
variable on others (Zhao and Liu, 2018). Such as: while deciding price of products, company
consider customers’ demand, availability of products and competition.
Advantages and limitations of SPSS over excel
Advantages
With SPSS, statistical calculations can be done.
Speed and performance is other effectiveness of SPSS (Qin, Jin and Fangyu, 2018).
It provides many types of analysis that are not available in packages program.
⊘ This is a preview!⊘
Do you want full access?
Subscribe today to unlock all pages.
Trusted by 1+ million students worldwide
1 out of 15
Related Documents


Your All-in-One AI-Powered Toolkit for Academic Success.
+13062052269
info@desklib.com
Available 24*7 on WhatsApp / Email
![[object Object]](/_next/static/media/star-bottom.7253800d.svg)
Unlock your academic potential
Copyright © 2020–2026 A2Z Services. All Rights Reserved. Developed and managed by ZUCOL.