Data Handling and Business Intelligence Report: Excel & WEKA
VerifiedAdded on 2020/01/28
|20
|3848
|36
Report
AI Summary
This report delves into data handling and business intelligence, utilizing Microsoft Excel and WEKA software for analysis. It presents a case study of Audi dealership data, exploring the application of J48 algorithms and SimpleKmeans for decision-making. The report examines the reasons behind declining sales and profitability in a Superstore scenario, highlighting the impact of discounting strategies and pricing variations. Furthermore, it provides a comparative analysis of Excel and WEKA, outlining their respective advantages and disadvantages in data analysis. The report includes visual aids such as illustrations and decision trees to support the analysis and provides insights into modifying data levels and improving business strategies. It concludes by summarizing the findings and emphasizing the importance of effective data analysis for informed business decisions.

DATA HANDLING
AND BUSINESS
INTELLIGENCE
1
AND BUSINESS
INTELLIGENCE
1
Paraphrase This Document
Need a fresh take? Get an instant paraphrase of this document with our AI Paraphraser
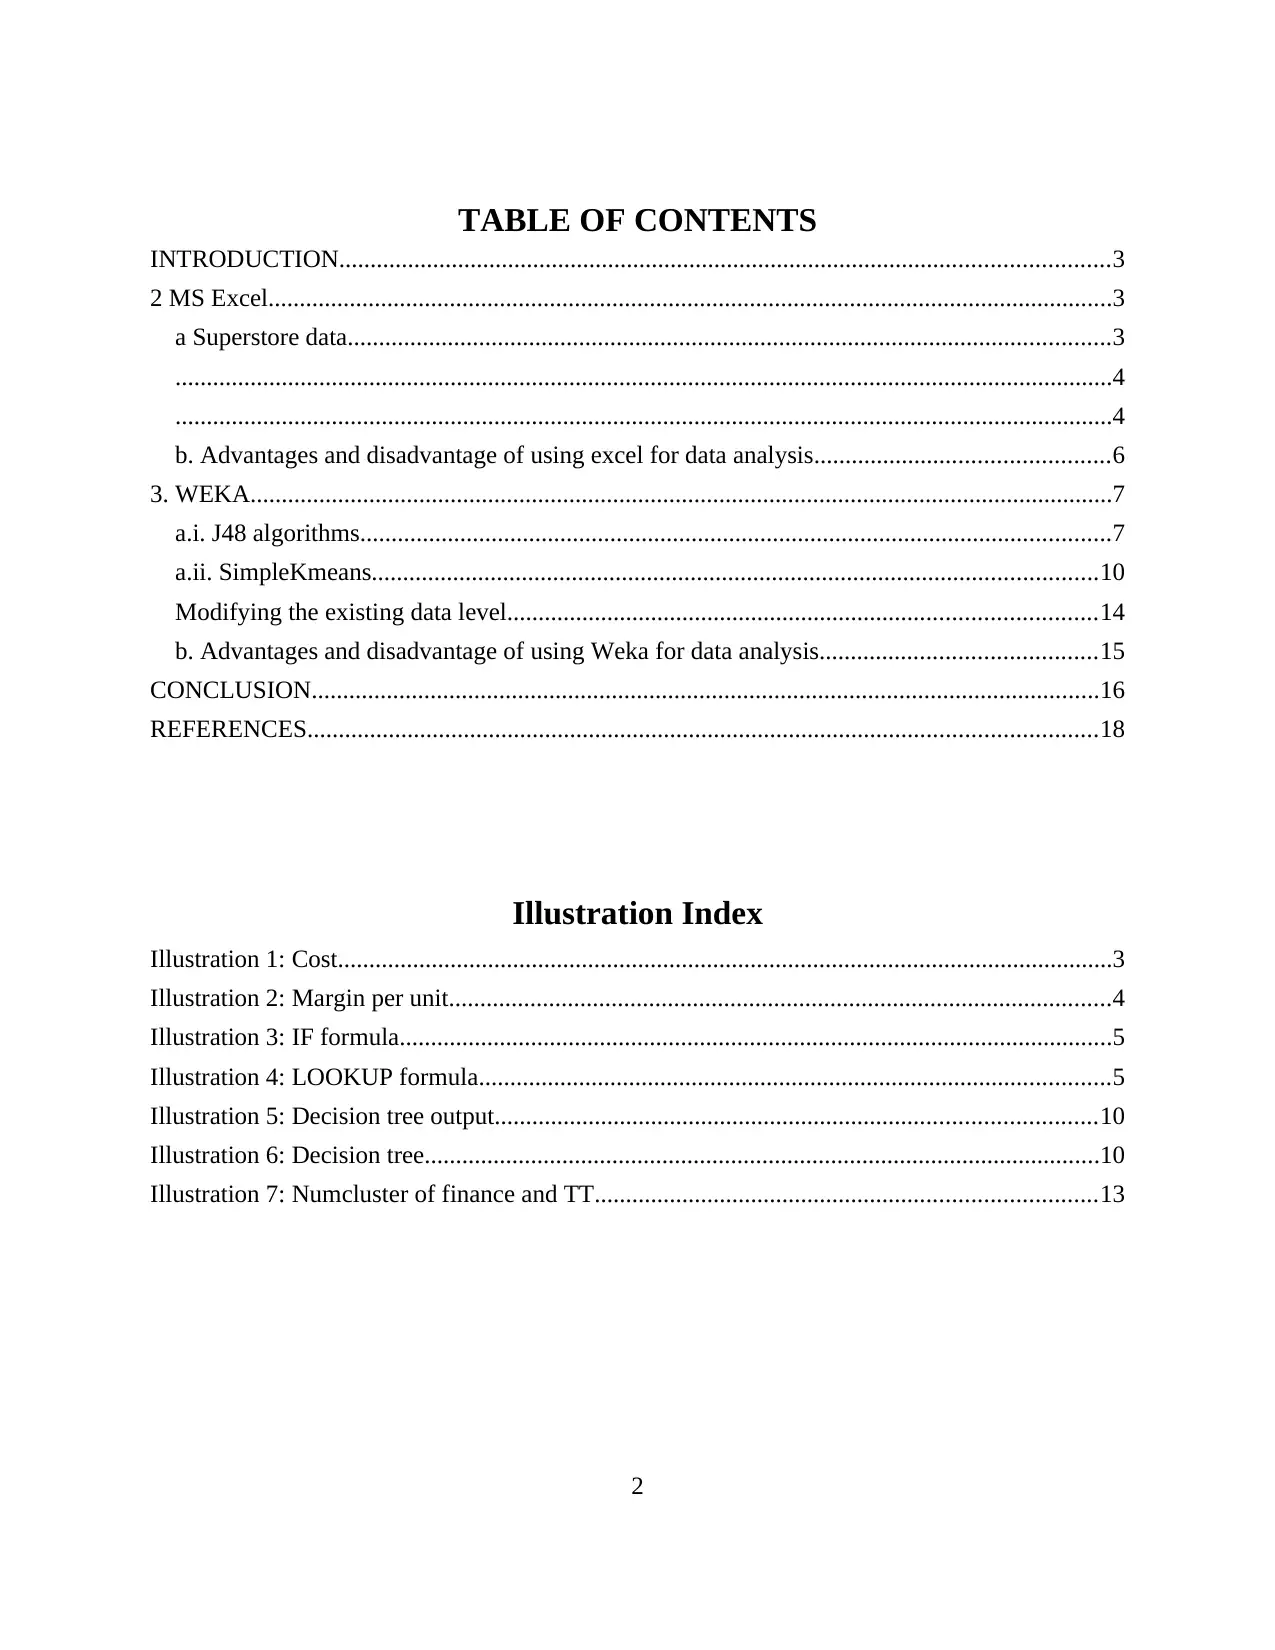
TABLE OF CONTENTS
INTRODUCTION...........................................................................................................................3
2 MS Excel.......................................................................................................................................3
a Superstore data..........................................................................................................................3
......................................................................................................................................................4
......................................................................................................................................................4
b. Advantages and disadvantage of using excel for data analysis...............................................6
3. WEKA..........................................................................................................................................7
a.i. J48 algorithms........................................................................................................................7
a.ii. SimpleKmeans....................................................................................................................10
Modifying the existing data level..............................................................................................14
b. Advantages and disadvantage of using Weka for data analysis............................................15
CONCLUSION..............................................................................................................................16
REFERENCES..............................................................................................................................18
Illustration Index
Illustration 1: Cost............................................................................................................................3
Illustration 2: Margin per unit..........................................................................................................4
Illustration 3: IF formula..................................................................................................................5
Illustration 4: LOOKUP formula.....................................................................................................5
Illustration 5: Decision tree output................................................................................................10
Illustration 6: Decision tree............................................................................................................10
Illustration 7: Numcluster of finance and TT................................................................................13
2
INTRODUCTION
Data handling is the most important task under which business organize all information
and interpret the same for the purpose of extracting valid outcome. Business intelligence is
another important aspect under which company shed light upon collecting valid data and
drawing valid outcome of the same. It is because collected data are analyzed in the light of aim
and objectives of business. Present report is based on case study of Audi dealership data under
which Weka software has been applied. It would be effective to apply suitable software and draw
valid outcome from the collected information. In addition to this, advantages and disadvantages
of Excel for data analysis has also been explained. Moreover, pros and cons and Weka are
explained stated clearly to meet research objectives. All these software are required for data
analysis as it is important to take appropriate decision regarding selection of suitable strategy to
improve business performance.
2 MS EXCEL
a Superstore data
Reasons for decreasing sales and profitability of Audi care
Illustration 1: Cost
3
⊘ This is a preview!⊘
Do you want full access?
Subscribe today to unlock all pages.
Trusted by 1+ million students worldwide
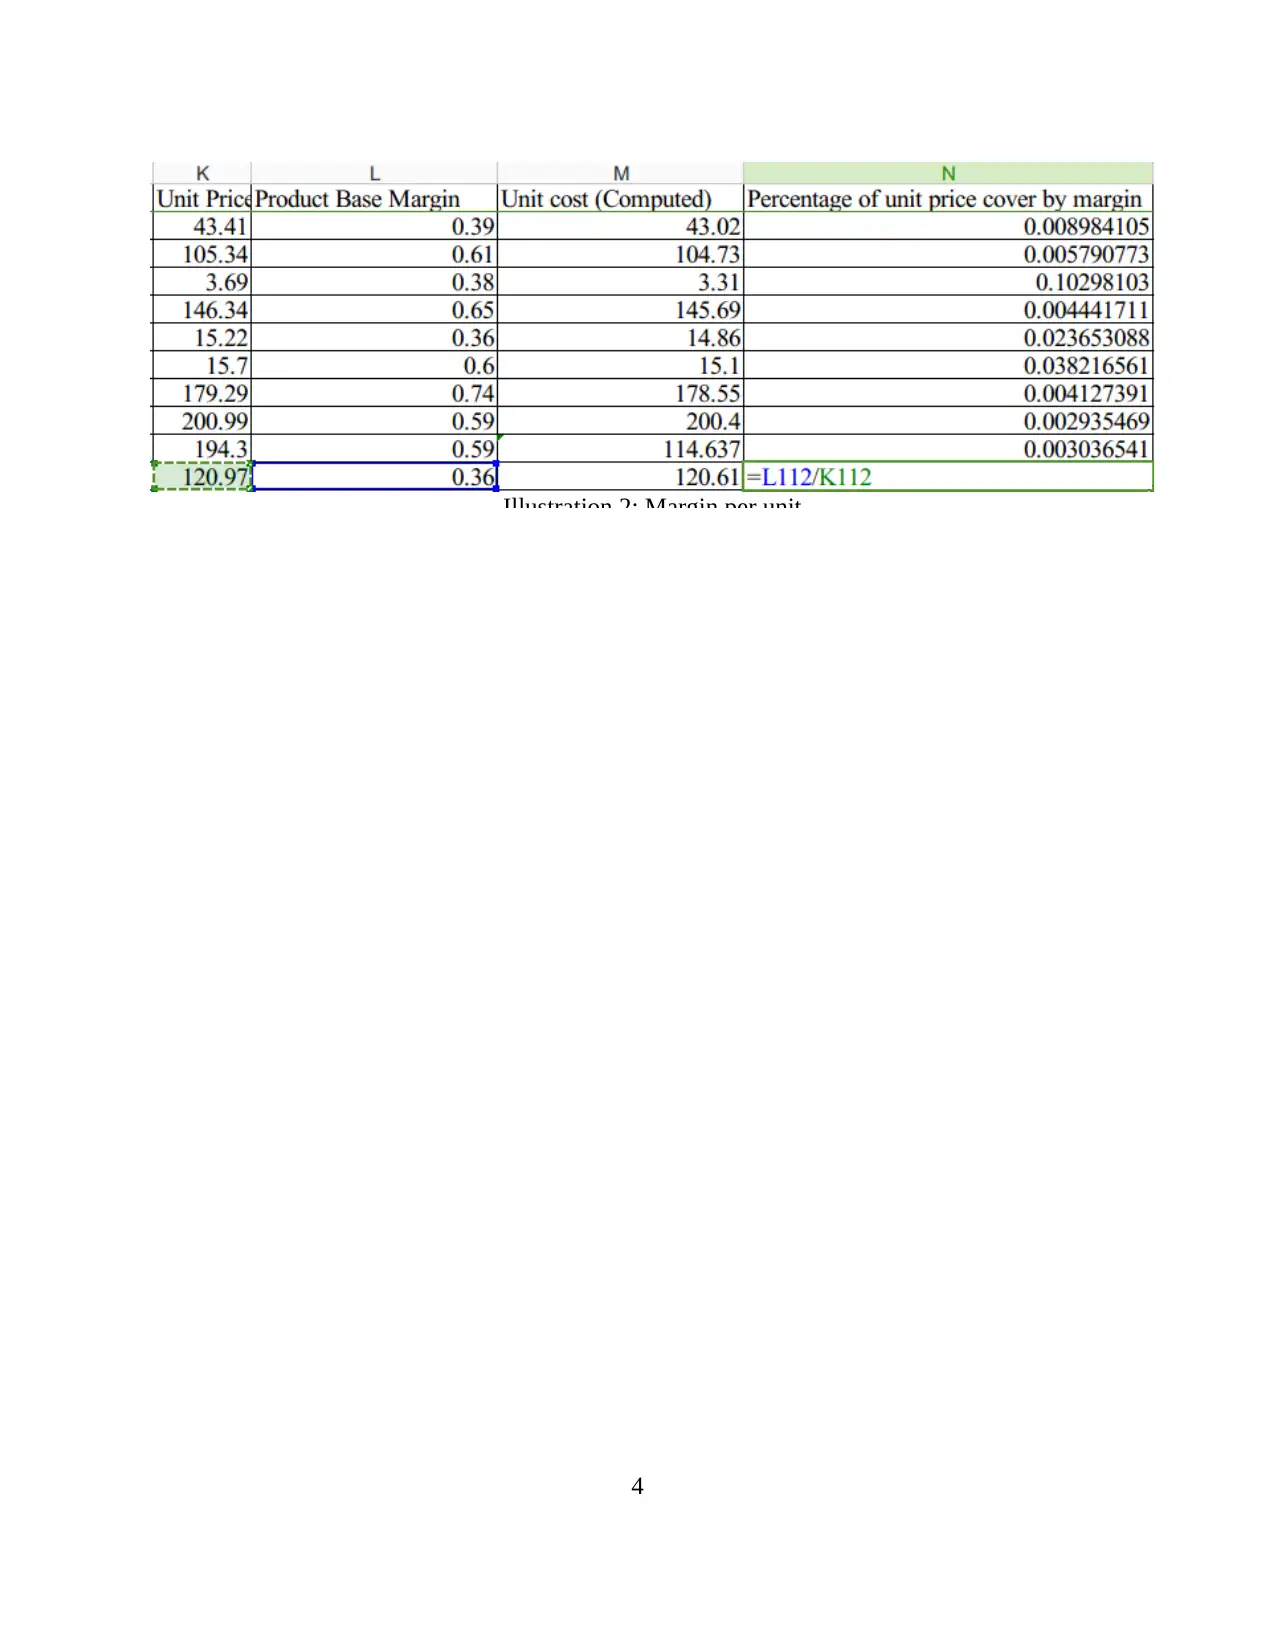
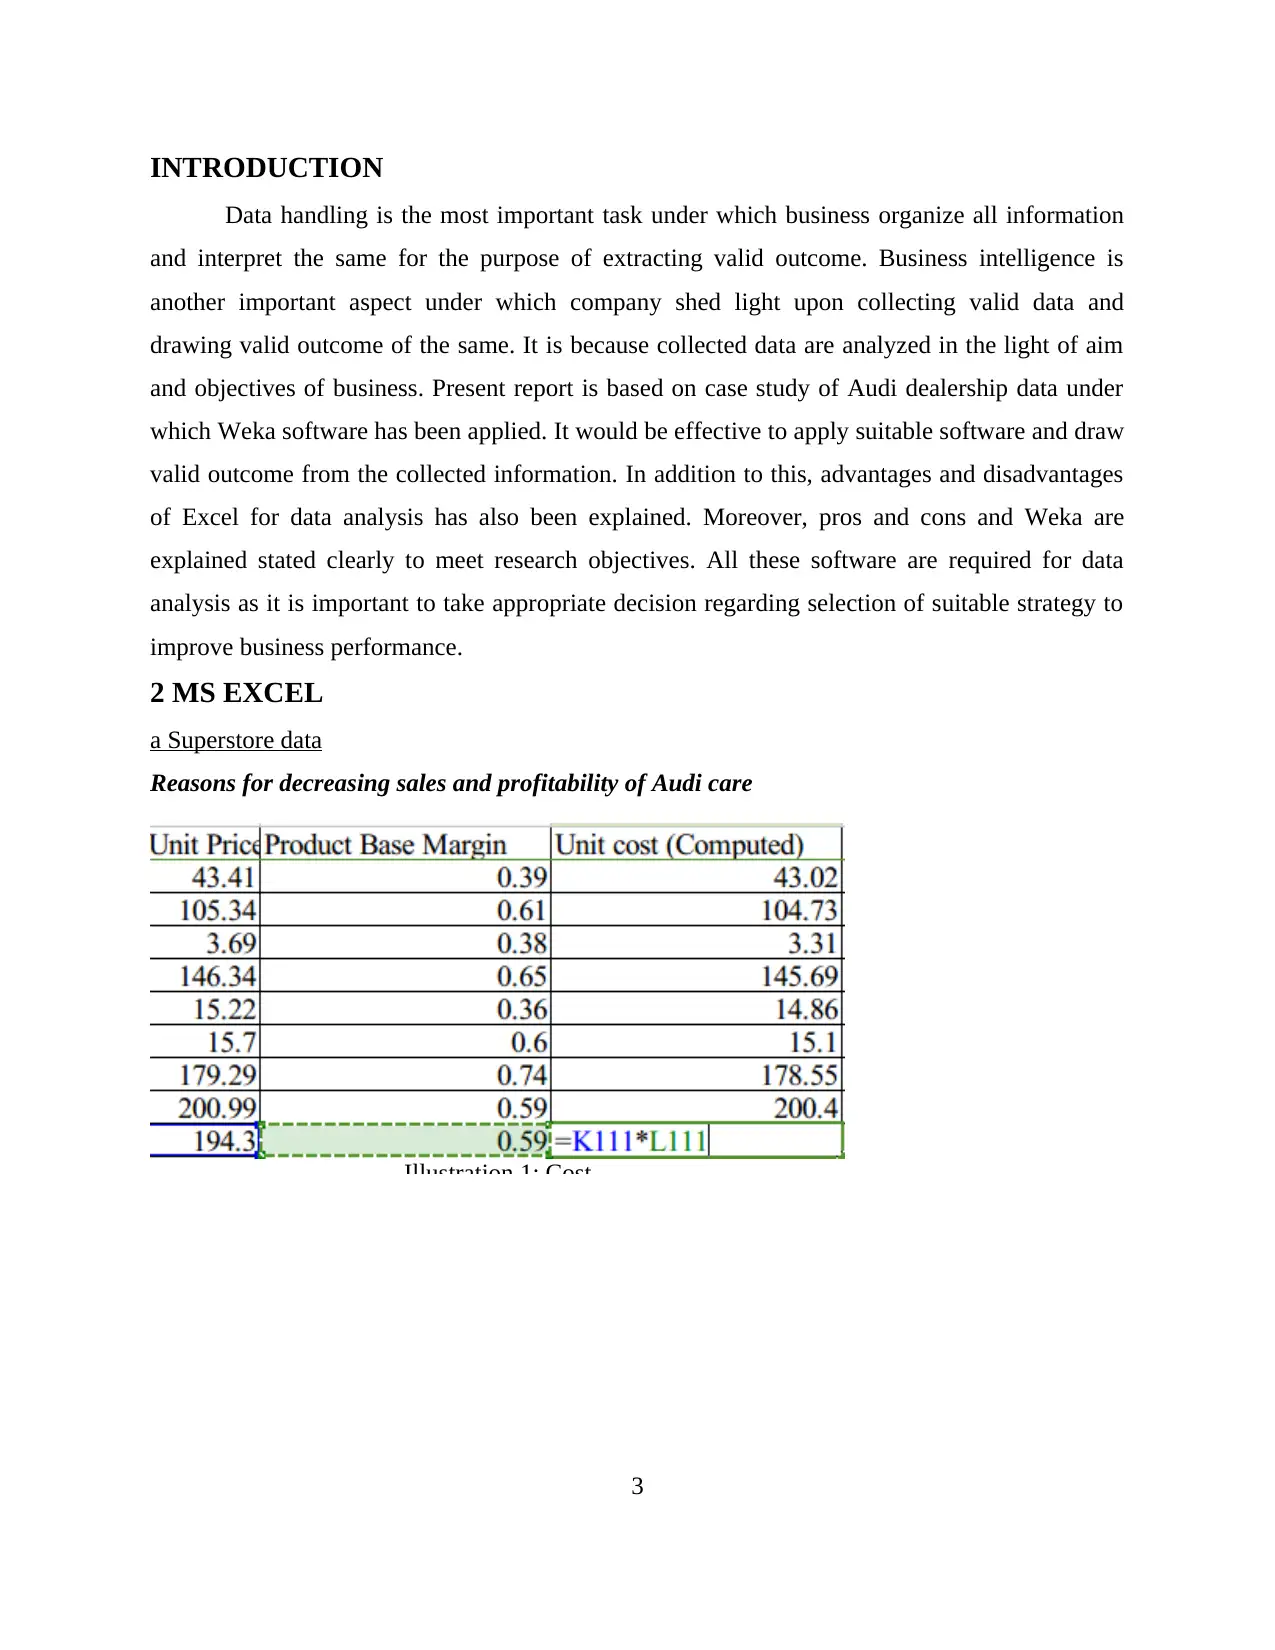
Illustration 2: Margin per unit
4
4
Paraphrase This Document
Need a fresh take? Get an instant paraphrase of this document with our AI Paraphraser
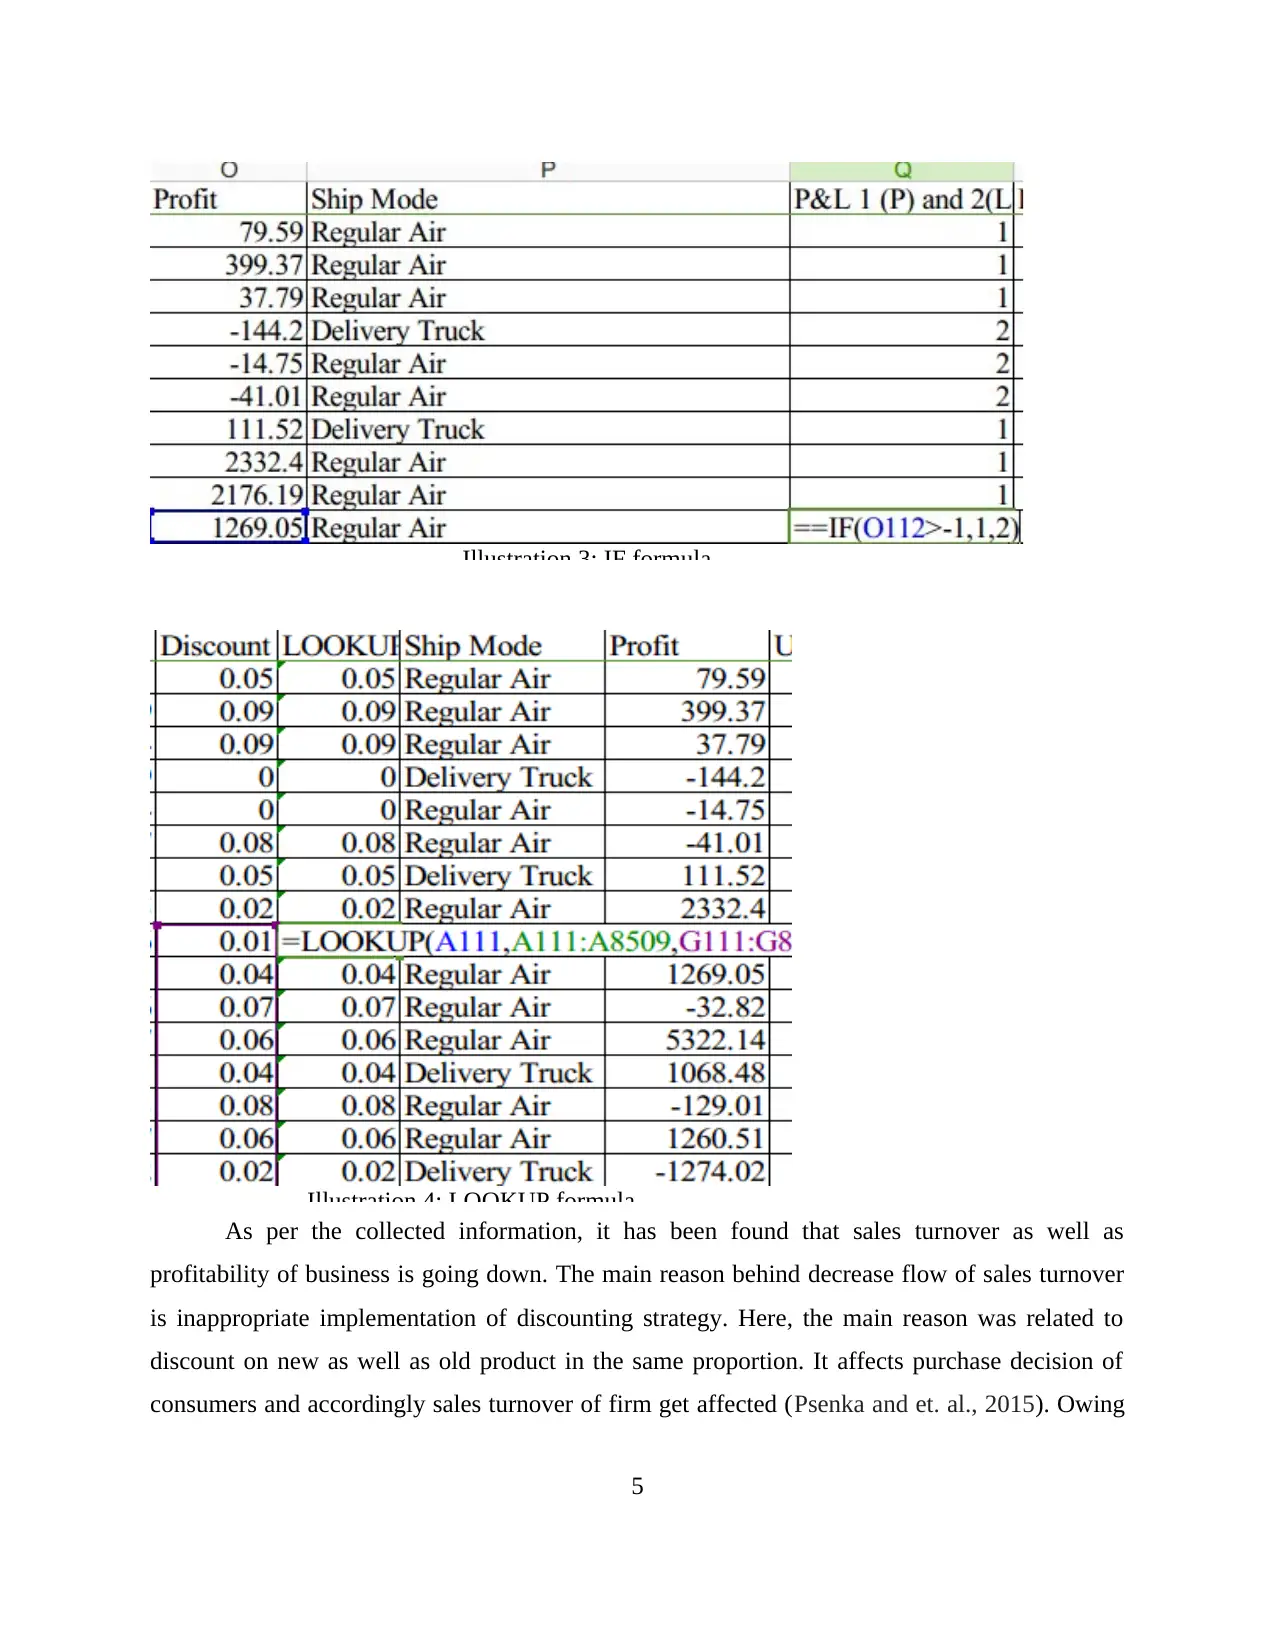
Illustration 3: IF formula
Illustration 4: LOOKUP formula
As per the collected information, it has been found that sales turnover as well as
profitability of business is going down. The main reason behind decrease flow of sales turnover
is inappropriate implementation of discounting strategy. Here, the main reason was related to
discount on new as well as old product in the same proportion. It affects purchase decision of
consumers and accordingly sales turnover of firm get affected (Psenka and et. al., 2015). Owing
5
to this, management of business focuses upon delivering good quality of services to large
number of buyers by offering them particular percentage of discount. It can be critically
evaluated that same proportion of discount on products offered by Superstore. However, some of
the products has very higher prices but discount but margin of profit is very low on the same. It
shows that company is selling its product on very higher prices but not generating significant
earning in the form of retained profit. It can directly affect flow of production and rate of return
of business also get affected (Kumar, 2014). Apart from this, some product are sold at very low
price but higher margin is earned on the same. It is showing that less valid impact of discount
strategies on varied products. Here, example of deliver truck can be taken which has profitability
of .59 but sales generated by the same is 5472. Similarly, another item with 2484 ID number has
profitability of .77 whereas sales price of same items is 1810.
Thus, it can be analyzed that all products which are sold at lower price tend to generate
higher margin or rate of return. It can be critically evaluated that Superstore does not have
appropriate strategy related to pricing and discount. It is the main reason behind varying margin
on different products and services for a business. This shows that management or respective
department of Superstore must shed light on discount strategy, price and profit margin for
bringing appropriate balance and catering requirement of different parties. In this manner, two
factors are discovered such as discount and variation of sales and profitability. It reflects that
strategies related to discount and pricing should be changed so as to meet the long a well as short
term objectives of Superstore (Lausen, Seidel and Ultsch, 2010). It aids to increase overall rate of
return and deliver good quality of services to large number of buyers. Moreover, management
should lay emphasis of maintaining difference between margin of profit and sales turnover.
In addition to this, the main issue is related to identical discount on varied price of
products and services. It assists management to change pricing strategies for meeting
expectations of stakeholders. Here, product with row ID 103 has value worth 2781 whereas
discount on related product was .07. On the contrary, items of row ID 107 has quoted price worth
228 along with discount value of .07. Here, it can be seen that both products has significant
difference of price but discount offered on them is exact matched. At this juncture, possible
solution can be applied for taking corrective step which tend to determine success operation of
business in the marketplace (Işık, Jones and Sidorova, 2013). It can be critically evaluated that
6
⊘ This is a preview!⊘
Do you want full access?
Subscribe today to unlock all pages.
Trusted by 1+ million students worldwide
all products offered by Superstore are different from each other which must not be discounted on
the same percentage as it would decrease overall rate of return in the marketplace. Though, sales
value of all products are also difference which cannot be offered on same kind of strategy
adopted by corp;oration. It is the main reason behind low rate of return and poor sales turnover
of business.
So, the basic focus can be laid on amendments in discount strategy through which firm
can easily recover its cost of production and retain buyers for longer time span. However, some
product which has low sales price and even when they are offered at discount then rate of return
will be decreased to a great extent. For this purpose, it becomes necessary to modify discount
strategy for products with higher price and those with lower price. Apart from this, performance
of Superstore can be managed by updating current strategies time to time (Vossen, 2014). It
facilitates to allocate all resources on different activities effectively and meet the objectives of
business in an effective manner. Therefore, skilled and competent workforce should be assigned
to complete the task related to setting appropriate discount strategy.
b. Advantages and disadvantage of using excel for data analysis
Excel is considered as the most important aspect or manual technique to calculate figures
related to profit and loss as well as cost of the business. Under this, different kind of data are
processed and presented in an effectual manner. By using excel manual calculation can be done
easily. Furthermore, advantages of using excel are explained as follows- Ease to create data collection tools-There are several tools for creating and collecting
data under excel sheet. Here, management of Superstore can cut and paste all information
in sheet in order to draw valid outcome (Shmueli, Patel and Bruce, 2016). It is because
researcher does not require to learn any new language as excel can be operated with
simple and normal aspects. Apart from this, some specific data set make it possible to
form the locked fields and restrict entry of new data. It enables companies to analyze
collected data in a most effective manner. Easy form of charts-Excel is considered as the most effective tool for the purpose of
creating charts and presenting valid outcome to reach at the aim of the business. Here,
different kind of functions are used such as “IF”, PIVOT table and LOOKUP. These all
7
Paraphrase This Document
Need a fresh take? Get an instant paraphrase of this document with our AI Paraphraser
functions can be used for analysis of collected data and representation of the same for
accomplishing set aim and objectives of business (Laverty, 2016). Templates can be used to aggregate data-Here, pre-defined data can be copied in excel
sheet and then rest of the calculation can be done for the purpose of accomplishing the
aim of the business. It would be effective to apply formulas to extract valid outcome so as
to analyze the collected data in an effectual manner (Demirkan and Delen, 2013).
Cons of using excel sheet
There are several benefits associated with excel sheet but some disadvantage are also
there which must be focused by business. Although, cons can be removed by taking corrective
steps on right time. At the same time, equal focus can be laid on management side for taking care
of below listed aspects. It covers follow listed cons- Typical learning curve-Learning curve of excel sheet remain less flexible because it
cannot be understood by anybody easily. However, all calculation can be done easily but
interpretation of the same need strong knowledge of the same field among individual
doing it. Calculation error-Normally excel bring-forth valid outcome on the basis of entered data
and input. It can be critically evaluated that human error or wrong data entry affect entire
output of the data series. However, manual errors can be detected and the same create
issue for entire business to a great extent (Katal, Wazid and Goudar, 2013). For example
if data of two years are entered wrong then in the same manner overall output of study
will be wrong. Thus, manual errors can be controlled and affect the output of study to a
great extent. Time consuming-Generally data entry task in excel is manual which takes extensive time
of researcher. It affect overall procedure of data analysis and completion of data
collection procedure. However, delay in data analysis procedure affect overall
performance of business to a great extent. For example manual enter data related to sales
and profit tend to consume extensive time and accordingly this procedure delay the
marketing and other related activities of business (Rausch, Sheta and Ayesh, 2013).
Cost of entry-The cost of data entry can be either low or no cost alternatives. This tends
to have direct impact on cost structure of business. Owing to this, business can focus
8
upon reducing cost of production and applying suitable strategy to increase performance
of business in the marketplace.
Large set of data cannot be managed in excel as it generally contain approximate 3000-
4000 rows.
3. WEKA
a. Audi dealership data
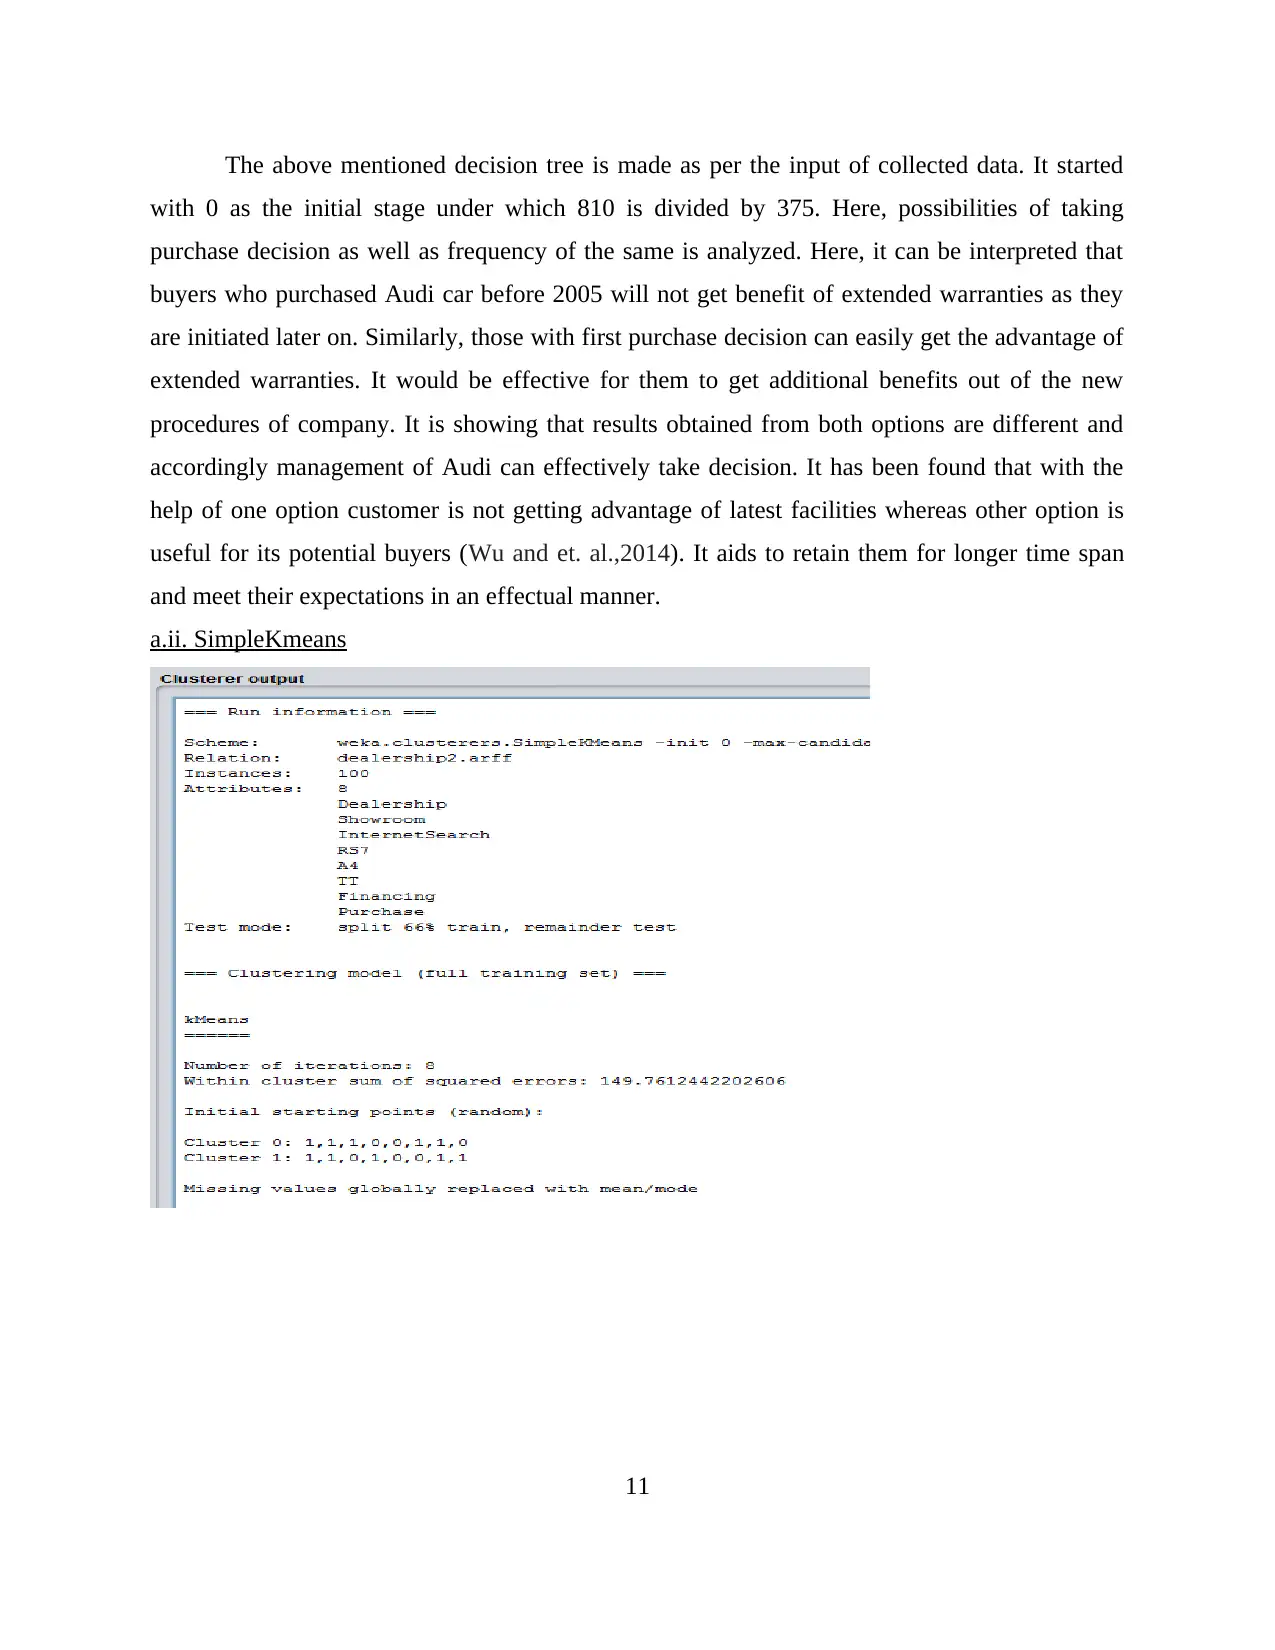
a.i. J48 algorithms
Generally specific algorithms is used in order to represent the data and value for taking
appropriate decision in context of business. With the help of algorithms overall process is
applied for understanding level of individual in order to accomplish the purpose of Audi
dealership. It is because collected data are analyzed for drawing valid outcome. Here, J48
algorithms applied for anticipation of reason behind low sales turnover of business. Here,
company can shed light upon target variables whereby appropriate outcome can be extracted so
as to meet the objectives of business in an effectual manner. Apart from this, decision tree is
used to represent the predicted information (Vera-Baquero, Colomo-Palacios and Molloy,
2013). At this juncture, collected data are processed and then analyzed in the light of aim and
objectives of company. Moreover, decision tree is prepared in accordance with collected and
analyzed data. Here, a person using or applying this particular software will significant updation
in existing knowledge.
9
of business in the marketplace.
Large set of data cannot be managed in excel as it generally contain approximate 3000-
4000 rows.
3. WEKA
a. Audi dealership data
a.i. J48 algorithms
Generally specific algorithms is used in order to represent the data and value for taking
appropriate decision in context of business. With the help of algorithms overall process is
applied for understanding level of individual in order to accomplish the purpose of Audi
dealership. It is because collected data are analyzed for drawing valid outcome. Here, J48
algorithms applied for anticipation of reason behind low sales turnover of business. Here,
company can shed light upon target variables whereby appropriate outcome can be extracted so
as to meet the objectives of business in an effectual manner. Apart from this, decision tree is
used to represent the predicted information (Vera-Baquero, Colomo-Palacios and Molloy,
2013). At this juncture, collected data are processed and then analyzed in the light of aim and
objectives of company. Moreover, decision tree is prepared in accordance with collected and
analyzed data. Here, a person using or applying this particular software will significant updation
in existing knowledge.
9
⊘ This is a preview!⊘
Do you want full access?
Subscribe today to unlock all pages.
Trusted by 1+ million students worldwide
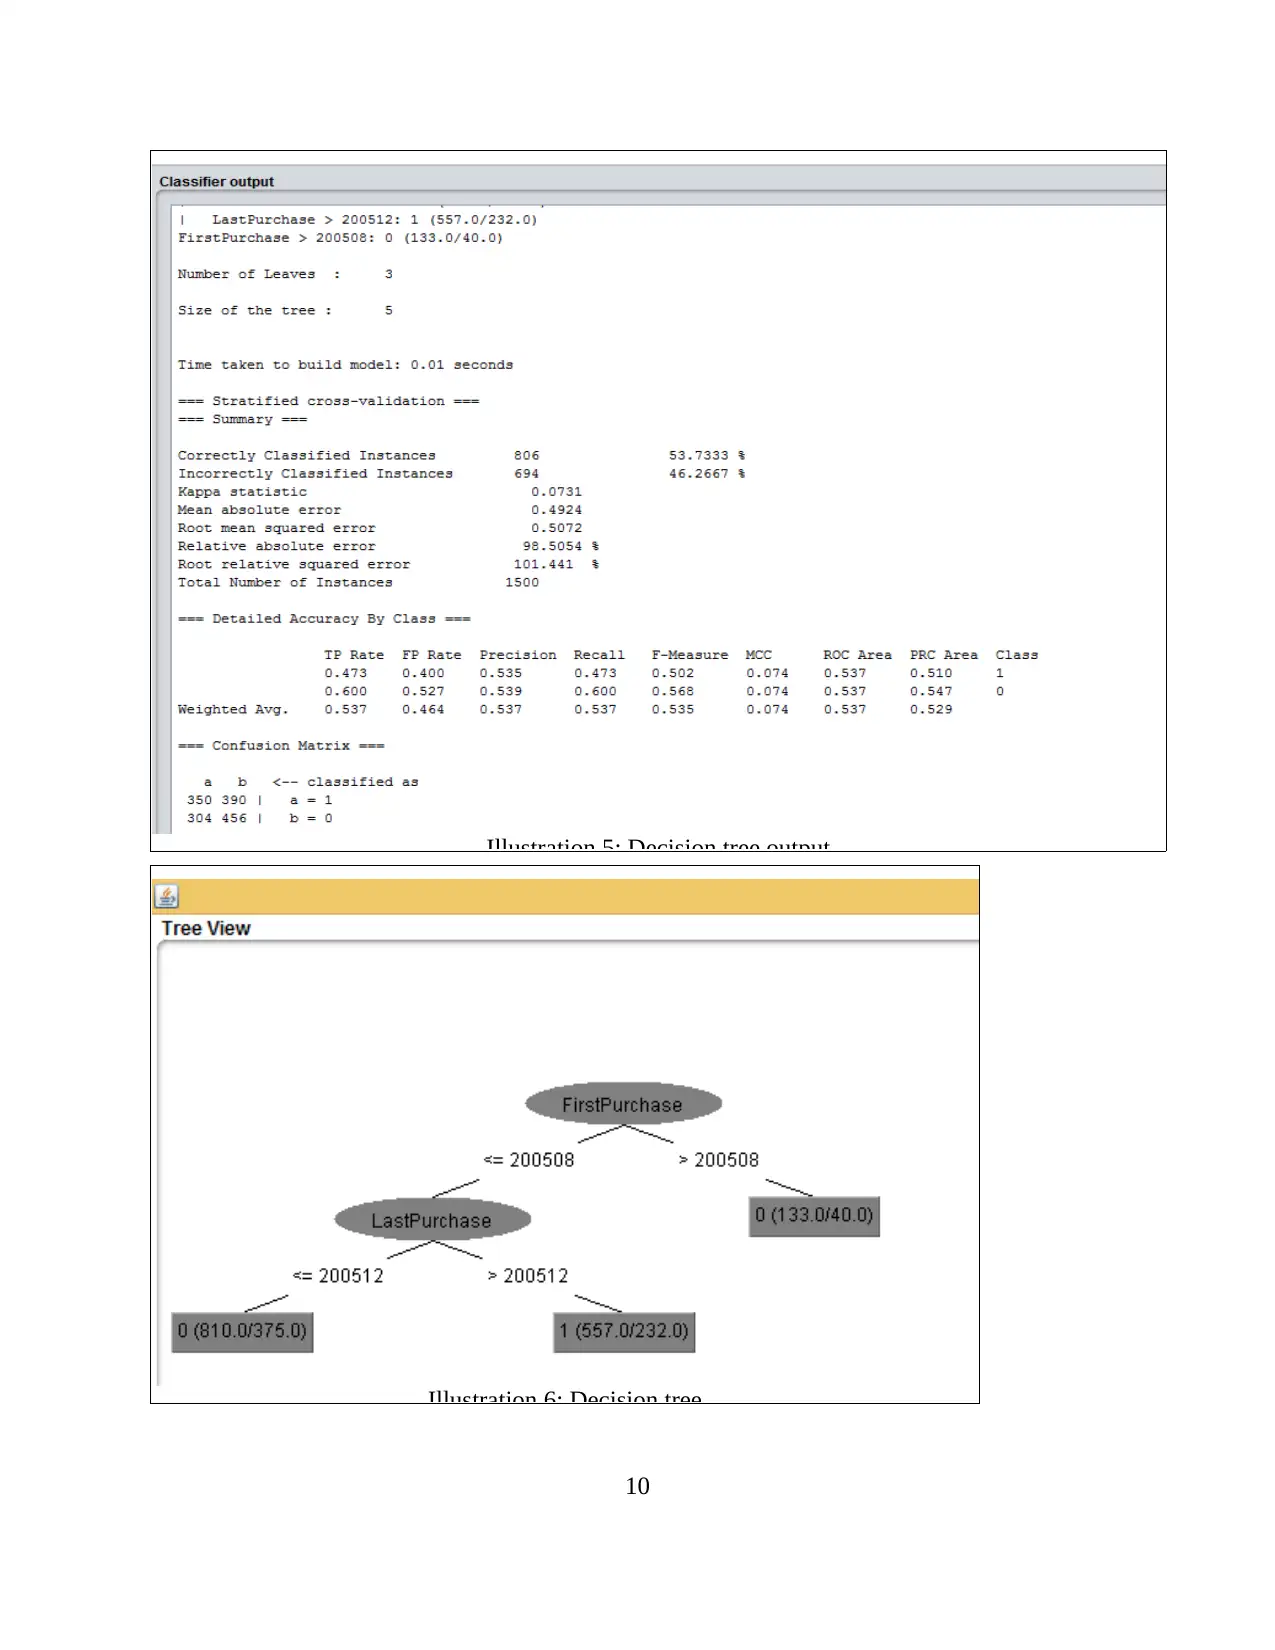
Illustration 5: Decision tree output
Illustration 6: Decision tree
10
Illustration 6: Decision tree
10
Paraphrase This Document
Need a fresh take? Get an instant paraphrase of this document with our AI Paraphraser
The above mentioned decision tree is made as per the input of collected data. It started
with 0 as the initial stage under which 810 is divided by 375. Here, possibilities of taking
purchase decision as well as frequency of the same is analyzed. Here, it can be interpreted that
buyers who purchased Audi car before 2005 will not get benefit of extended warranties as they
are initiated later on. Similarly, those with first purchase decision can easily get the advantage of
extended warranties. It would be effective for them to get additional benefits out of the new
procedures of company. It is showing that results obtained from both options are different and
accordingly management of Audi can effectively take decision. It has been found that with the
help of one option customer is not getting advantage of latest facilities whereas other option is
useful for its potential buyers (Wu and et. al.,2014). It aids to retain them for longer time span
and meet their expectations in an effectual manner.
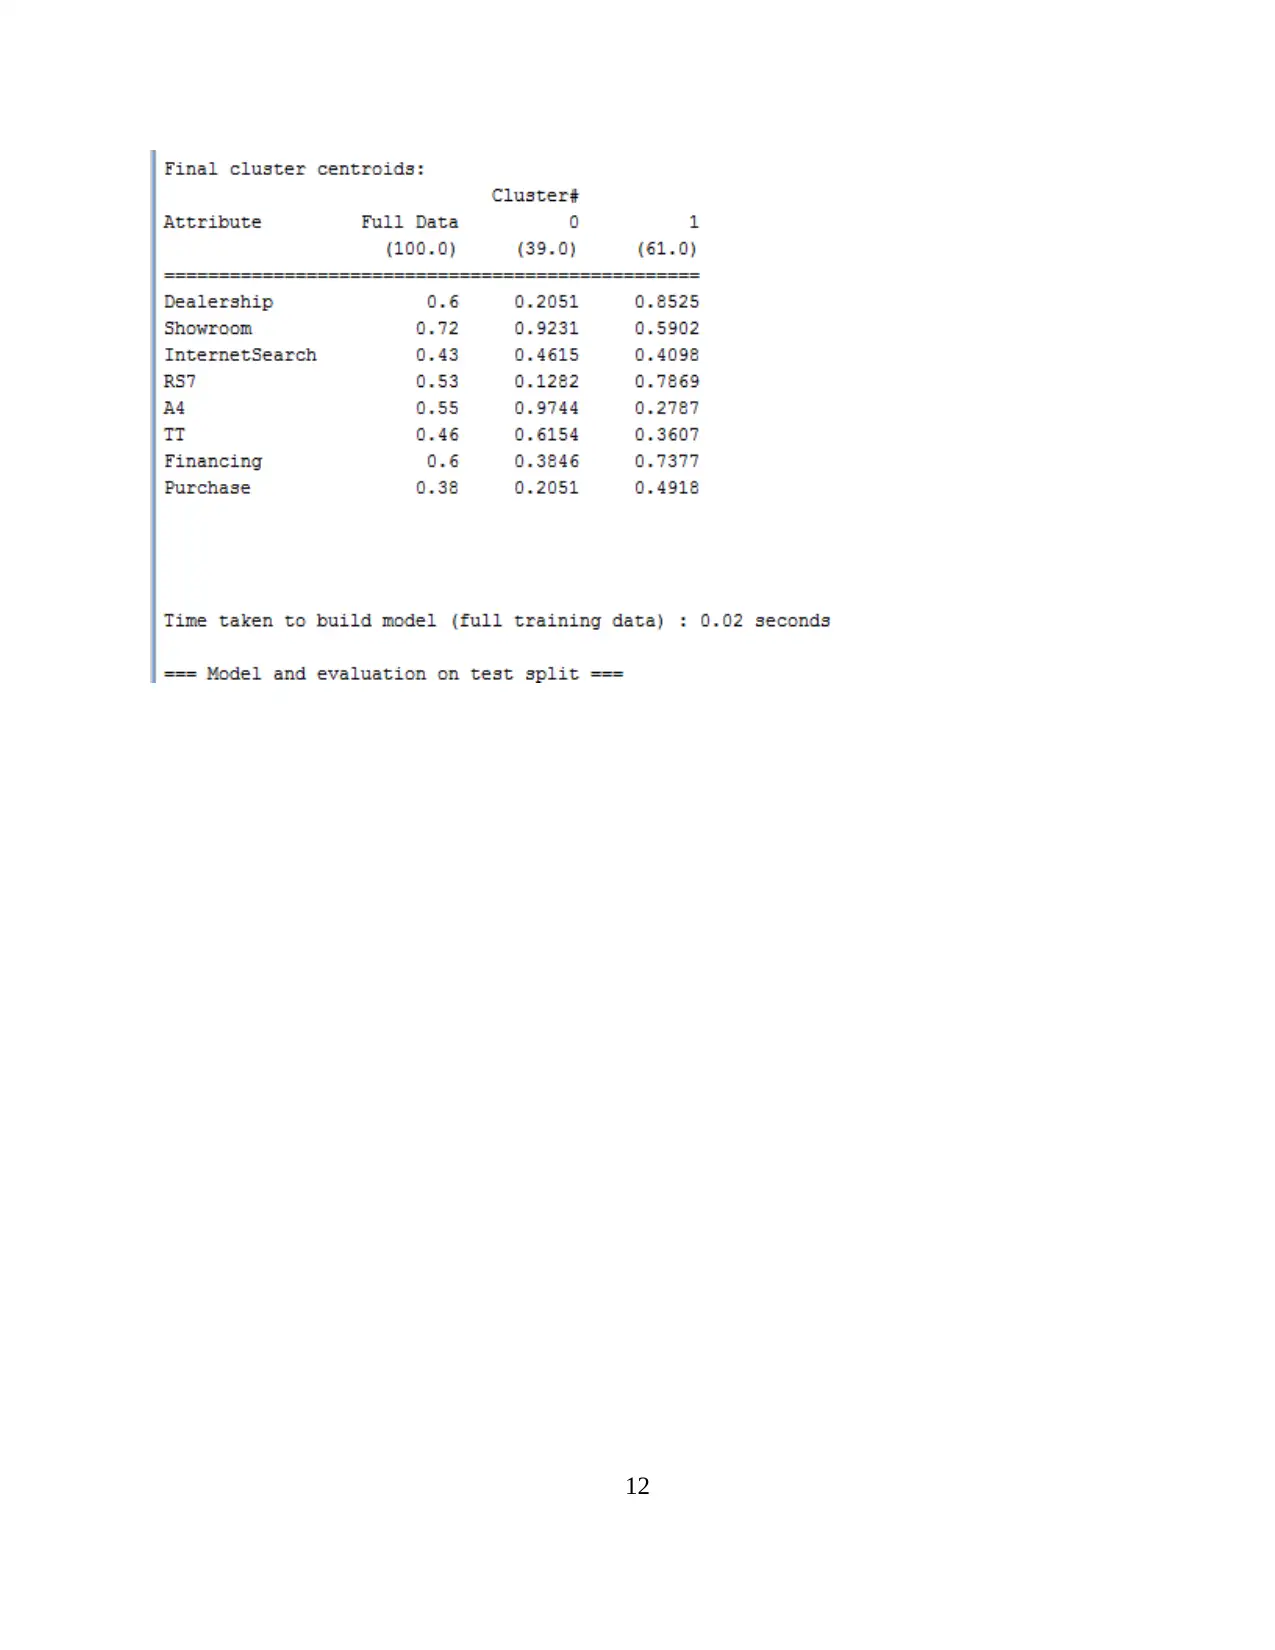
a.ii. SimpleKmeans
11
with 0 as the initial stage under which 810 is divided by 375. Here, possibilities of taking
purchase decision as well as frequency of the same is analyzed. Here, it can be interpreted that
buyers who purchased Audi car before 2005 will not get benefit of extended warranties as they
are initiated later on. Similarly, those with first purchase decision can easily get the advantage of
extended warranties. It would be effective for them to get additional benefits out of the new
procedures of company. It is showing that results obtained from both options are different and
accordingly management of Audi can effectively take decision. It has been found that with the
help of one option customer is not getting advantage of latest facilities whereas other option is
useful for its potential buyers (Wu and et. al.,2014). It aids to retain them for longer time span
and meet their expectations in an effectual manner.
a.ii. SimpleKmeans
11
12
⊘ This is a preview!⊘
Do you want full access?
Subscribe today to unlock all pages.
Trusted by 1+ million students worldwide
1 out of 20
Related Documents


Your All-in-One AI-Powered Toolkit for Academic Success.
+13062052269
info@desklib.com
Available 24*7 on WhatsApp / Email
![[object Object]](/_next/static/media/star-bottom.7253800d.svg)
Unlock your academic potential
Copyright © 2020–2026 A2Z Services. All Rights Reserved. Developed and managed by ZUCOL.