Comprehensive Data Handling and Business Intelligence Project Report
VerifiedAdded on 2023/01/03
|14
|3401
|74
Project
AI Summary
This project explores data handling and business intelligence, focusing on the practical application of these concepts. The assignment begins with an overview of information management and its role in converting data into actionable knowledge. It then delves into the use of various Excel formulas, including conditional formatting, IF functions, and lookup functions, with explanations and screenshots. The project continues with an analysis of a nutrition.csv dataset using SPSS, including descriptive statistics, ANOVA tests, correlation tests, and one-sample t-tests. The project also covers data mining methods and the advantages and disadvantages of SPSS, providing a comprehensive understanding of data analysis techniques and tools. The project concludes with a discussion of the findings and conclusions drawn from the analyses.

DATA HANDLING AND BUSINESS INTELLIGENCE
Paraphrase This Document
Need a fresh take? Get an instant paraphrase of this document with our AI Paraphraser
Contents
INTRODUCTION...........................................................................................................................3
MAIN BODY..................................................................................................................................3
Part 1............................................................................................................................................3
Uses of different excel formulas..................................................................................................3
PART 2............................................................................................................................................7
1. Using the nutrition.csv provided the workings with screenshots and explanation of results
are shown below:.........................................................................................................................7
2. Data mining methods.............................................................................................................11
3. Advantages and Disadvantages of SPSS...............................................................................12
CONCLUSION..............................................................................................................................13
REFERENCES..............................................................................................................................14
INTRODUCTION
The data gathering fields in which activities are carried out using an enterprise architecture
wherein their expertise is by far the most important asset to an organisation are information
transportation and marketing analysis (Psenka, Booty and Duncan, 2015). The study is focused
on two different tasks that provide comprehensive details about the usage of various forms of
Excel functions during the first phase. Various types of analysis techniques are listed in the next
part of the article, together with some SPSS roles in the scope including its set of data.
MAIN BODY
Part 1
Uses of different excel formulas
The process of collecting, storing, analyzing and reporting useful and collected knowledge in a
manner that is very effective for the consumer is known as information management. Relation to
market (BI) greatly increases products and technologies to convert data into functional
knowledge that informs the rational decision of an organisation. In papers, overviews, analysis
methods, charts, updated schedule, display and evaluate business process databases and report
analytical results that can provide customers with more activities and improve on the state of the
business (Vossen, 2014).
Firms can be defined for clients, management consultants, home supervisors, data collection,
daily performance tracking, such as Excel Databases software. Excel Spreadsheet is included in
the higher upfront.
SAVE DATA EVALUATION- Indeed, Google Spreadsheets is a great way to evaluate the
system and manipulate the information. Information can be written in various rows or columns
of document. Collected data is assisted by charts and graphs. The data gleaned for measuring
reliability was regarded as the long ranges of the error function owing to the intrinsic errors, as
well as its test process. Criteria are used for computer appraisal and even for measuring items.
The code is inspected and reviewed by the external auditors in this stage, relating to the series of
process parameter depending on the data types that are considered to be quality measures. In
other words, there seems to be an expectation that these structures can lead to product quality.
⊘ This is a preview!⊘
Do you want full access?
Subscribe today to unlock all pages.
Trusted by 1+ million students worldwide
These processes, driven by structured performance requirements, are more representative of the
different forms of quality control, like self-assessment and even regular site teams. Information
is accessible from the Distributed from different papers and records. Code is recorded in order.
In order to truly enjoy the tests, it allows us to devote a lot of time. Using the Pie Chart,
information extraction doesn't really help it.
DATA RECOVERY- This can be accessed from the app by users before the fraud is detected.
Data is collected from the MS Excel programme from the DATA sheet. The conditions of same
losing data used by software web applications to produce the replacement and also the
description of the reconstruction goal, the restoring reconstruction method. Some laptop and
notebook recovery software devices, for instance, allow customers to directly retrieve missing
data, but retrieving a deleted archive from a database backup is a much more critical issue facing
IT interference. Data retrieval methods can be used to restore files from a device that have not
been erroneously supported and deleted yet, but remain scattered on the hard disc (Grossmann
and Rinderle-Ma, 2015).
Formulating Analysis- The research paper can be published in MS Excel, as well as in MS Word
files or panel type. With Ms Excel, we can use the database to use this info. To conduct
concurrent system differentiation, MS Excel can be used. MS Excel ultimately tracks
organisations, but it also allows workers to record the performance reviews on a steady basis.
Through the use of graphs, diagrams, strategies and predictions, teachers will support students.
The usual effort to reach degrees of achievement in the past, but success also allows us to
achieve our future research. Growing understanding. Why did we waste a lot of years living that
way? The method relates to dealing with the issue of what is or really is. Via neural networks
and current data, users create opportunities for the future. Per this post, the planning and
development is carried out by associations. Since then, it has seemed to be the global benchmark
for quality, adding all kinds of functionalities. As such, several essential, excellent formulations
are available to help all kinds of clients. There are almost infinite amounts of useful International
ergonomics and also events. The program can be used for many kinds of uses, including such
budgeting, data handling, maps and graph development, and so many more. There had been
equations that could support particular cases then again. It will concentrate on the option of
Paraphrase This Document
Need a fresh take? Get an instant paraphrase of this document with our AI Paraphraser
excellent Excel formulas that could be implemented in virtually any situation. They will assist
with the server's efficiency and make it even easier to handle it.
CONDITIONAL FORMATTING- It is possible to list all associated individuals under the
conditional class. Other instances of a conditional template may also exist. This also applies to
awareness of reproduction meanings and recognition. Eventually Determine (CF) is a method
involving the formatting of an object or a sequence of rows and the adjustment of the
performance evaluation or formula meaning to the requirement tax. For instance, if the cell's
sense is higher than 100. The template you choose is added to the cell if the cell output exceeds
the format requirements (Kimble and Milolidakis, 2015). If network protection does not satisfy
the format requirements, the traditional configuration of the box is used.
Security- MS Excel offers robust system safety for sheets, allowing employees to monitor their
output easily. Using fundamental visual software, the three MS Excel reports were placed within
an excellent archive. They file the basic information in MS Distributed as well as hold the
organised data so that time is save. Everybody wants their documents to be secure, and MS Excel
is very good at solving this issue. Yet no one is capable of substituting or removing it.
IF Function
In Excel, in the IF function or IF statement, a 3-part time clause has been used. In this scenario, it
is easy to see what income and profit amounts are reduced or what time the purchaser's fee is,
and also how step by stage the IF function is applied.
For the first example, cut / paste the tax date, income and profit again on various websites.
Restructure old data into the first structure of the quality control claim.
• Use the 'IF Component' form. Form the sort code = if (type of virus: B2>C3),
If the client follows the criteria, proceed to insert a mobile key to be tested as well.
Constructive a semi colon: Choose "Increase"
• Remove the packet; and, if the criterion is not met, press Start.
If a feature emphasises the importance of B3, if the quality of B3 is higher than those of the
section of B3, the feature of B1 will imply that the parameters might be even more essential than
B3.' As this option can be seen, as they click the Enter button, customers would get the design of
cell B4. Shift the dealing from D4 to remote D8400 to see the impact.
If people need to know which H Lookup and V lookup will be in a process, they will not be
annoyed. Whether the consumers want it or not is an essential skill. When they deal with small
numbers, they will discuss this in depth.
Lookup Value: A line or base together with the query item. This is the base of the string,
actually.
Tables sequence: A fitting history diagram. It is difficult to pick what the client needs from their
table.
Row list amount: The required state is displayed in the row numbers. It will have to be the initial
row 1.
Lookup vary]: In the panel, two versions of the same set will be included, one correct (1) and one
inaccurate (1) (0).
Lookup value: A section or line region matches a query and recovers the same consistency by the
action of the normal section or line area through which LOOKUP supersedes such issues. Used
Cell G2, H2 and I2 in terms of time, payments or revenues required (Kasemsap, 2015). It
involves the delivery of G3, H3 and I3. Use the Caching keys as a G3 cell to connect the H3 cell
to a Lookup portion.
Series: Quality selection A2 to C8400 (A2:C8400) for both the entire data set
[Range search]: to bug the cores.
If a feature emphasises the importance of B3, if the quality of B3 is greater than those of the
section of B3, the function of B1 will imply that the parameters might be even more essential
than B3.' As this option can be seen, as they click the Enter button, customers would get the
design of cell B4. Shift the dealing from D4 to remote D8400 to see the impact.
Charts
Steps:
Select a cell for even a bar chart which will be made.
To claim clarity, select a line graph.
⊘ This is a preview!⊘
Do you want full access?
Subscribe today to unlock all pages.
Trusted by 1+ million students worldwide
01/01/2009
03/04/2009
04/07/2009
04/10/2009
04/01/2010
06/04/2010
07/07/2010
07/10/2010
07/01/2011
09/04/2011
10/07/2011
10/10/2011
10/01/2012
11/04/2012
12/07/2012
12/10/2012
-20000
0
20000
40000
60000
80000
100000
Sales
Profit
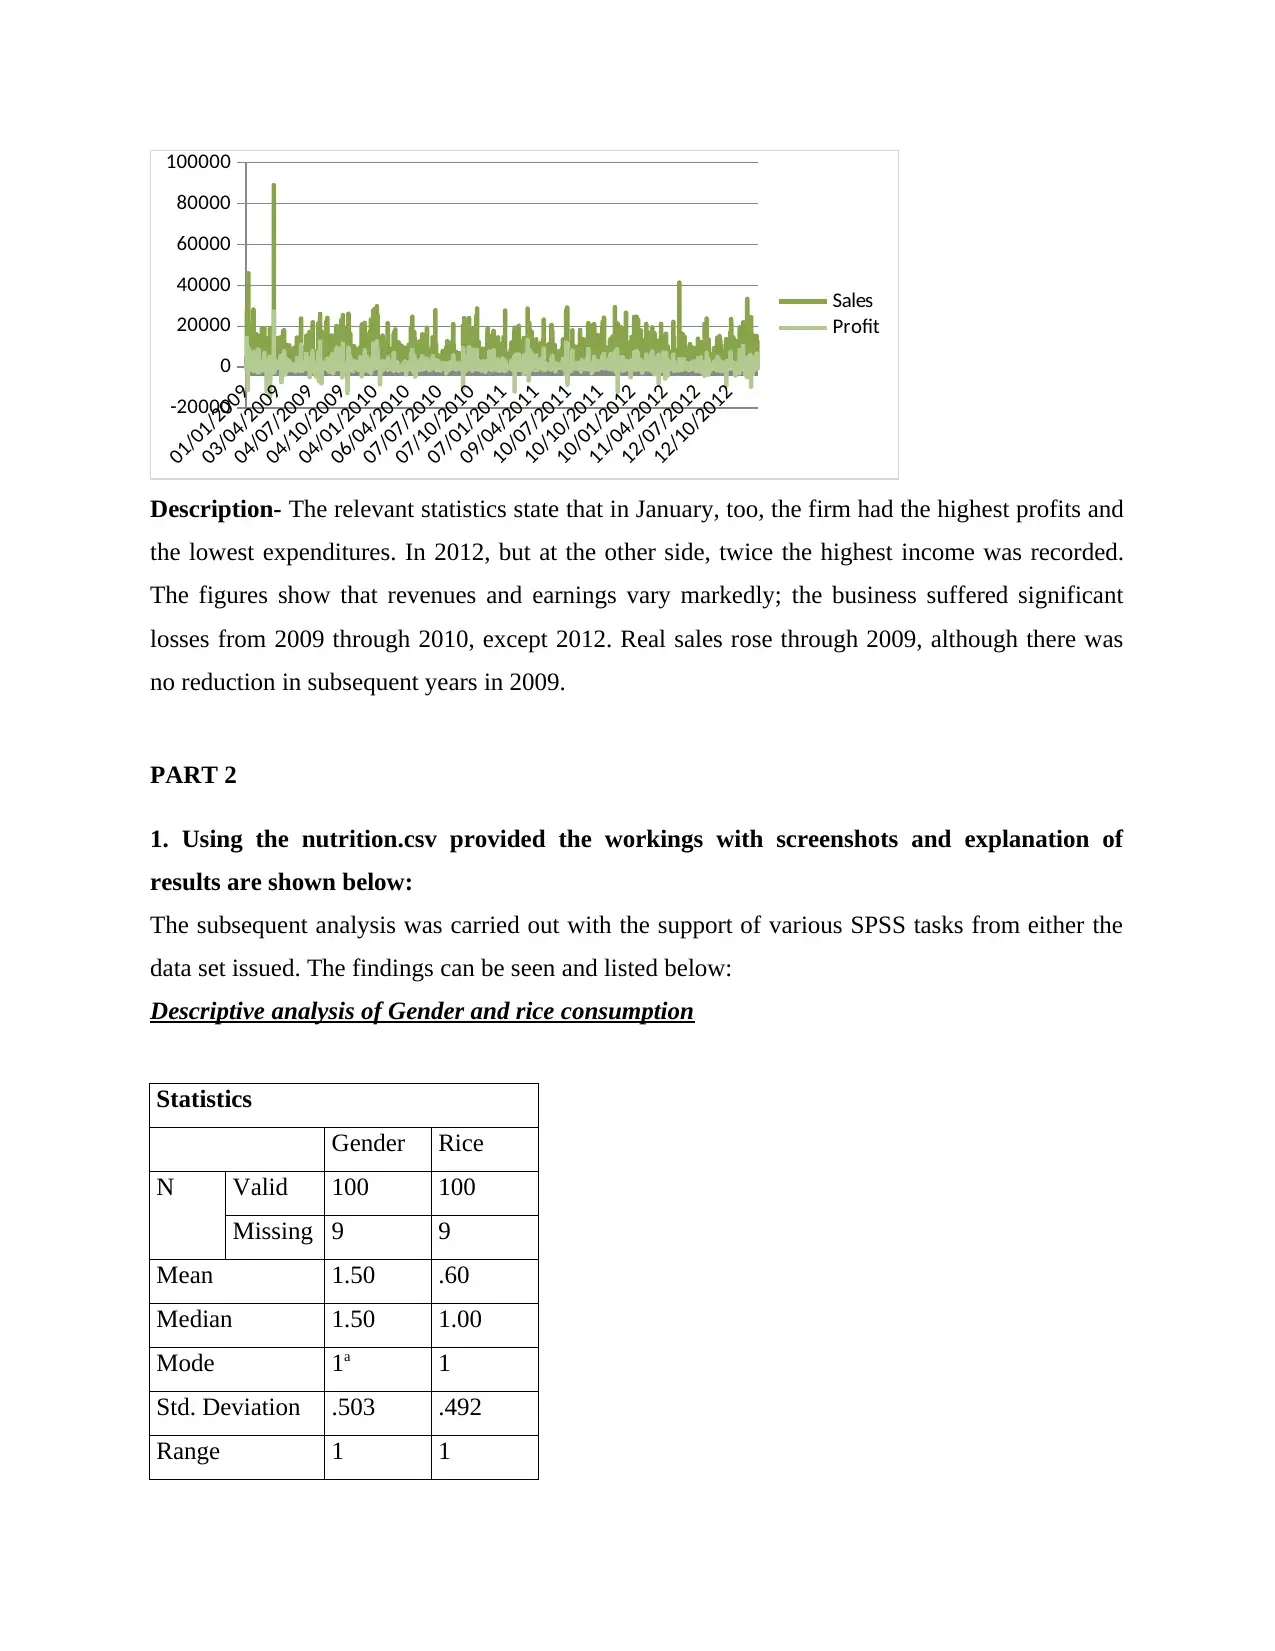
Description- The relevant statistics state that in January, too, the firm had the highest profits and
the lowest expenditures. In 2012, but at the other side, twice the highest income was recorded.
The figures show that revenues and earnings vary markedly; the business suffered significant
losses from 2009 through 2010, except 2012. Real sales rose through 2009, although there was
no reduction in subsequent years in 2009.
PART 2
1. Using the nutrition.csv provided the workings with screenshots and explanation of
results are shown below:
The subsequent analysis was carried out with the support of various SPSS tasks from either the
data set issued. The findings can be seen and listed below:
Descriptive analysis of Gender and rice consumption
Statistics
Gender Rice
N Valid 100 100
Missing 9 9
Mean 1.50 .60
Median 1.50 1.00
Mode 1a 1
Std. Deviation .503 .492
Range 1 1
03/04/2009
04/07/2009
04/10/2009
04/01/2010
06/04/2010
07/07/2010
07/10/2010
07/01/2011
09/04/2011
10/07/2011
10/10/2011
10/01/2012
11/04/2012
12/07/2012
12/10/2012
-20000
0
20000
40000
60000
80000
100000
Sales
Profit
Description- The relevant statistics state that in January, too, the firm had the highest profits and
the lowest expenditures. In 2012, but at the other side, twice the highest income was recorded.
The figures show that revenues and earnings vary markedly; the business suffered significant
losses from 2009 through 2010, except 2012. Real sales rose through 2009, although there was
no reduction in subsequent years in 2009.
PART 2
1. Using the nutrition.csv provided the workings with screenshots and explanation of
results are shown below:
The subsequent analysis was carried out with the support of various SPSS tasks from either the
data set issued. The findings can be seen and listed below:
Descriptive analysis of Gender and rice consumption
Statistics
Gender Rice
N Valid 100 100
Missing 9 9
Mean 1.50 .60
Median 1.50 1.00
Mode 1a 1
Std. Deviation .503 .492
Range 1 1
Paraphrase This Document
Need a fresh take? Get an instant paraphrase of this document with our AI Paraphraser
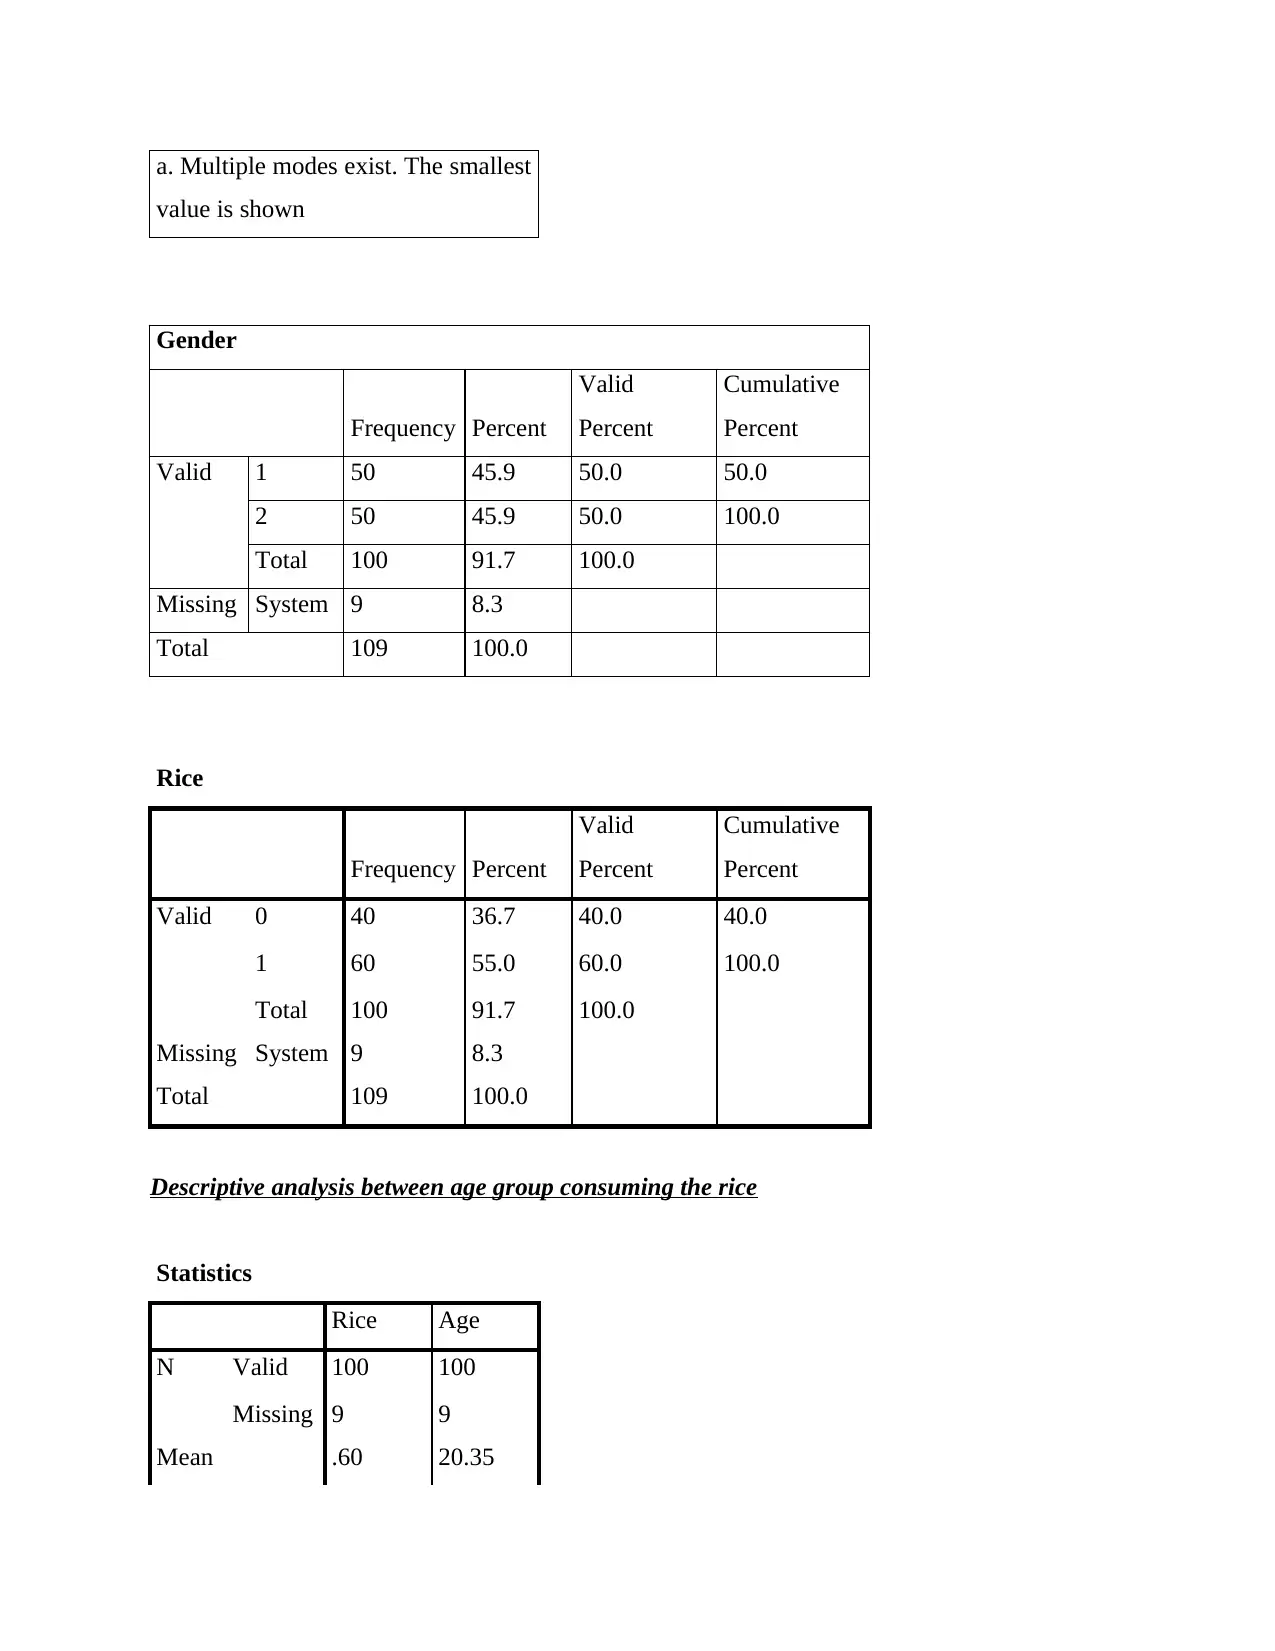
a. Multiple modes exist. The smallest
value is shown
Gender
Frequency Percent
Valid
Percent
Cumulative
Percent
Valid 1 50 45.9 50.0 50.0
2 50 45.9 50.0 100.0
Total 100 91.7 100.0
Missing System 9 8.3
Total 109 100.0
Rice
Frequency Percent
Valid
Percent
Cumulative
Percent
Valid 0 40 36.7 40.0 40.0
1 60 55.0 60.0 100.0
Total 100 91.7 100.0
Missing System 9 8.3
Total 109 100.0
Descriptive analysis between age group consuming the rice
Statistics
Rice Age
N Valid 100 100
Missing 9 9
Mean .60 20.35
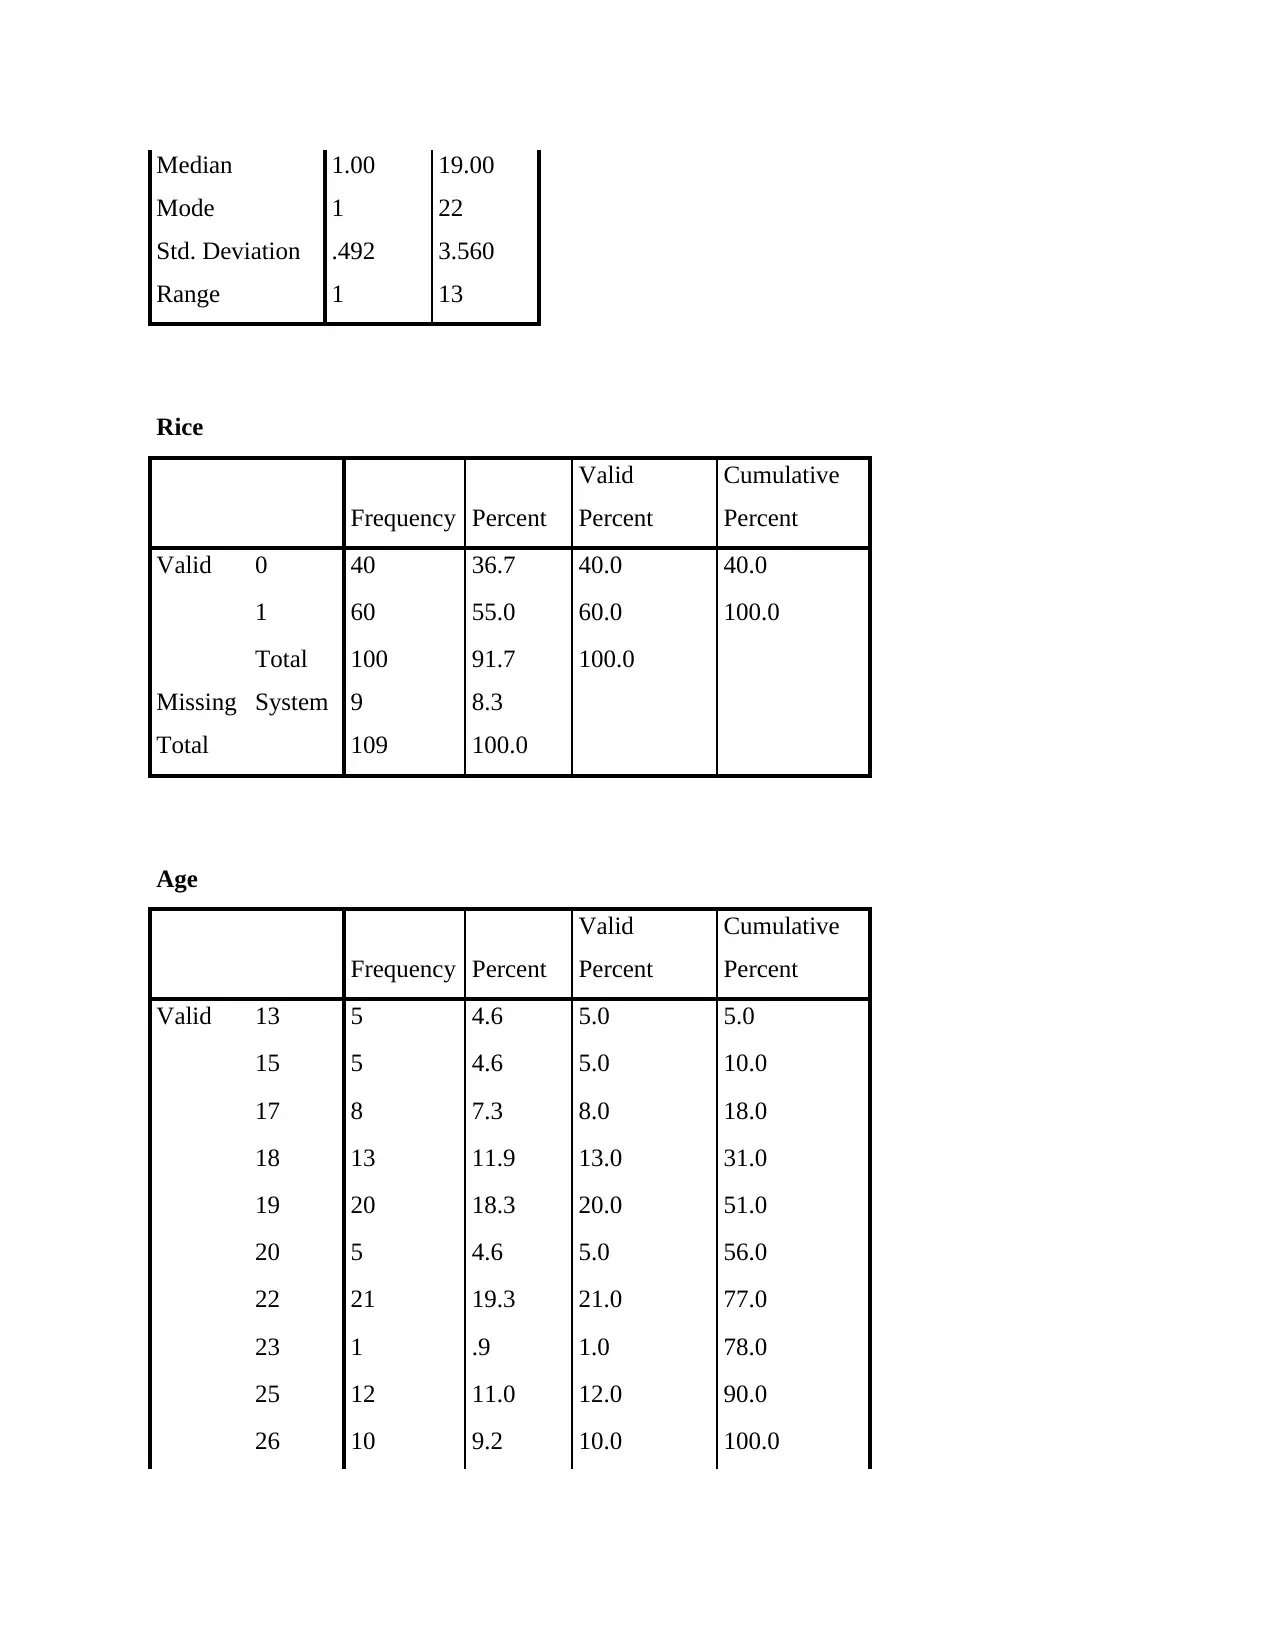
Median 1.00 19.00
Mode 1 22
Std. Deviation .492 3.560
Range 1 13
Rice
Frequency Percent
Valid
Percent
Cumulative
Percent
Valid 0 40 36.7 40.0 40.0
1 60 55.0 60.0 100.0
Total 100 91.7 100.0
Missing System 9 8.3
Total 109 100.0
Age
Frequency Percent
Valid
Percent
Cumulative
Percent
Valid 13 5 4.6 5.0 5.0
15 5 4.6 5.0 10.0
17 8 7.3 8.0 18.0
18 13 11.9 13.0 31.0
19 20 18.3 20.0 51.0
20 5 4.6 5.0 56.0
22 21 19.3 21.0 77.0
23 1 .9 1.0 78.0
25 12 11.0 12.0 90.0
26 10 9.2 10.0 100.0
⊘ This is a preview!⊘
Do you want full access?
Subscribe today to unlock all pages.
Trusted by 1+ million students worldwide
Total 100 91.7 100.0
Missing System 9 8.3
Total 109 100.0
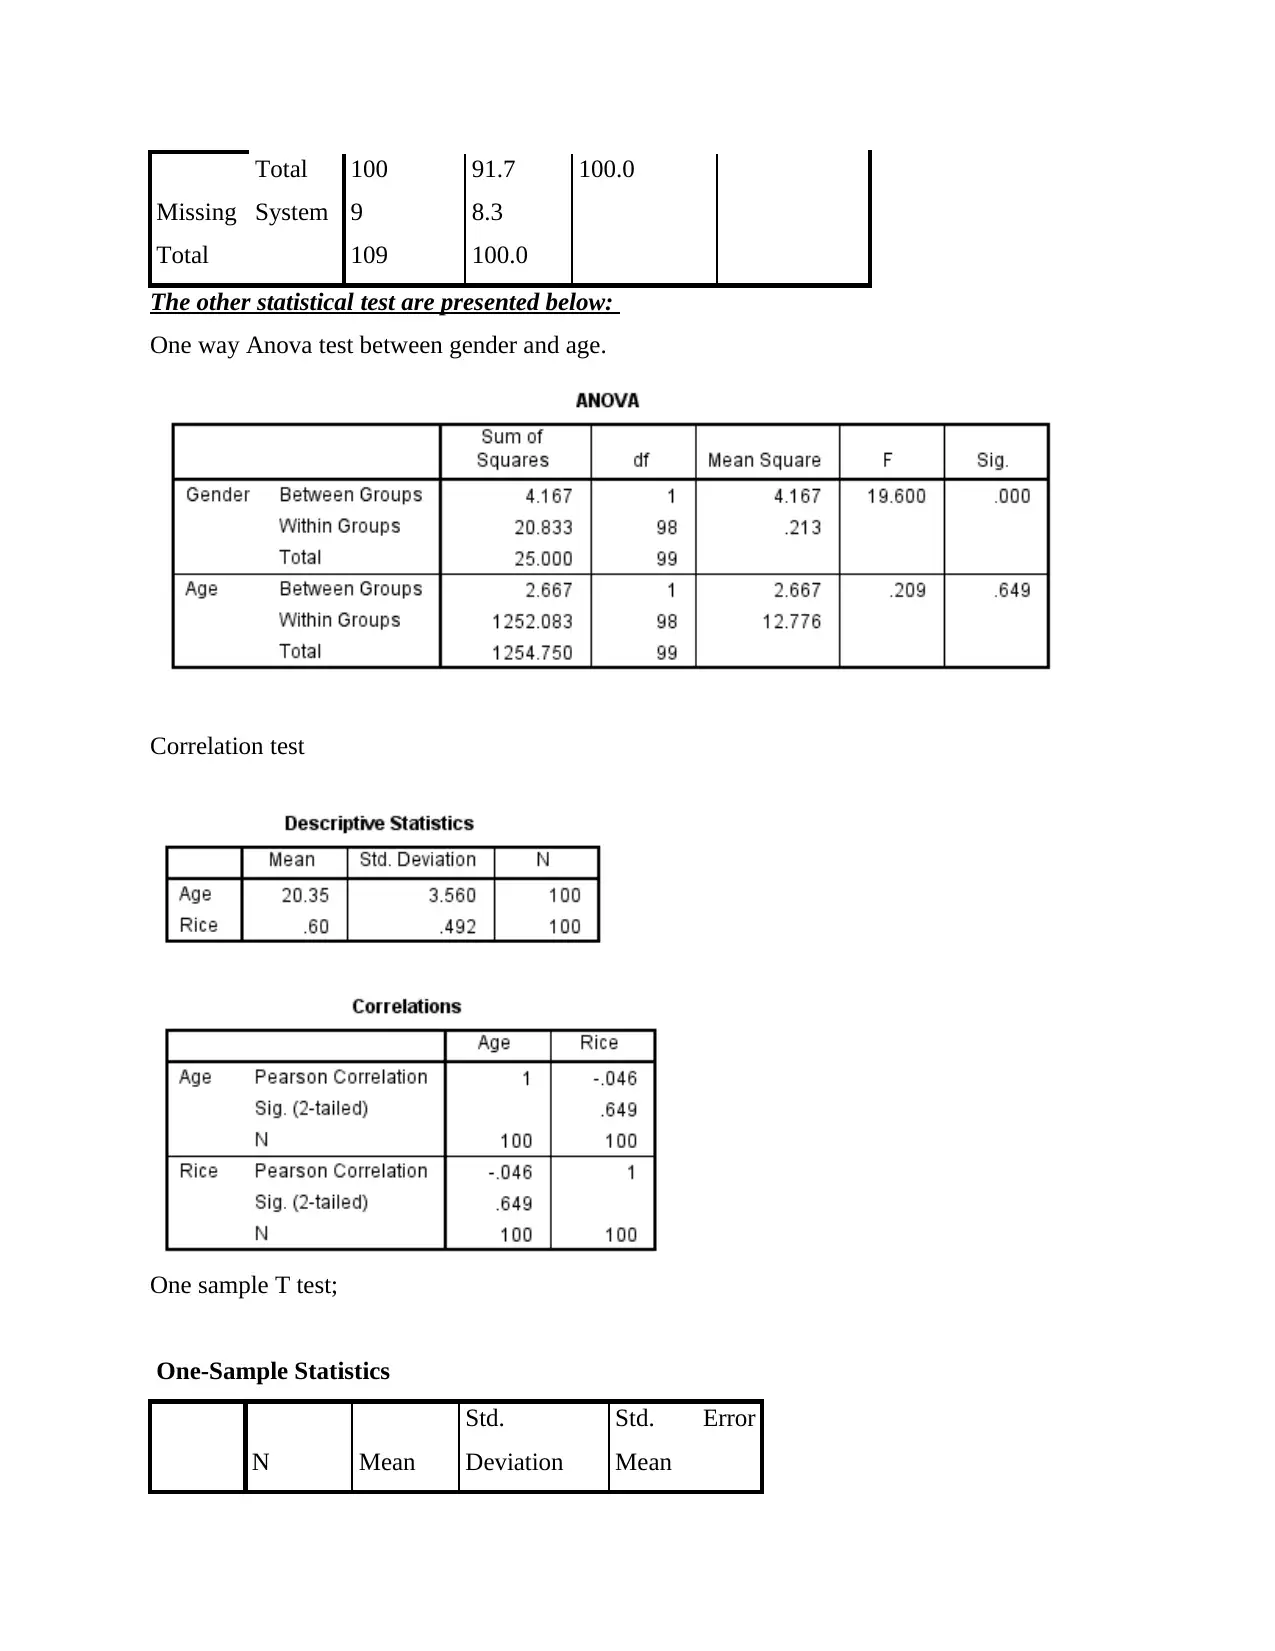
The other statistical test are presented below:
One way Anova test between gender and age.
Correlation test
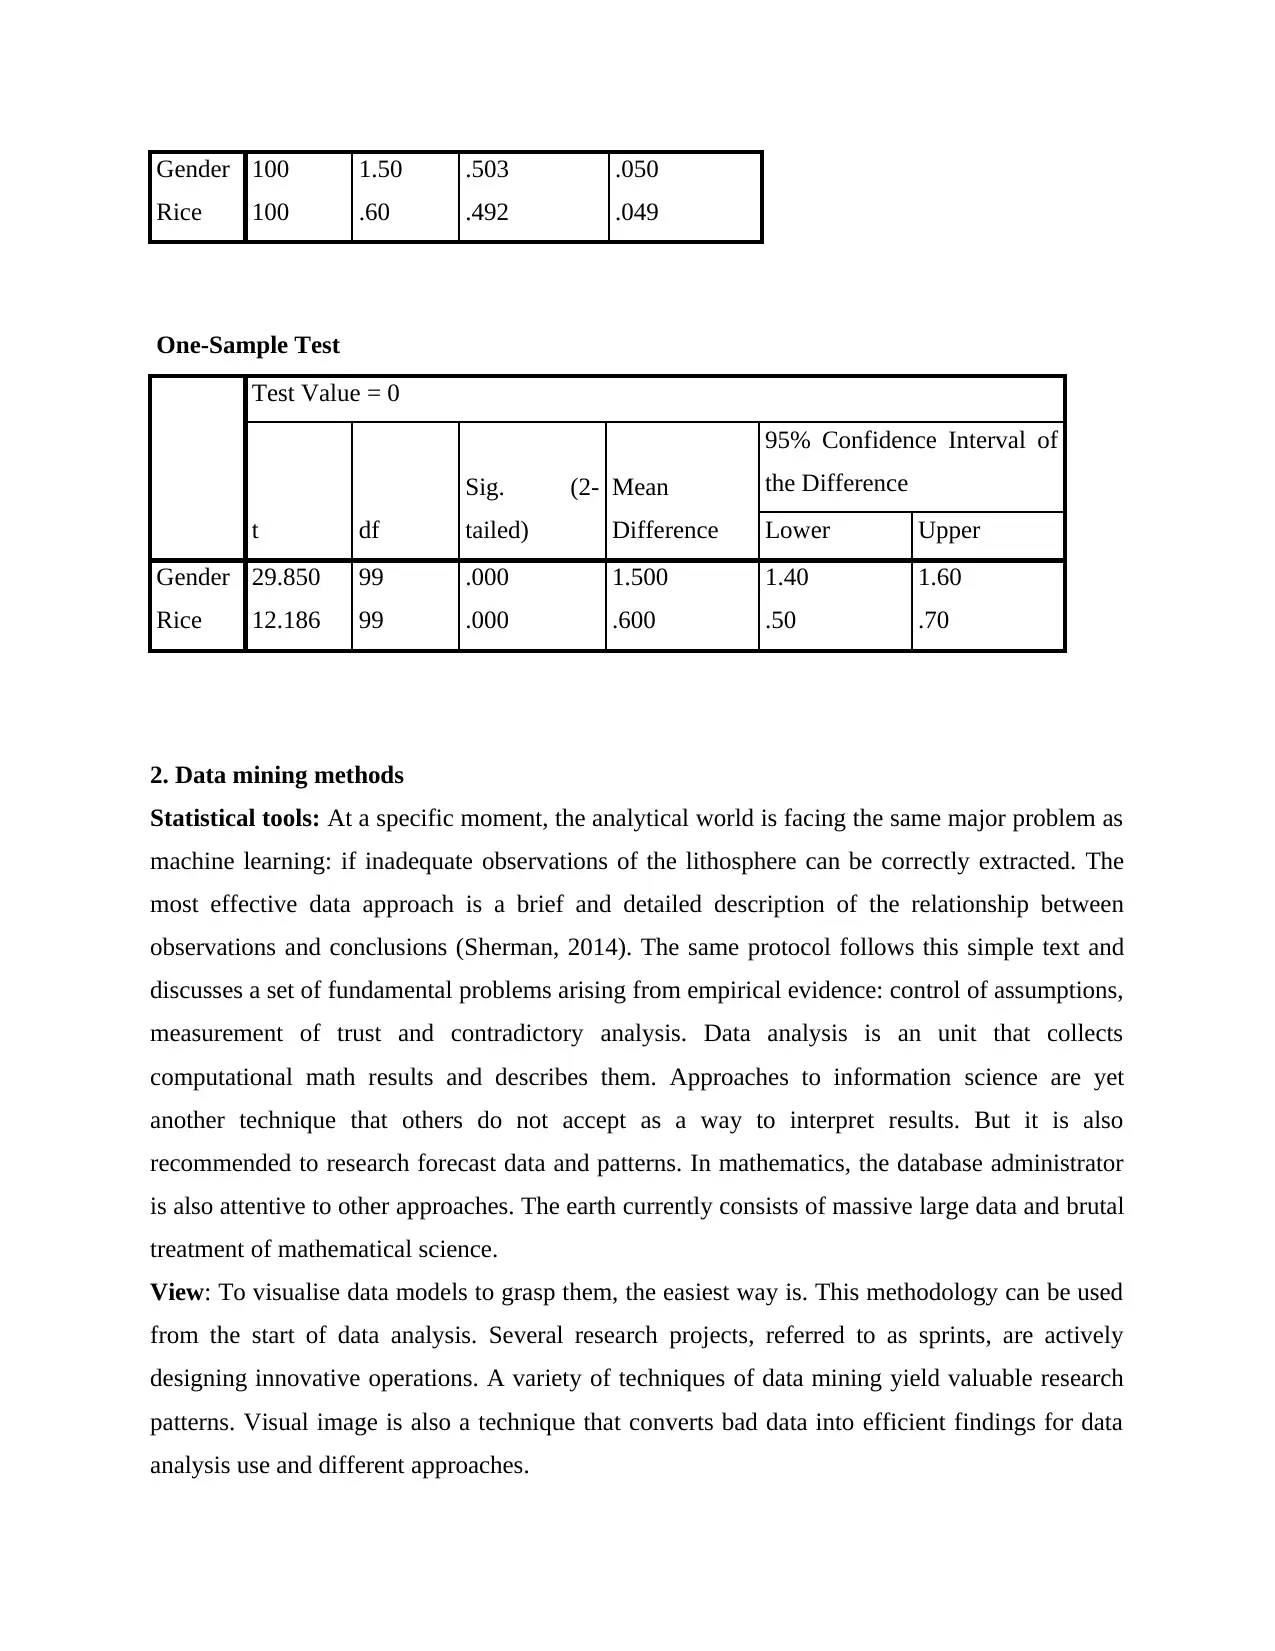
One sample T test;
One-Sample Statistics
N Mean
Std.
Deviation
Std. Error
Mean
Missing System 9 8.3
Total 109 100.0
The other statistical test are presented below:
One way Anova test between gender and age.
Correlation test
One sample T test;
One-Sample Statistics
N Mean
Std.
Deviation
Std. Error
Mean
Paraphrase This Document
Need a fresh take? Get an instant paraphrase of this document with our AI Paraphraser
Gender 100 1.50 .503 .050
Rice 100 .60 .492 .049
One-Sample Test
Test Value = 0
t df
Sig. (2-
tailed)
Mean
Difference
95% Confidence Interval of
the Difference
Lower Upper
Gender 29.850 99 .000 1.500 1.40 1.60
Rice 12.186 99 .000 .600 .50 .70
2. Data mining methods
Statistical tools: At a specific moment, the analytical world is facing the same major problem as
machine learning: if inadequate observations of the lithosphere can be correctly extracted. The
most effective data approach is a brief and detailed description of the relationship between
observations and conclusions (Sherman, 2014). The same protocol follows this simple text and
discusses a set of fundamental problems arising from empirical evidence: control of assumptions,
measurement of trust and contradictory analysis. Data analysis is an unit that collects
computational math results and describes them. Approaches to information science are yet
another technique that others do not accept as a way to interpret results. But it is also
recommended to research forecast data and patterns. In mathematics, the database administrator
is also attentive to other approaches. The earth currently consists of massive large data and brutal
treatment of mathematical science.
View: To visualise data models to grasp them, the easiest way is. This methodology can be used
from the start of data analysis. Several research projects, referred to as sprints, are actively
designing innovative operations. A variety of techniques of data mining yield valuable research
patterns. Visual image is also a technique that converts bad data into efficient findings for data
analysis use and different approaches.
Induction Decision Tree Technique- Yes, a feature selection is a forested unit; it also means tree
by word. In this procedure, every other tree branch is often used as a classification problem, as
well as to explain the branch splits for the server portion (Kalelkar, Churi and Kalelkar, 2014). In
exploratory studies, this technique could be used for both following and studying. For a certain
task, the data collection may be used as a subset of the data study. In their estimate of their
results, the information in the chapter indicates certain variations. The Decision Tree has clear
consequences for student entry.
Clustering Strategies- One of the main statistical approaches is clustering, and it is a process by
which communities that depends is clustered fairly. It gives explanations of contradictions and
relations through research. It is also known as isolation, which enables users to define the
server's activities. Insurance will, for instance, classify its consumers by job, age, compensation
and type of claims.
Convolution Network- Another popular approach that is used mainly by people is genetic
algorithms. This process is typical for early information mining. Since they are designed,
artificial intelligence is easy to obtain and users do not need to be technically or tech-savvy. The
neuronal technique was designed by an artificial intelligence company.
Methodology of Algorithm: A relationship between objects in an image is created. The
interaction inside the database between different variables is also important. Evidence for the
grouping of parameters and the persistent occurrence of environmental stimuli of the same
concentrations is given in the hidden pattern archive.
3. Advantages and Disadvantages of SPSS
Benefits over Excel
SPSS is consumer and easy-to-use pupil applications, but still allows research, even though
knowledge selection is broader (Kimball and Ross, 2015). The statistical approach is a software
suite which is used in statistics to evaluate rational data aggregation and – anti.
This software is one of the most common succinct programmes with basic rules that can conduct
incredibly complicated data research and calculation.
To build collated files, dispersed and pattern charts and maps, factor stats, and also to analyze the
data, SPSS can collect and then use information from any medium.
⊘ This is a preview!⊘
Do you want full access?
Subscribe today to unlock all pages.
Trusted by 1+ million students worldwide
1 out of 14
Related Documents


Your All-in-One AI-Powered Toolkit for Academic Success.
+13062052269
info@desklib.com
Available 24*7 on WhatsApp / Email
![[object Object]](/_next/static/media/star-bottom.7253800d.svg)
Unlock your academic potential
Copyright © 2020–2026 A2Z Services. All Rights Reserved. Developed and managed by ZUCOL.