Data Handling and Business Intelligence: Excel & SPSS Report

Verified

Added on  2023/06/18

|17
|3234
|184
Report
AI Summary
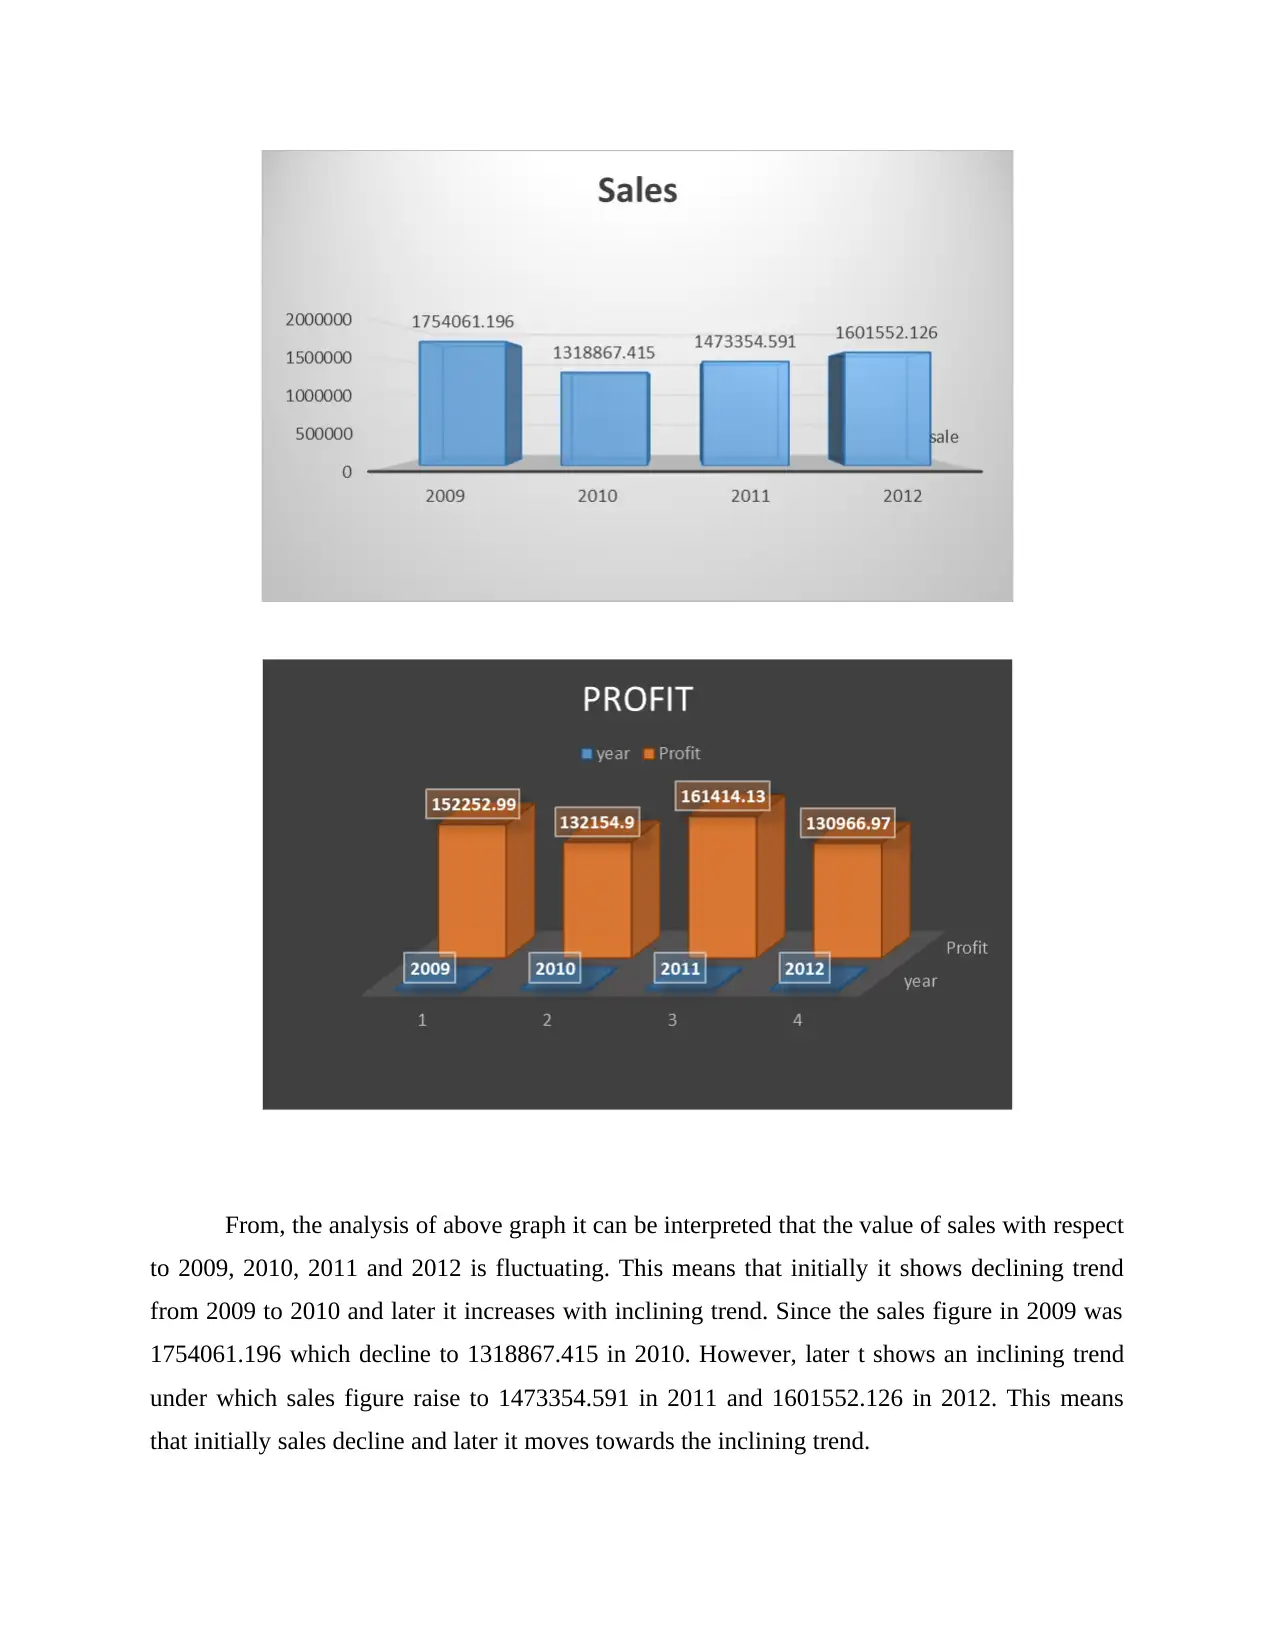
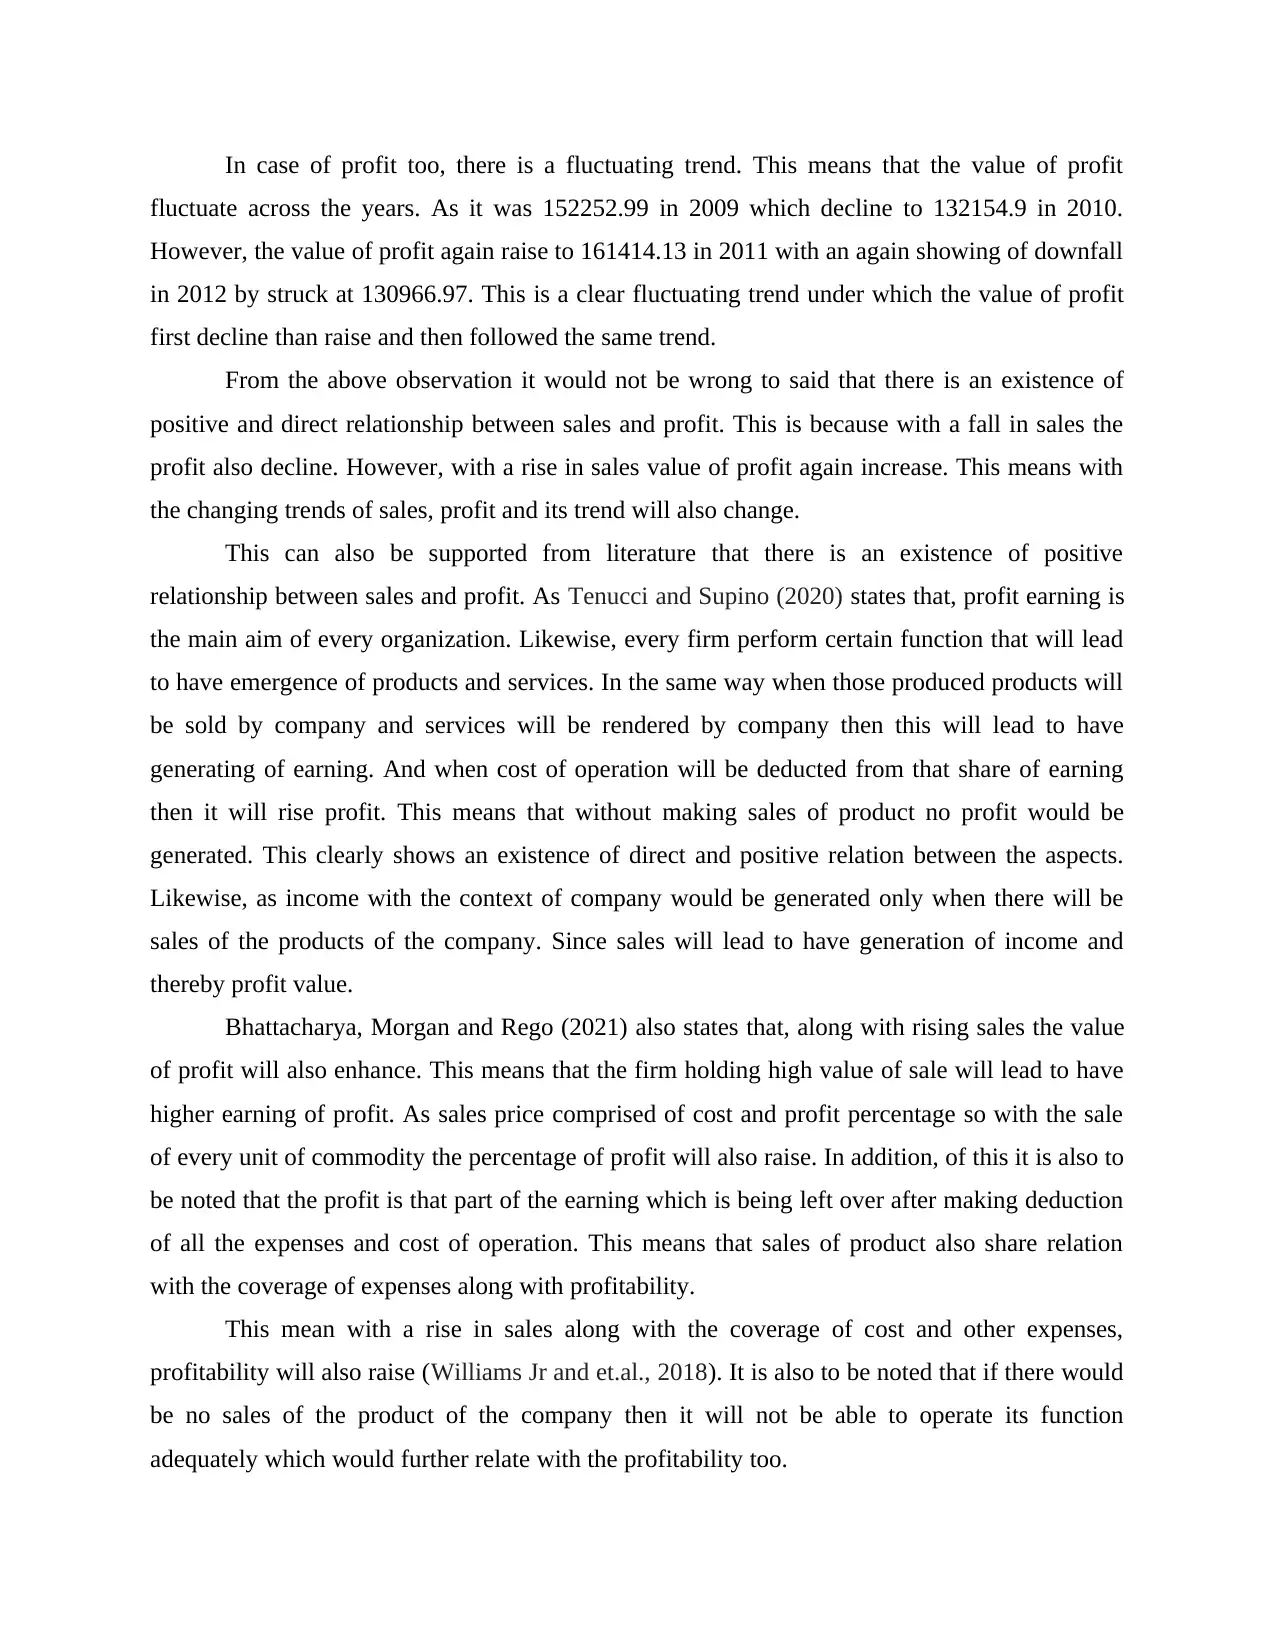
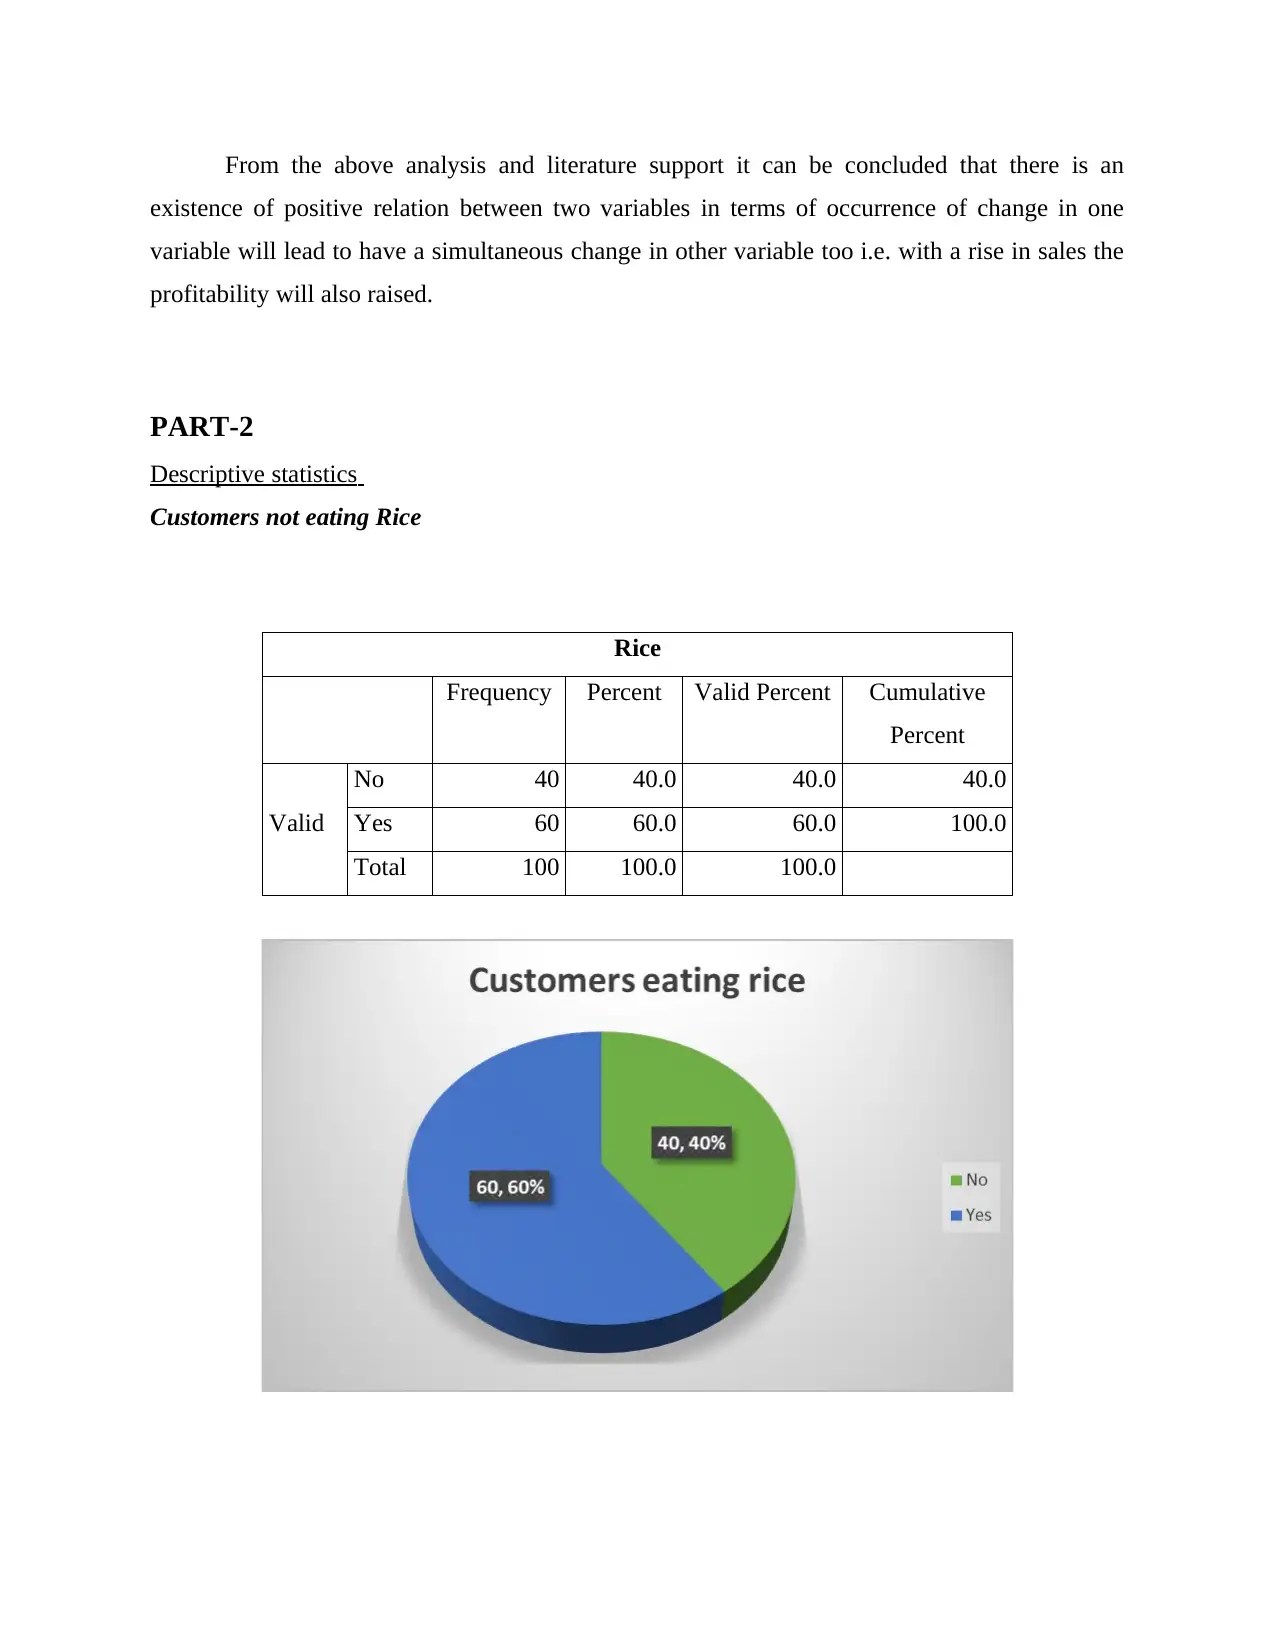
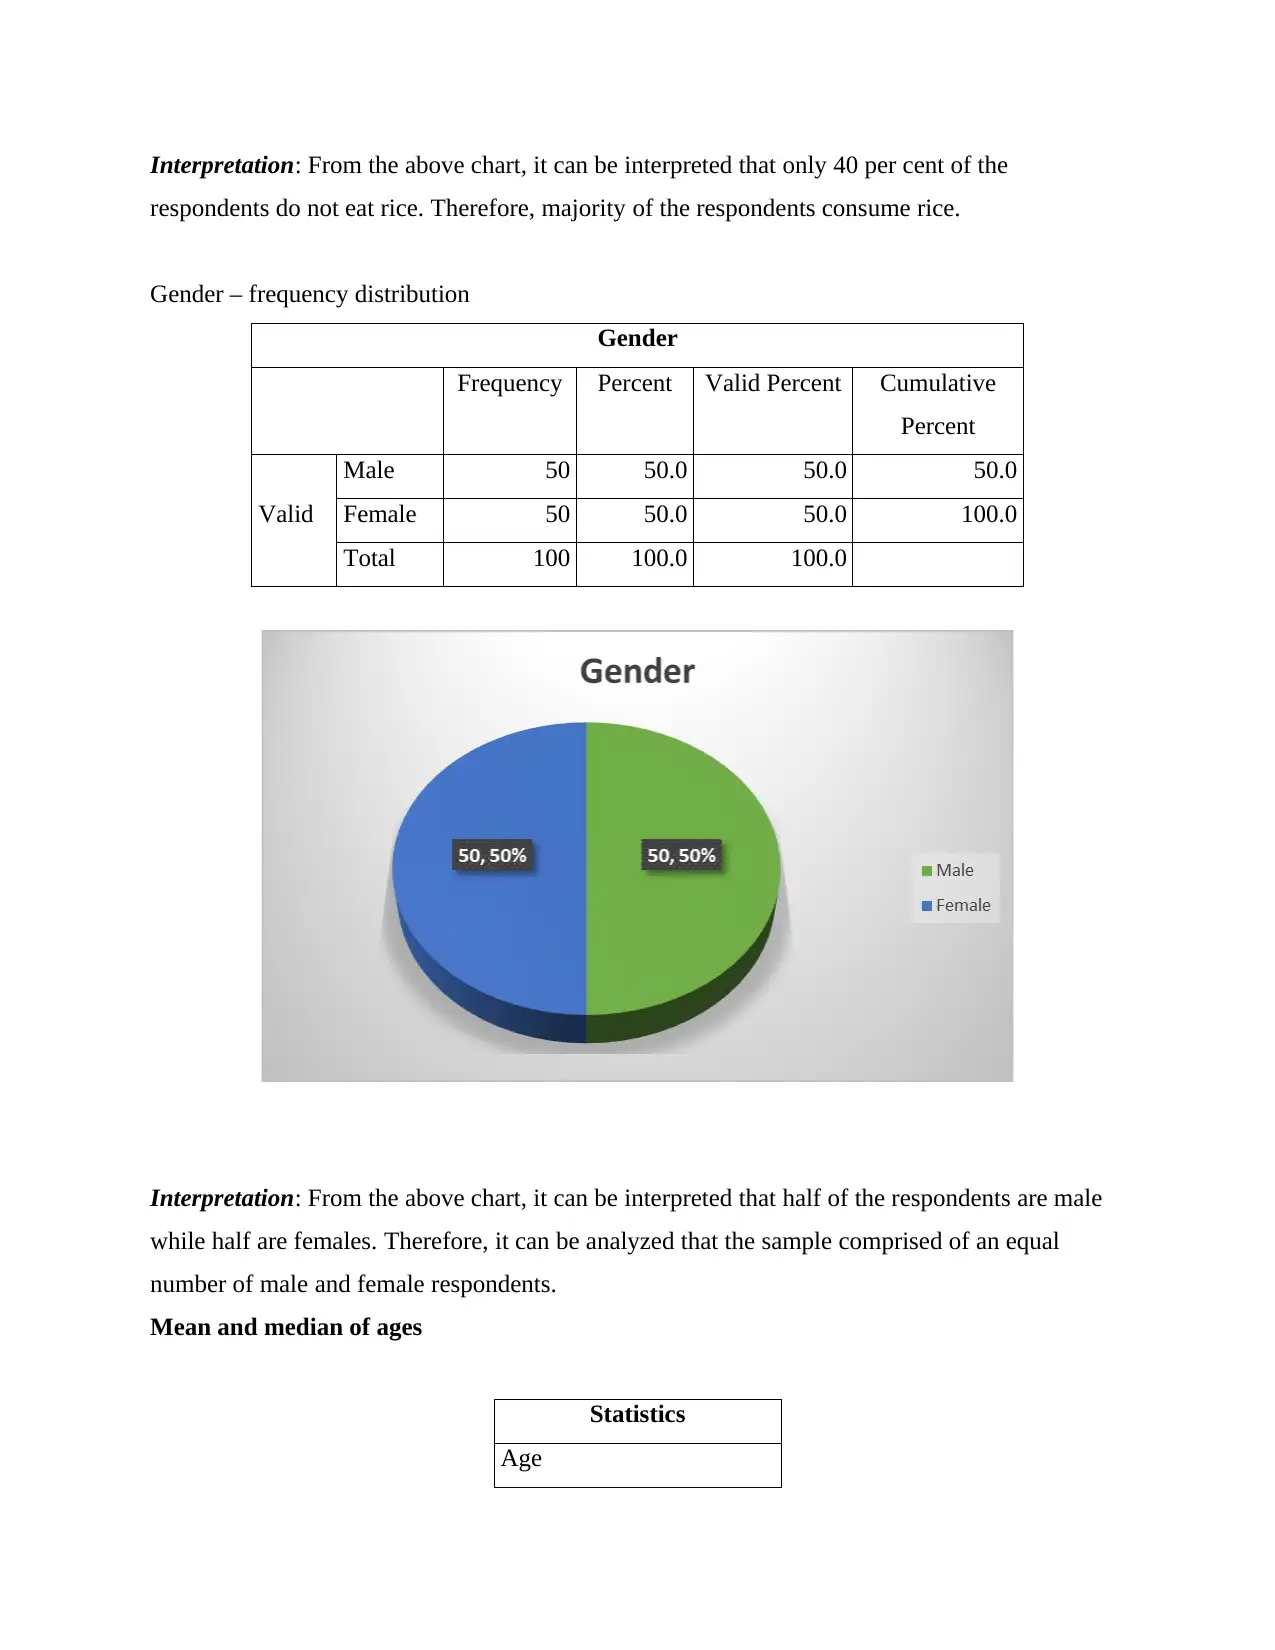
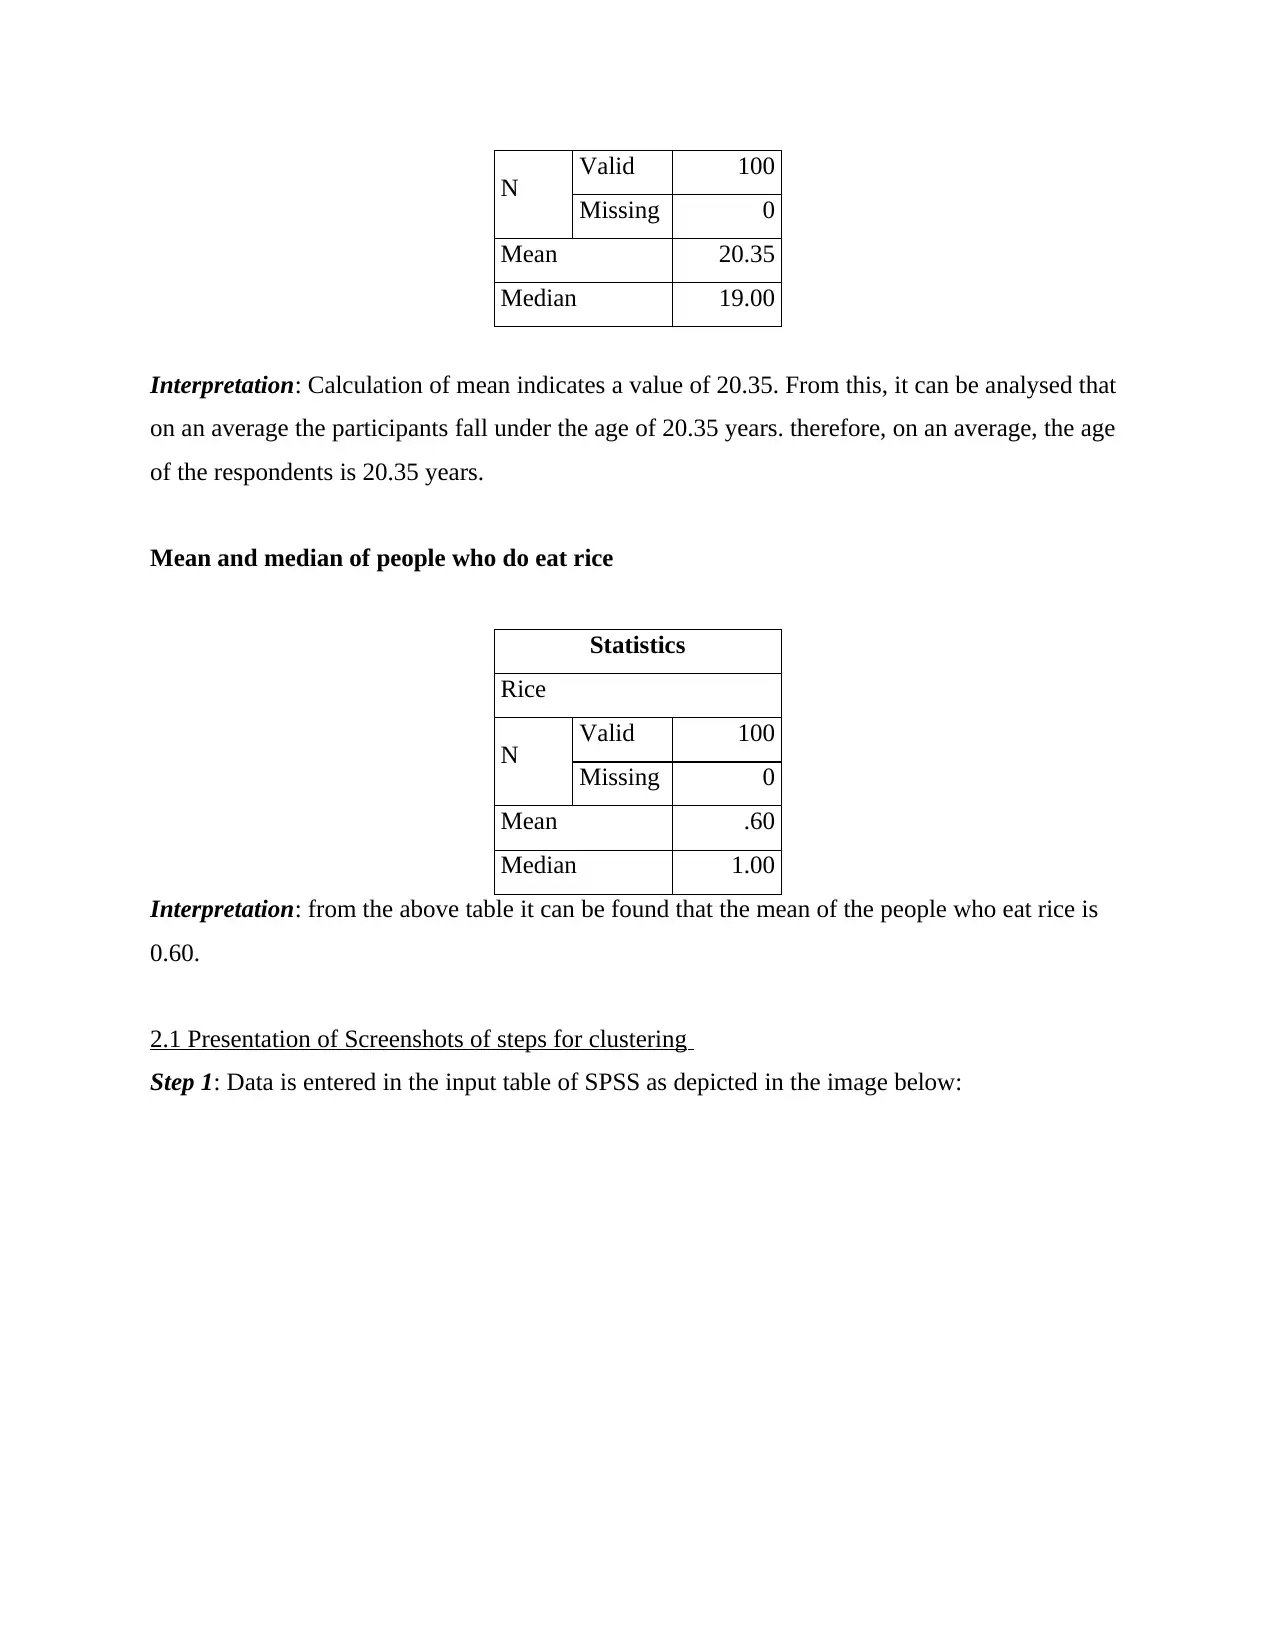
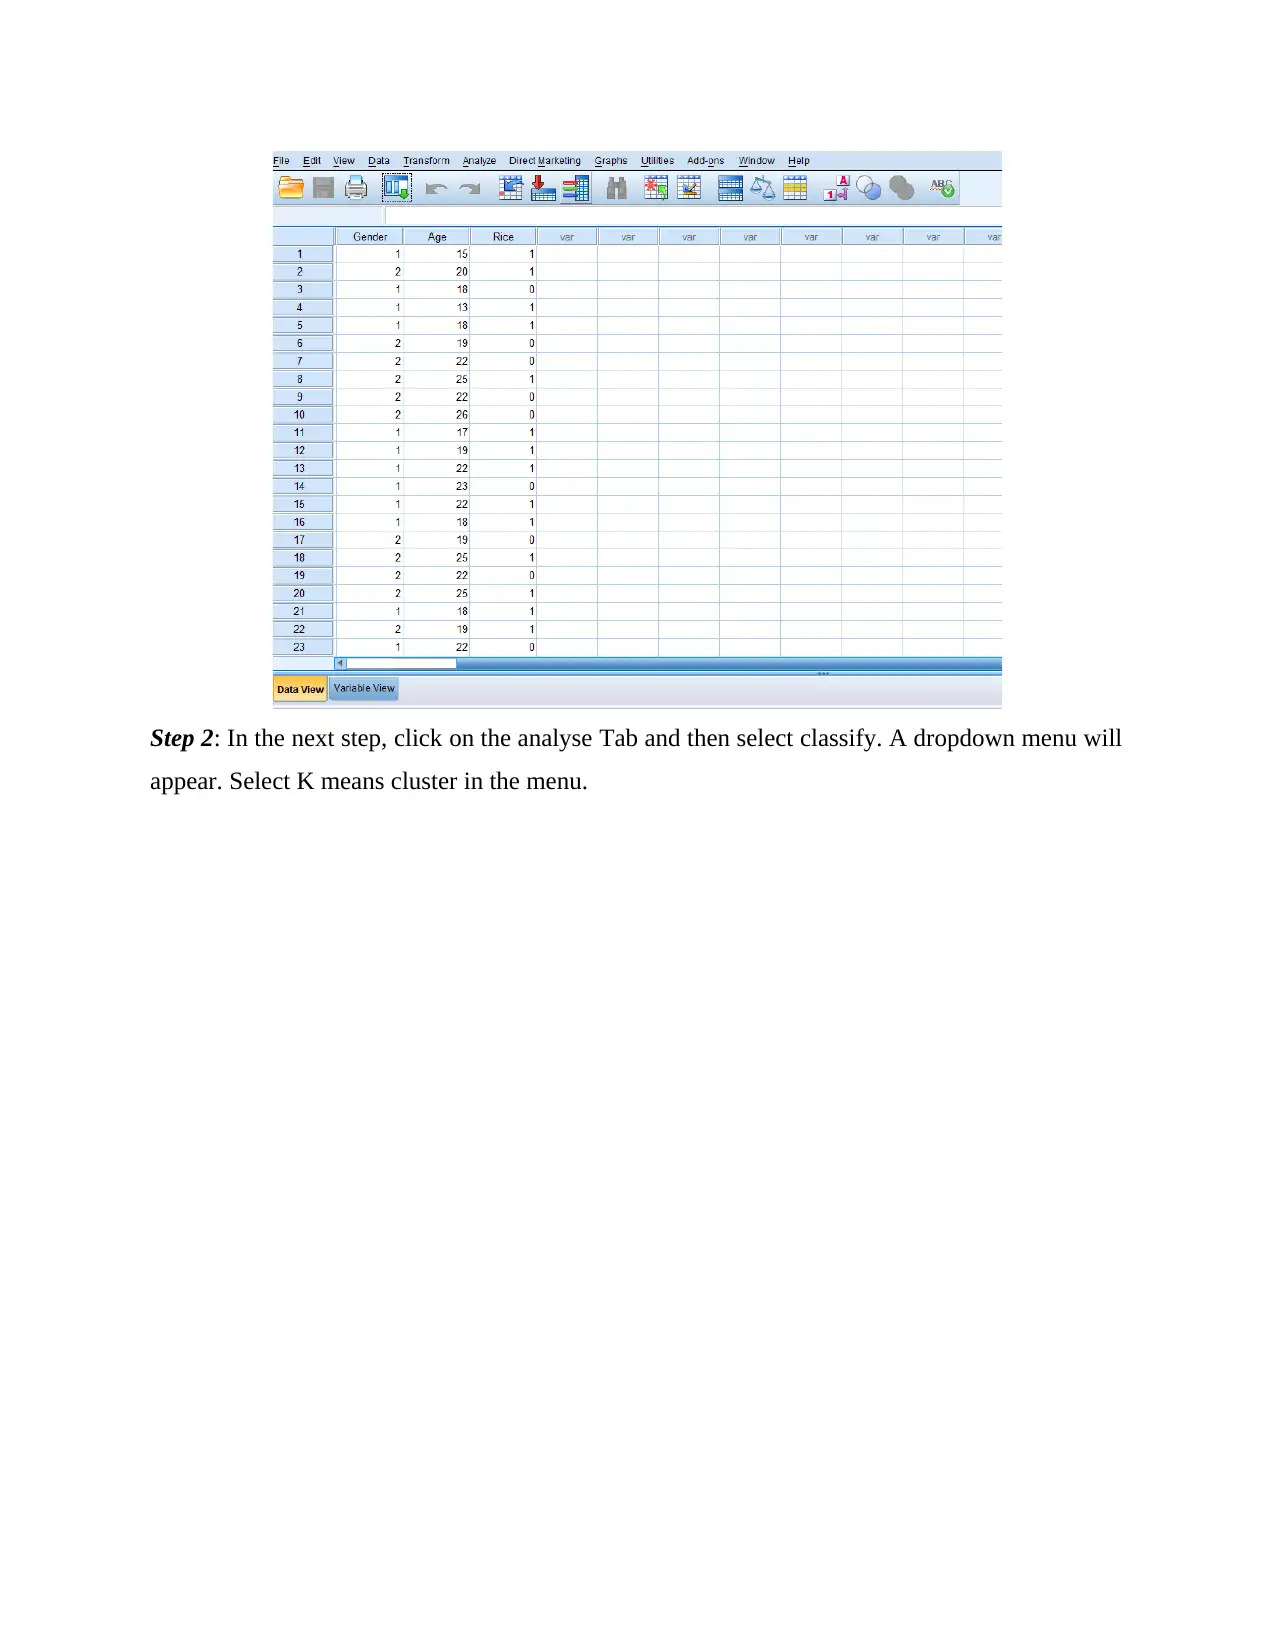
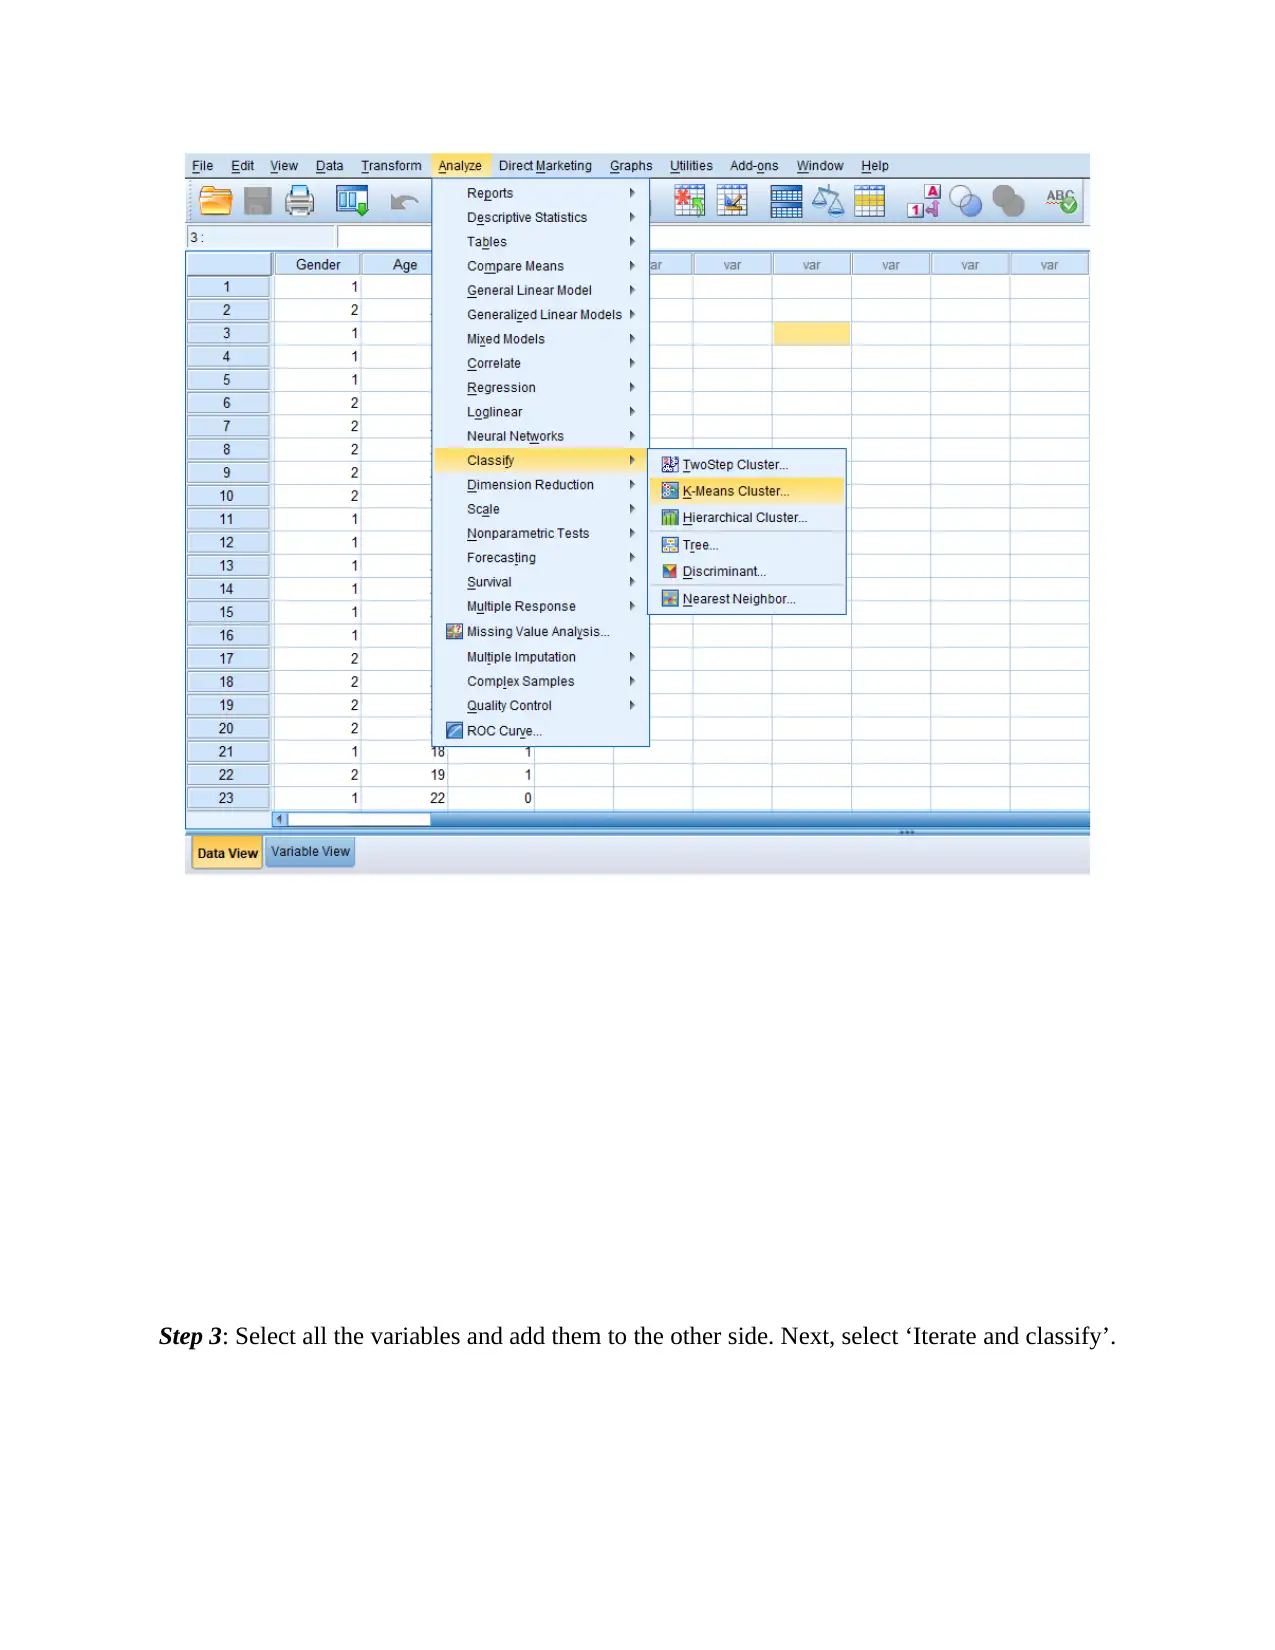
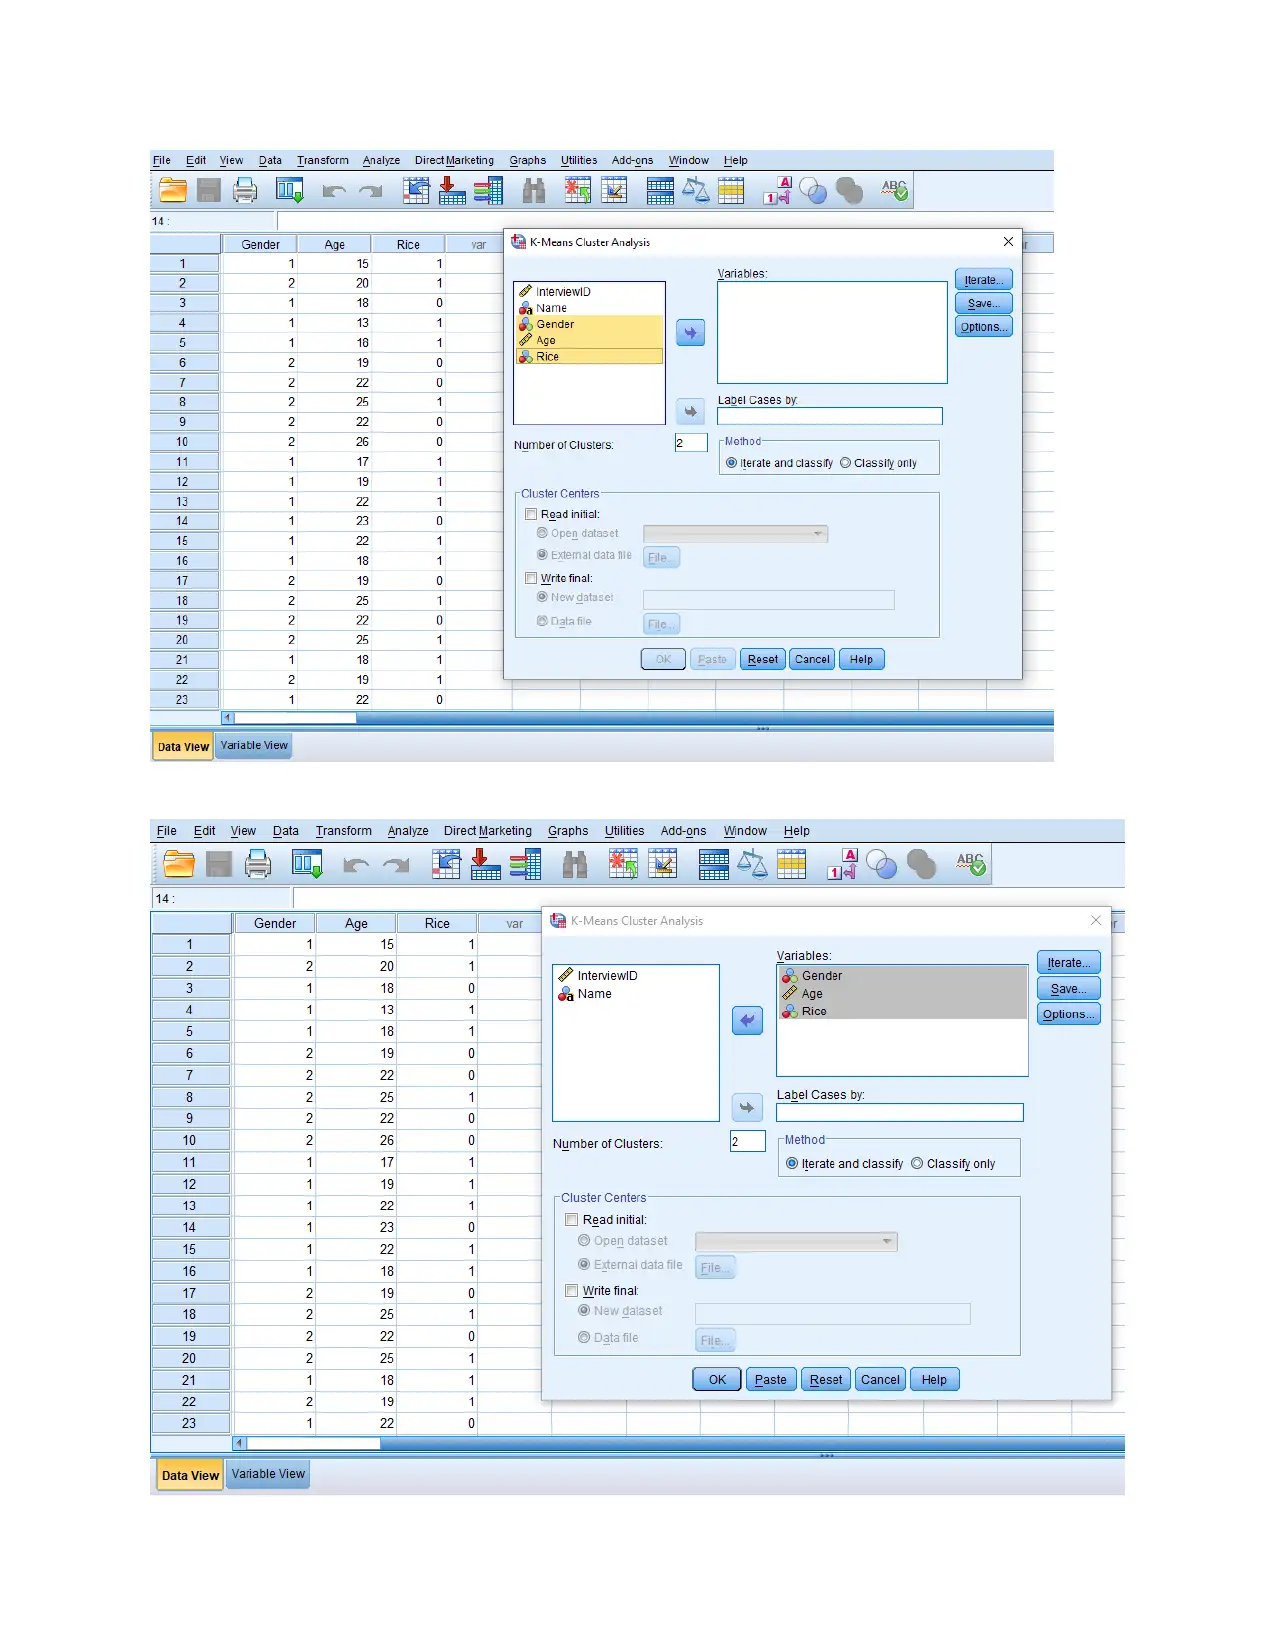
This report provides a comprehensive analysis of data handling and business intelligence using Excel and SPSS. It begins by discussing the role of Excel in data pre-processing, analysis, and visualization, highlighting its strengths in transforming raw data into understandable formats through tables, charts, and graphs, while also acknowledging potential errors. The report then analyzes Superstore sales and profit data using Excel, demonstrating the positive relationship between sales and profit through graphical representations. The second part of the report delves into descriptive statistics, presenting frequency distributions and mean/median calculations for customer data related to rice consumption and gender. K-means clustering is performed using SPSS, illustrating the process with screenshots and interpreting the results. Finally, the report briefly touches on data mining methods and offers a comparison between SPSS and Excel. This assignment showcases practical application of data analysis tools for business intelligence.
Document Page
DATA HANDLING AND
BUSINESS INTELLIGENCE
tabler-icon-diamond-filled.svg

Paraphrase This Document

Need a fresh take? Get an instant paraphrase of this document with our AI Paraphraser
Document Page
Table of Contents
PART-1............................................................................................................................................3
Use of excel for pre-processing, analysing and visualizing the data...........................................3
PART-2............................................................................................................................................7
Descriptive statistics....................................................................................................................7
2.1 Presentation of Screenshots of steps for clustering...............................................................9
2.2 Data mining method............................................................................................................14
2.3 SPSS vs Excel......................................................................................................................15
REFERENCES................................................................................................................................1
Document Page
PART-1
Use of excel for pre-processing, analysing and visualizing the data
As data is always available in raw form which is very difficult to make understand.
Likewise, the quantity of data in terms of its wideness is also large. Here excel plays an
important role in terms of pre-processing the data under which the data is being converted into
understandable mode. This is usually performed with the help of inculcation of table and
arrangement of data in rows and columns in such a manner that it will be easy to understand by
user. It is also to be noted that the arrangement of data is performed within rows and columns so
that relationship between variables will be established (Kaur and Garg, 2019). This will be
counted as base and important step under which raw data is converted in understandable manner
with its presentation in rows and columns. Along with pre-processing, excel also plays an
important role in analysing the data with the involvement of its features of formulas and
functions of calculation including regression, pivot tables and various others. This will lead to
have better analysis of data so that its outcome and results will be analysed in effective manner.
It is also to be considered that along with the function of graphs and charts of excel data can not
only be pre-processed but it will also be presented in such a manner that its analysis can be
performed in effective manner.
As pre-processing involves presentation of data in understandable manner so with the
help of excel and its features including table and graphs data will not only be gathered in
summarize form but it will raise the interpretation and understanding of the data (Ellis and Leek,
2018). Charts and graphs will enable the user to make analysis of the trends along with
determining the meaning of data. This is further related with the data visualization because when
data will be in raw mode and when it is being arranged in tables and charts then it will be
visually visible and presentable (Sandnes and et.al., 2020). This means that with a look over the
prepared charts and tables the meaning of data will be determined. Thus, it would be right to said
that excel plays an important role with regard to pre-processing, analysing and visualization of
data.
However, on the other hand, it is to be noted that although excel is used as best mode of
pre-processing but it includes various risk and loopholes with respect to this concept. This is
because when data is being inserted in rows and columns then it will lead to have occurrence of
errors in terms of missing of data, wrong typing, difficulty while handling big data, occurrence of
Document Page
manual errors and various others (Abasova and et.al., 2018). With regard to the presence of these
loopholes, it would not be wrong to said that although excel is best with respect to data pre-
processing but there is an involvement of high percentage of errors. This will lead to have mis-
interpretation or creation of wrong understanding with respect to data.
With respect to the data of sales and profit of Superstore, excel and its function of charts
and graphs plays an important role. This is because with the involvement of charts and graphs
big data can be summarized in easy and presentable mode so that the trends and information
pertaining to data will be analysed adequately. With regard to the data of Superstore and its
presentation with the function of charts and graphs following steps were taken:
The initial step begin with the use of filter function of excel which lead to make
arrangement and extraction of relevant data.
After applying filter, range related with sales will be selected so that the relevant data of
sales will arrived out of the huge available data.
Following to this range of specific year along with the sum formula will be applied so
that the sales of that specific year will come. In this way sum total of sales figures of
2009, 2010, 2011 and 2012 will be determined.
Similar steps right from applying filter till application of sum formula will lead to arise
the sum of profit figures of 2009, 2010, 2011 and 2012.
In the later stage, the range of data will be selected followed by selecting the graphs and
charts function. After that a suitable graph will be selected so that the data will be
presented in informative manner.
Along with the preparation, it is being analysed that there is an existence of positive
relationship between sales and profit of Superstore. This means that with a rise in sales
the percentage of profit will also raise.
With the following of above steps and making presentation of data it would be concluded
that there is an existence of positive relationship between sales and profit and the
Superstore must need to focus over the aspect of raising sales of products so that profit
will also increase.
Graphical representation:
tabler-icon-diamond-filled.svg

Paraphrase This Document

Need a fresh take? Get an instant paraphrase of this document with our AI Paraphraser
Document Page
From, the analysis of above graph it can be interpreted that the value of sales with respect
to 2009, 2010, 2011 and 2012 is fluctuating. This means that initially it shows declining trend
from 2009 to 2010 and later it increases with inclining trend. Since the sales figure in 2009 was
1754061.196 which decline to 1318867.415 in 2010. However, later t shows an inclining trend
under which sales figure raise to 1473354.591 in 2011 and 1601552.126 in 2012. This means
that initially sales decline and later it moves towards the inclining trend.
Document Page
In case of profit too, there is a fluctuating trend. This means that the value of profit
fluctuate across the years. As it was 152252.99 in 2009 which decline to 132154.9 in 2010.
However, the value of profit again raise to 161414.13 in 2011 with an again showing of downfall
in 2012 by struck at 130966.97. This is a clear fluctuating trend under which the value of profit
first decline than raise and then followed the same trend.
From the above observation it would not be wrong to said that there is an existence of
positive and direct relationship between sales and profit. This is because with a fall in sales the
profit also decline. However, with a rise in sales value of profit again increase. This means with
the changing trends of sales, profit and its trend will also change.
This can also be supported from literature that there is an existence of positive
relationship between sales and profit. As Tenucci and Supino (2020) states that, profit earning is
the main aim of every organization. Likewise, every firm perform certain function that will lead
to have emergence of products and services. In the same way when those produced products will
be sold by company and services will be rendered by company then this will lead to have
generating of earning. And when cost of operation will be deducted from that share of earning
then it will rise profit. This means that without making sales of product no profit would be
generated. This clearly shows an existence of direct and positive relation between the aspects.
Likewise, as income with the context of company would be generated only when there will be
sales of the products of the company. Since sales will lead to have generation of income and
thereby profit value.
Bhattacharya, Morgan and Rego (2021) also states that, along with rising sales the value
of profit will also enhance. This means that the firm holding high value of sale will lead to have
higher earning of profit. As sales price comprised of cost and profit percentage so with the sale
of every unit of commodity the percentage of profit will also raise. In addition, of this it is also to
be noted that the profit is that part of the earning which is being left over after making deduction
of all the expenses and cost of operation. This means that sales of product also share relation
with the coverage of expenses along with profitability.
This mean with a rise in sales along with the coverage of cost and other expenses,
profitability will also raise (Williams Jr and et.al., 2018). It is also to be noted that if there would
be no sales of the product of the company then it will not be able to operate its function
adequately which would further relate with the profitability too.
Document Page
From the above analysis and literature support it can be concluded that there is an
existence of positive relation between two variables in terms of occurrence of change in one
variable will lead to have a simultaneous change in other variable too i.e. with a rise in sales the
profitability will also raised.
PART-2
Descriptive statistics
Customers not eating Rice
Rice
Frequency Percent Valid Percent Cumulative
Percent
Valid
No 40 40.0 40.0 40.0
Yes 60 60.0 60.0 100.0
Total 100 100.0 100.0
tabler-icon-diamond-filled.svg

Paraphrase This Document

Need a fresh take? Get an instant paraphrase of this document with our AI Paraphraser
Document Page
Interpretation: From the above chart, it can be interpreted that only 40 per cent of the
respondents do not eat rice. Therefore, majority of the respondents consume rice.
Gender – frequency distribution
Gender
Frequency Percent Valid Percent Cumulative
Percent
Valid
Male 50 50.0 50.0 50.0
Female 50 50.0 50.0 100.0
Total 100 100.0 100.0
Interpretation: From the above chart, it can be interpreted that half of the respondents are male
while half are females. Therefore, it can be analyzed that the sample comprised of an equal
number of male and female respondents.
Mean and median of ages
Statistics
Age
Document Page
N Valid 100
Missing 0
Mean 20.35
Median 19.00
Interpretation: Calculation of mean indicates a value of 20.35. From this, it can be analysed that
on an average the participants fall under the age of 20.35 years. therefore, on an average, the age
of the respondents is 20.35 years.
Mean and median of people who do eat rice
Statistics
Rice
N Valid 100
Missing 0
Mean .60
Median 1.00
Interpretation: from the above table it can be found that the mean of the people who eat rice is
0.60.
2.1 Presentation of Screenshots of steps for clustering
Step 1: Data is entered in the input table of SPSS as depicted in the image below:
Document Page
Step 2: In the next step, click on the analyse Tab and then select classify. A dropdown menu will
appear. Select K means cluster in the menu.
tabler-icon-diamond-filled.svg

Paraphrase This Document

Need a fresh take? Get an instant paraphrase of this document with our AI Paraphraser
Document Page
Step 3: Select all the variables and add them to the other side. Next, select ‘Iterate and classify’.
Document Page
chevron_up_icon
1 out of 17
circle_padding
hide_on_mobile
zoom_out_icon
[object Object]