Data Handling and Business Intelligence Analysis: Detailed Report
VerifiedAdded on 2023/01/03
|16
|3162
|78
Report
AI Summary
This report delves into data handling and business intelligence, examining the decline in sales and profits using provided data. It explores data preprocessing in Excel, including the use of pivot tables for analysis and visualization through charts and graphs. The report also covers data mining methods like clustering, classification, and regression analysis, highlighting their applications in business contexts. It provides an example of clustering and discusses various data mining techniques, such as classification analysis, association rule learning, and regression analysis, along with their practical uses. Furthermore, it compares the advantages and disadvantages of using SPSS over Excel for data analysis, offering insights into the strengths and weaknesses of each software. The report concludes with a discussion on the importance of data analysis for informed decision-making.
DATA HANDLING AND
BUSINESS INTELLIGENCE-2
1
BUSINESS INTELLIGENCE-2
1
Paraphrase This Document
Need a fresh take? Get an instant paraphrase of this document with our AI Paraphraser
Table of Contents
INTRODUCTION...........................................................................................................................3
Part 1................................................................................................................................................3
Examining decline in the Sales/ Profits from data.......................................................................3
Excel in pre-processing the data..................................................................................................5
Analysing data in excel................................................................................................................5
Visualising data in excel..............................................................................................................6
PART 2............................................................................................................................................7
2.1 Example of clustering............................................................................................................7
2.2 Data mining methods that are used in business...................................................................11
2.3 Advantage and disadvantage of using SPSS over Excel.....................................................12
CONCLUSION..............................................................................................................................14
REFERENCES..............................................................................................................................16
2
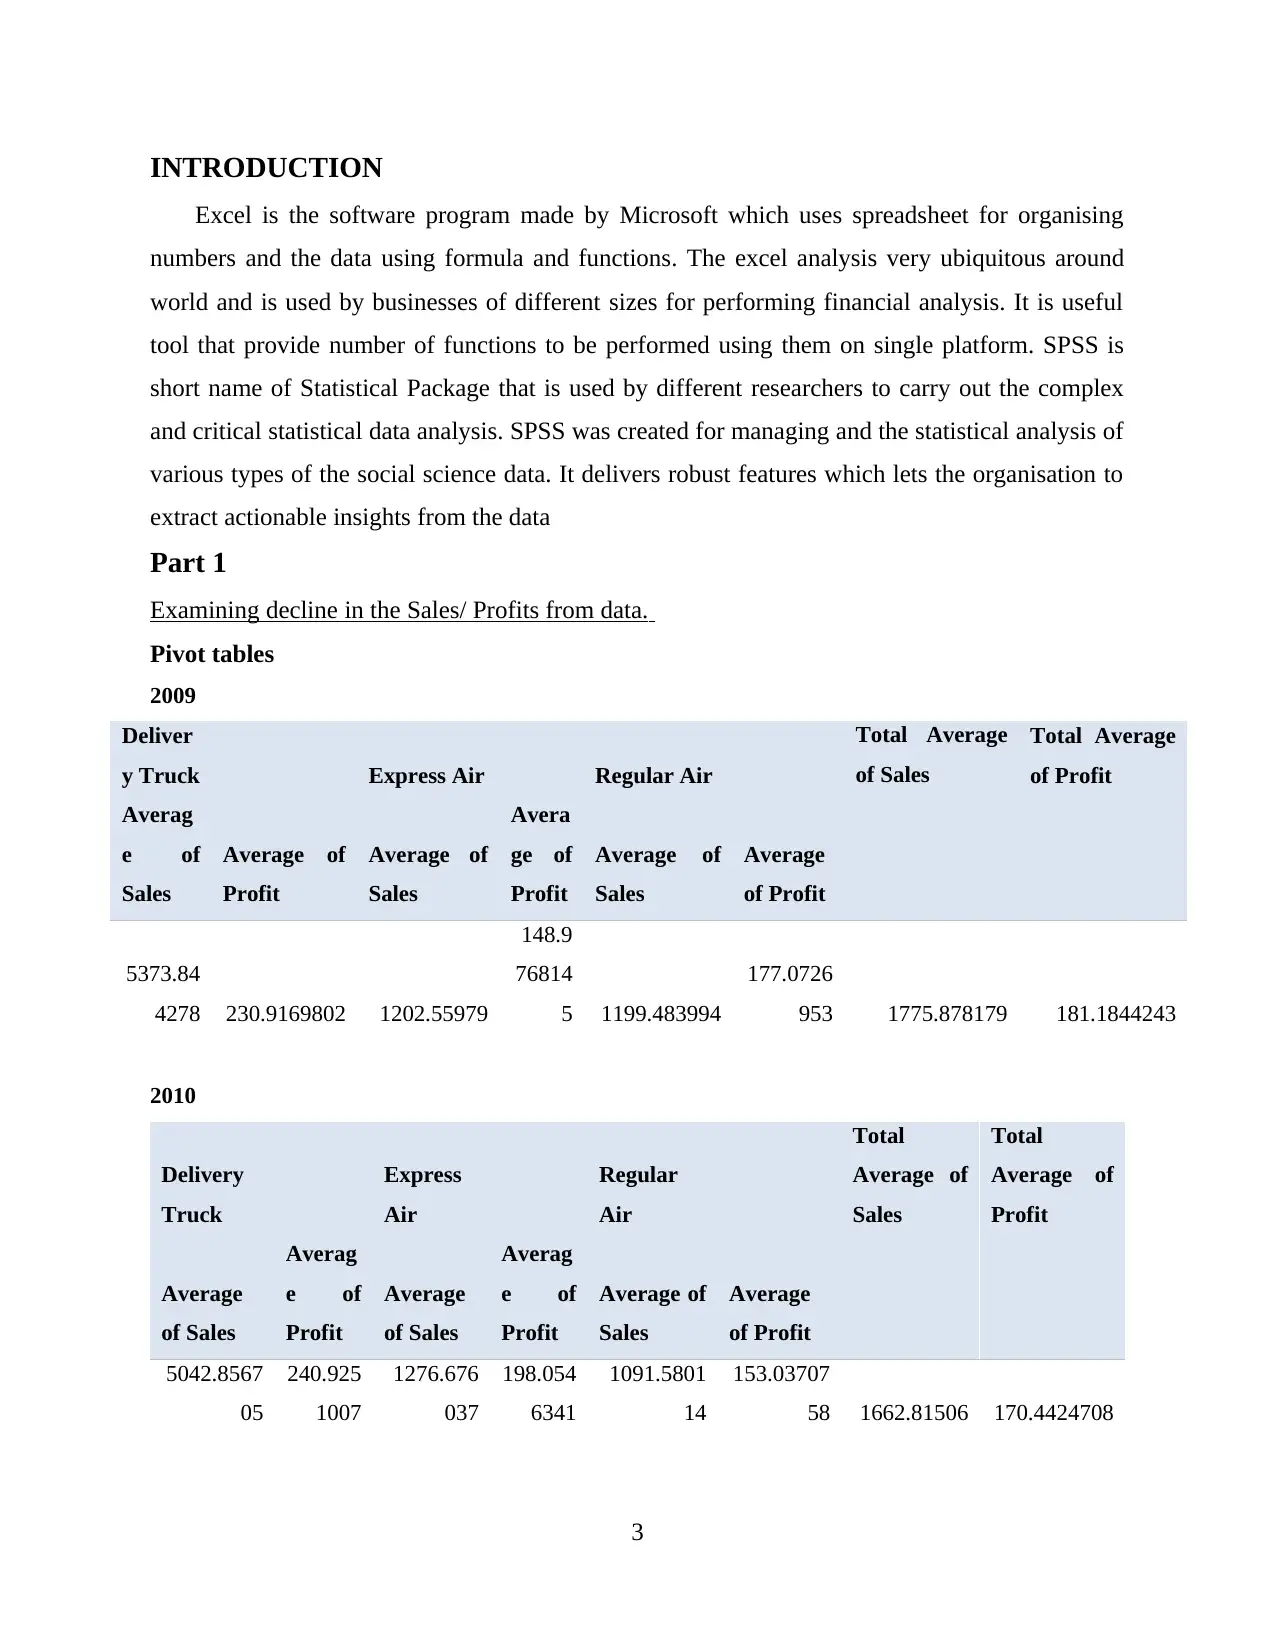
INTRODUCTION
Excel is the software program made by Microsoft which uses spreadsheet for organising
numbers and the data using formula and functions. The excel analysis very ubiquitous around
world and is used by businesses of different sizes for performing financial analysis. It is useful
tool that provide number of functions to be performed using them on single platform. SPSS is
short name of Statistical Package that is used by different researchers to carry out the complex
and critical statistical data analysis. SPSS was created for managing and the statistical analysis of
various types of the social science data. It delivers robust features which lets the organisation to
extract actionable insights from the data
Part 1
Examining decline in the Sales/ Profits from data.
Pivot tables
2009
Deliver
y Truck Express Air Regular Air
Total Average
of Sales
Total Average
of Profit
Averag
e of
Sales
Average of
Profit
Average of
Sales
Avera
ge of
Profit
Average of
Sales
Average
of Profit
5373.84
4278 230.9169802 1202.55979
148.9
76814
5 1199.483994
177.0726
953 1775.878179 181.1844243
2010
Delivery
Truck
Express
Air
Regular
Air
Total
Average of
Sales
Total
Average of
Profit
Average
of Sales
Averag
e of
Profit
Average
of Sales
Averag
e of
Profit
Average of
Sales
Average
of Profit
5042.8567
05
240.925
1007
1276.676
037
198.054
6341
1091.5801
14
153.03707
58 1662.81506 170.4424708
3
⊘ This is a preview!⊘
Do you want full access?
Subscribe today to unlock all pages.
Trusted by 1+ million students worldwide
2011
Delivery
Truck Express Air Regular Air
Total Average of
Sales
Total
Average of
Profit
Average of
Sales
Average of
Profit
Average of
Sales
Average of
Profit
Average of
Sales
Average of
Profit
5634.580167 351.9902281 1000.050176 114.9705818 1145.915478 175.4247671 1716.68918 190.3455956
2012
Average
of Sales
Average of
Profit
Total
average of
Sales Total Average of Profit
Delivery
Truck
Expres
s Air
Reg
ula
r
Air
Delivery
Truck
Expres
s Air
Re
gul
ar
Ai
r
5274.782
1312.59
1
119
0.5
8
137.567766
3
218.67
89604
16
0.4
96
43
26 1767.953 162.9134776
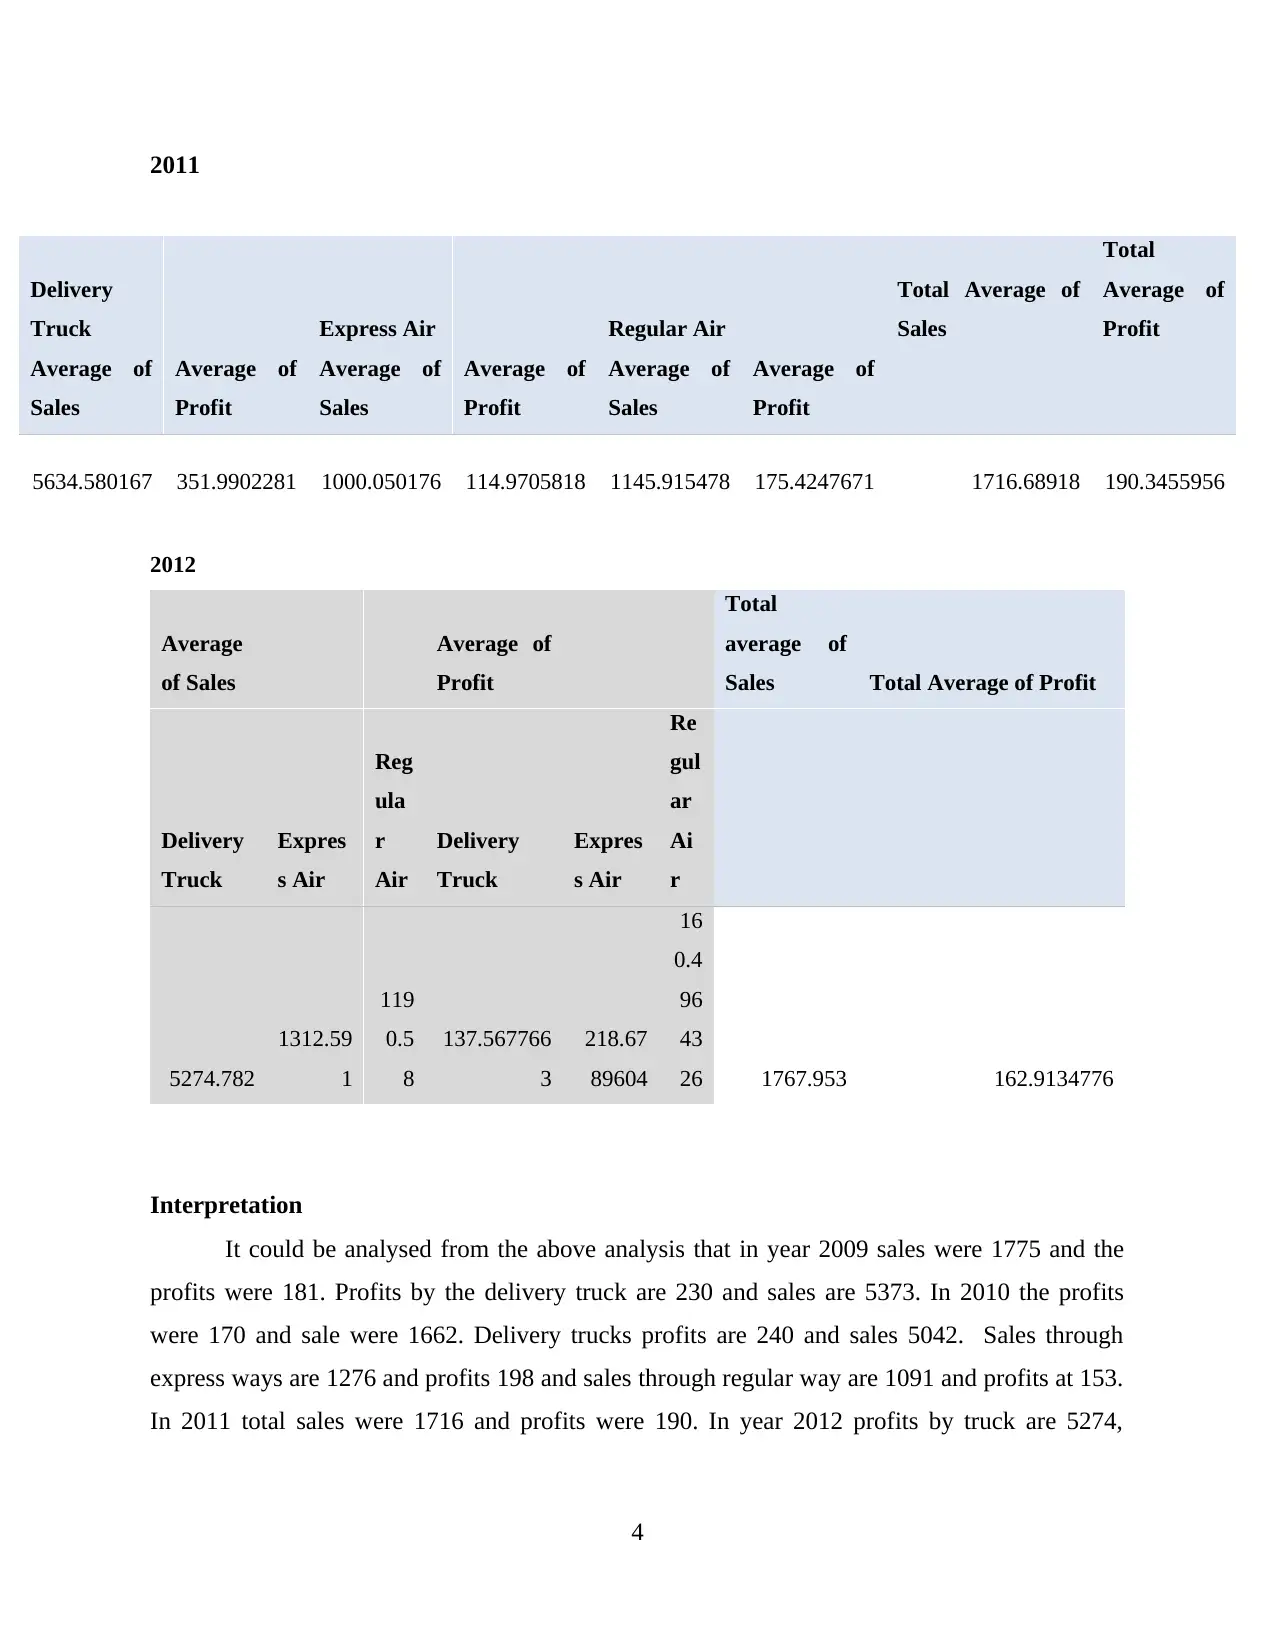
Interpretation
It could be analysed from the above analysis that in year 2009 sales were 1775 and the
profits were 181. Profits by the delivery truck are 230 and sales are 5373. In 2010 the profits
were 170 and sale were 1662. Delivery trucks profits are 240 and sales 5042. Sales through
express ways are 1276 and profits 198 and sales through regular way are 1091 and profits at 153.
In 2011 total sales were 1716 and profits were 190. In year 2012 profits by truck are 5274,
4
Delivery
Truck Express Air Regular Air
Total Average of
Sales
Total
Average of
Profit
Average of
Sales
Average of
Profit
Average of
Sales
Average of
Profit
Average of
Sales
Average of
Profit
5634.580167 351.9902281 1000.050176 114.9705818 1145.915478 175.4247671 1716.68918 190.3455956
2012
Average
of Sales
Average of
Profit
Total
average of
Sales Total Average of Profit
Delivery
Truck
Expres
s Air
Reg
ula
r
Air
Delivery
Truck
Expres
s Air
Re
gul
ar
Ai
r
5274.782
1312.59
1
119
0.5
8
137.567766
3
218.67
89604
16
0.4
96
43
26 1767.953 162.9134776
Interpretation
It could be analysed from the above analysis that in year 2009 sales were 1775 and the
profits were 181. Profits by the delivery truck are 230 and sales are 5373. In 2010 the profits
were 170 and sale were 1662. Delivery trucks profits are 240 and sales 5042. Sales through
express ways are 1276 and profits 198 and sales through regular way are 1091 and profits at 153.
In 2011 total sales were 1716 and profits were 190. In year 2012 profits by truck are 5274,
4
Paraphrase This Document
Need a fresh take? Get an instant paraphrase of this document with our AI Paraphraser
express air is 1312 and regular air is 1190. While average profits of delivery truck are 137,
express air 218 and regular air at 160. Total average sales were 1767 and profits were 162.
There is increase in the profits in 2009 & 2011 while decrease is seen in 2010 and 2012 (Safari
and et.al., 2019).
Excel in pre-processing the data
Data pre-processing is important step of data mining process. Garbage in and garbage out
is applicable to the data mining. The methods of data gathering are controlled loosely resulting in
the out of the range values, impossible combinations of data, missing values etc. Data analysis
for such data is not screened carefully for these problems could result in misleading outcomes.
Therefore, quality of the data and representation is done prior to running the analysis. Data pre-
processing is important phase of the machine learning projects. Pre-processing helps in
identifying the errors or mistakes that are occurring in the analysis. It helps to assess the results
and then the presentation of the data could be designed in most appropriate manner. The pre-
processing is also useful to general presentation of the data in effective manner and to draw more
accurate results.
Analysing data in excel
Excel is the software that is mainly used for analysing different data sets. There are
various methods that could be used for analysing the data. Users choose the method depending
on the type of data and the finding they want to draw. In general sense the most of the data are
analysed using the excel. There are number of operations that could be performed in excel to
derive the results (Majumder, Behera and Subramanian, 2016). The company could use the excel
to analyse the trends of sale over the given period of time in both terms of percentage and also in
the graphical presentation. On the basis of such analysis important business decisions are taken.
At higher levels it is also used in forecasting the future sales and expenses based on prior data.
Also this could be used for assessing whether the business has earned profits or has suffered
losses. It could provide the business different analytical tools that provide with accurate results
and outcomes to take future decisions.
Statisticians use it for computing the mean, median, mode and other results in their
research data. They also carry out regressions and other processes that enable to analyse the data.
Analysis could be considered as the primary use of excel after recording the data. It is used in
almost all the fields to draw correct decisions and take future course of action.
5
Visualising data in excel
With the increase in use of excel there has been continuous increase in the techniques of
data analysis. Researches were carried out to assess the requirements of different users to
upgrade the software. Along with this correlation and regression are considered as advanced
excel function for drawing the results. The data analysis is necessary for presenting the data in
graphical and tabular format and also for visualising the data. The data visualisation are useful
for identifying patterns and trends and for communicating the outcomes to the audiences in the
proper way. The data visualisations is useful function of the excel. It could be seen that number
of charts and tables which are available in the excel sheets like charts, scatter, line etc for
presenting the data in adequate manner. The purpose of data visualisation is making the data to
look easy that could be understood by everyone. It is used for displayng the trends, results and
finding of the analysis. Data visualisation could be performed using different options as required
by the user for presenting the data. For instance, the increase in sales level could be presented by
graphs, line graphs or even trend line above the bar graphs showing the growth and movement
during the defined period.
The users could identify easily what are the outcomes and results by using the data
visualisation. It makes the data simplified to considerable extent and enables quick decision
making by the managers and other people. With the upgrades the data visualisation tools are
coming that are making presentation of data more attractive and useful.
Lookup Function
The function is used for performing the match function between one column or range and
return corresponding values from other single column or range. When value in single column or
row is to be identified in another column or row lookup function is used (Chen and et.al., 2018).
IF function
It is a common function in the excel that allows in making logical comparisons between the
value with what is expected. This function could have 2 results. If condition is satisfied
comparison is true else false.
Pivot tables
The pivot table in excel is used for different purposes like sorting, summarising,
grouping, counting, average or total of data stored in the table. The function allows
6
⊘ This is a preview!⊘
Do you want full access?
Subscribe today to unlock all pages.
Trusted by 1+ million students worldwide
transformation of the rows to columns and columns to rows. It also allows the grouping of
different fields and to use advanced functions over them.
Charts
Charts are used for communicating the information of data graphically. It allows the
audience to assess the outcomes behind numbers. They are used for showing comparisons and
the trends in better and simpler way.
Graphs
The use of graphs is moreover same in excel as both are used to represent the data
graphically. It is used for presenting the ups, downs or trends of the data in effective and
understandable manner.
PART 2
2.1 Example of clustering
7
Paraphrase This Document
Need a fresh take? Get an instant paraphrase of this document with our AI Paraphraser
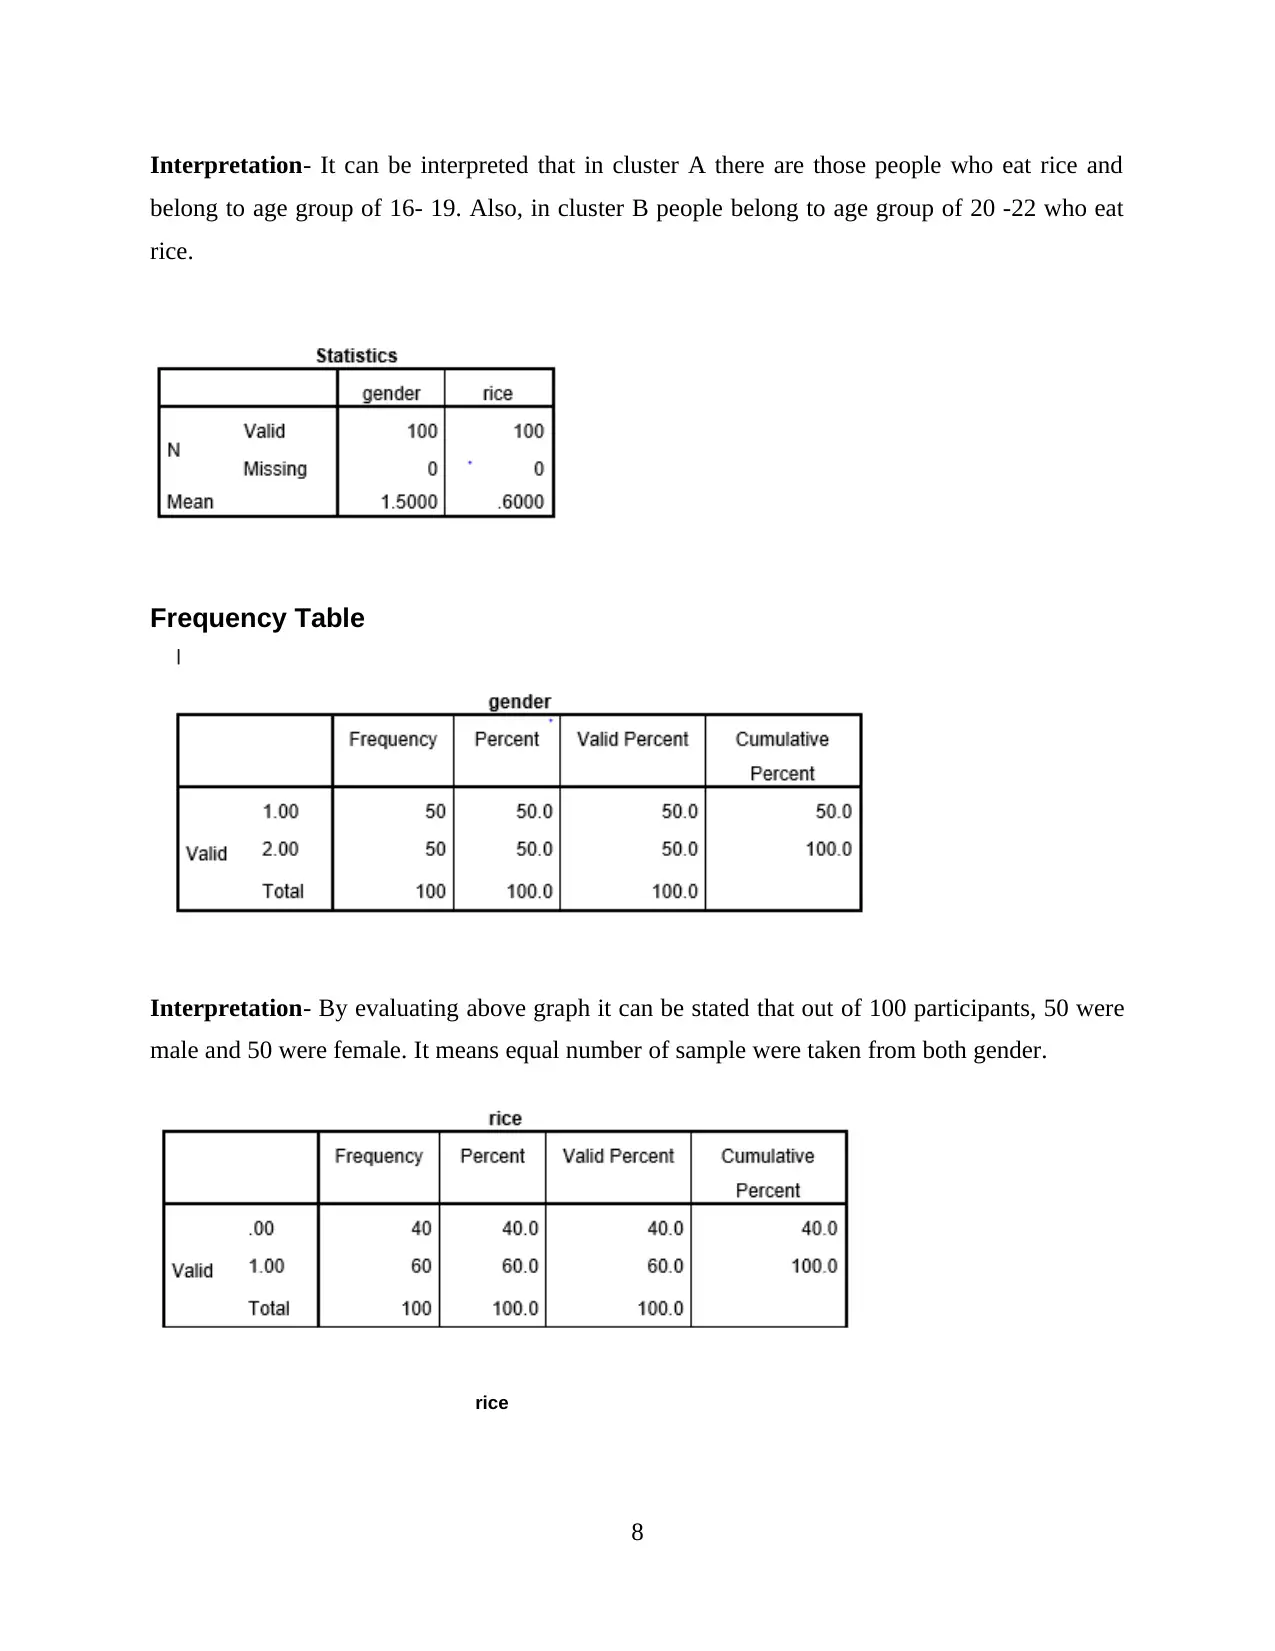
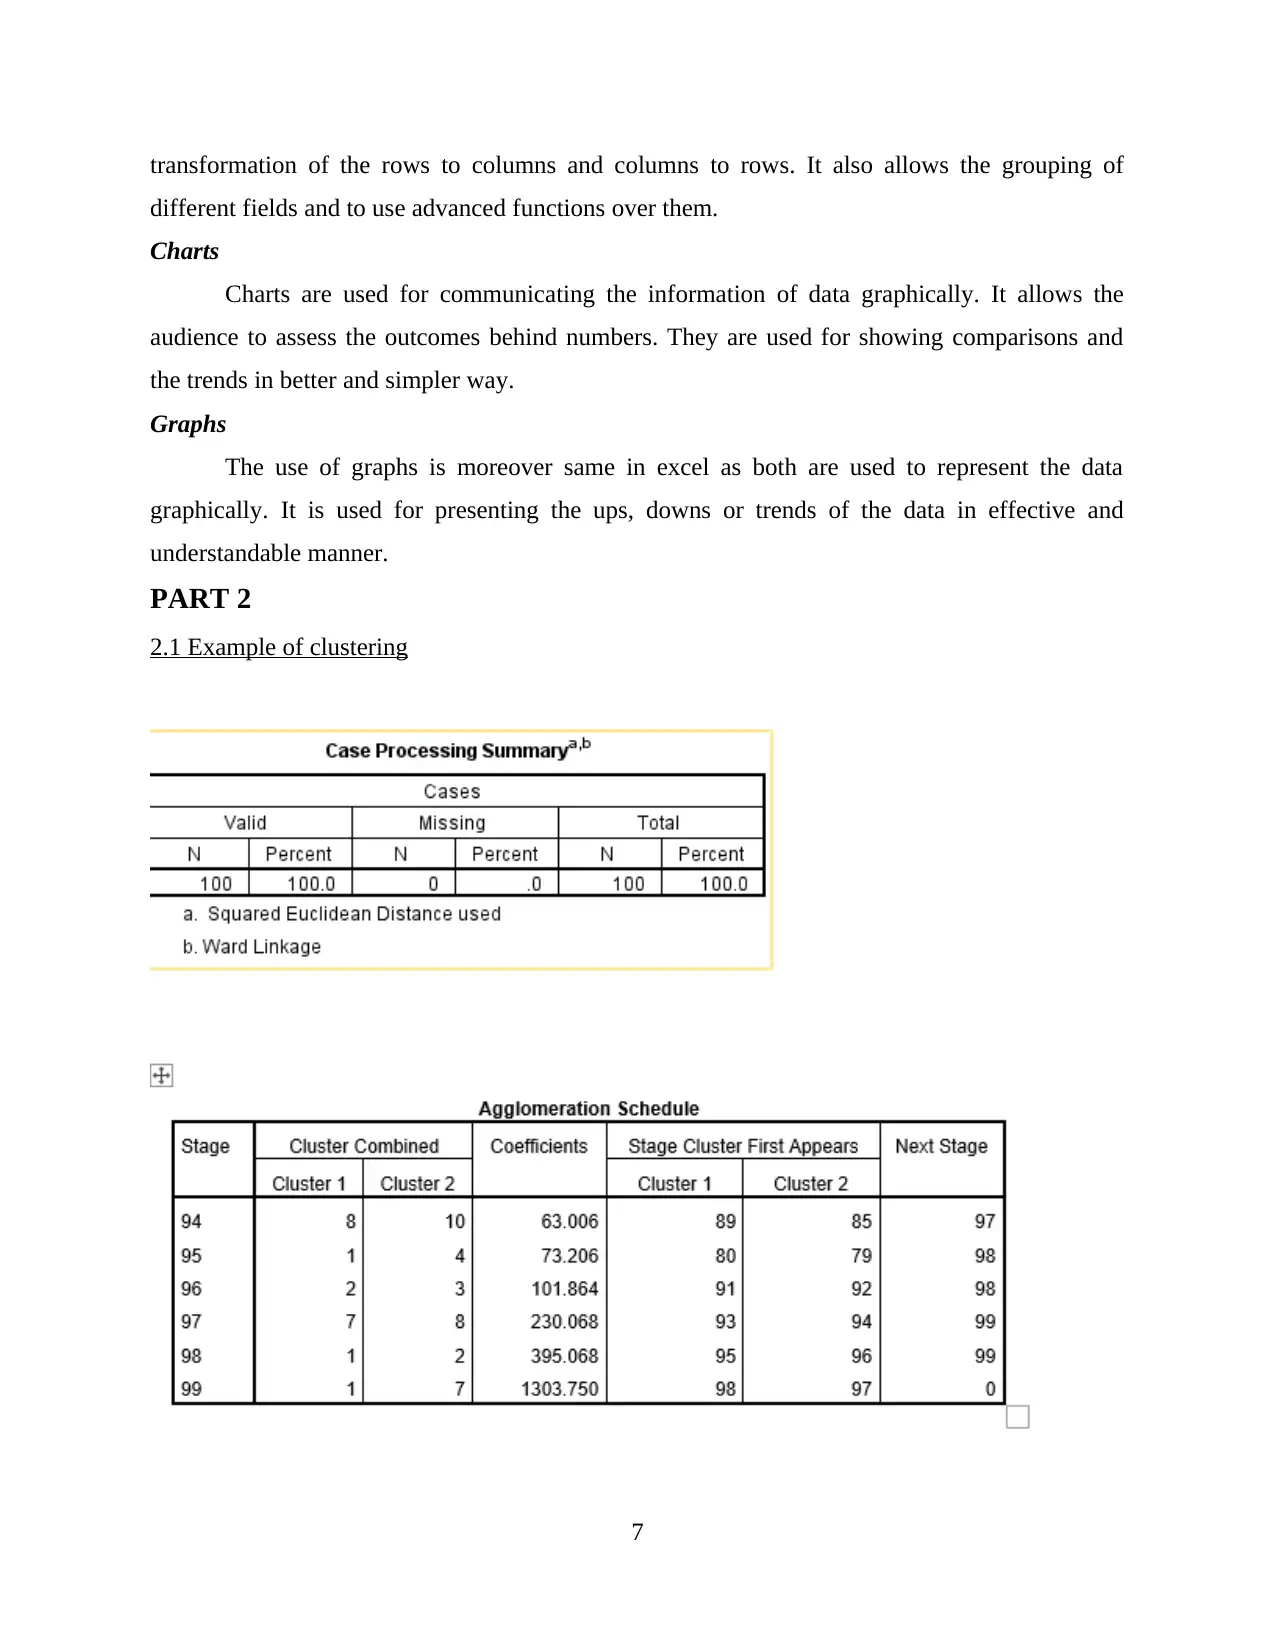
Interpretation- It can be interpreted that in cluster A there are those people who eat rice and
belong to age group of 16- 19. Also, in cluster B people belong to age group of 20 -22 who eat
rice.
Frequency Table
Interpretation- By evaluating above graph it can be stated that out of 100 participants, 50 were
male and 50 were female. It means equal number of sample were taken from both gender.
rice
8
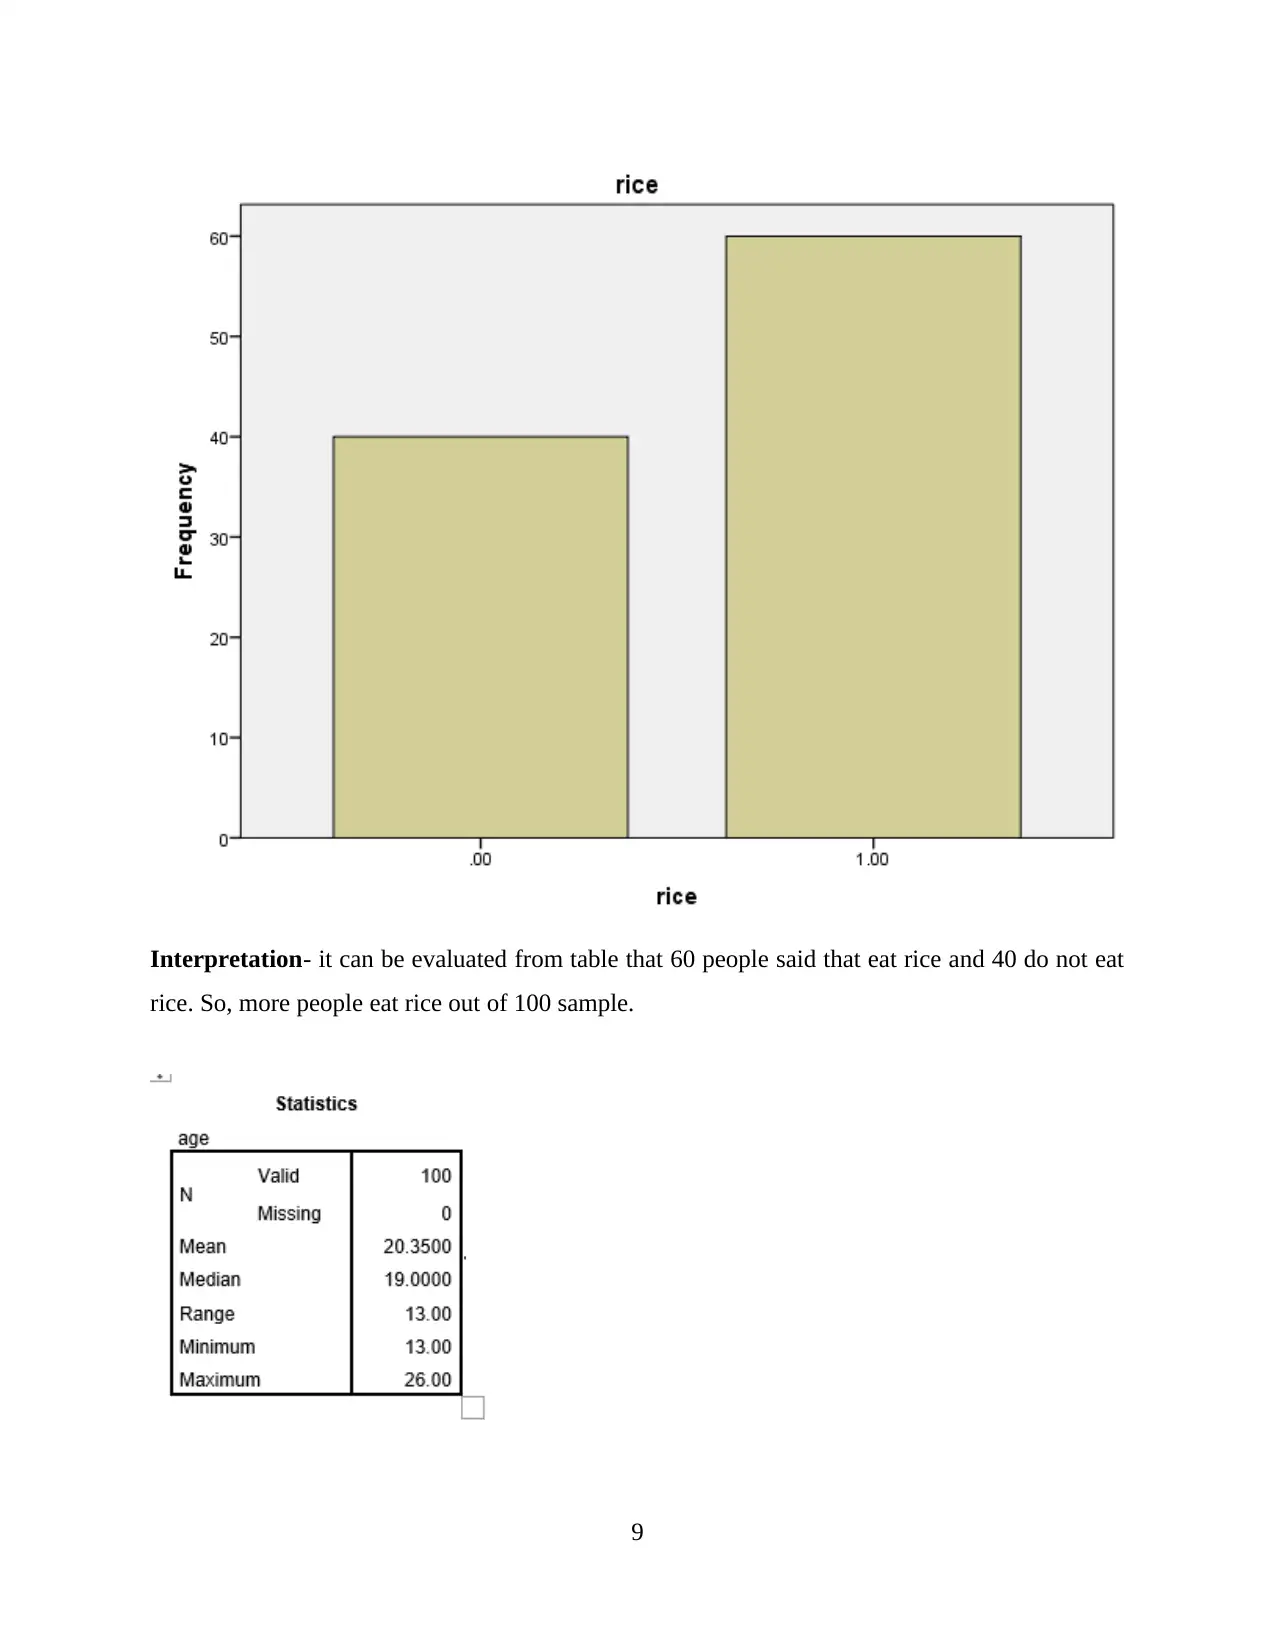
Interpretation- it can be evaluated from table that 60 people said that eat rice and 40 do not eat
rice. So, more people eat rice out of 100 sample.
9
rice. So, more people eat rice out of 100 sample.
9
⊘ This is a preview!⊘
Do you want full access?
Subscribe today to unlock all pages.
Trusted by 1+ million students worldwide
10
Paraphrase This Document
Need a fresh take? Get an instant paraphrase of this document with our AI Paraphraser
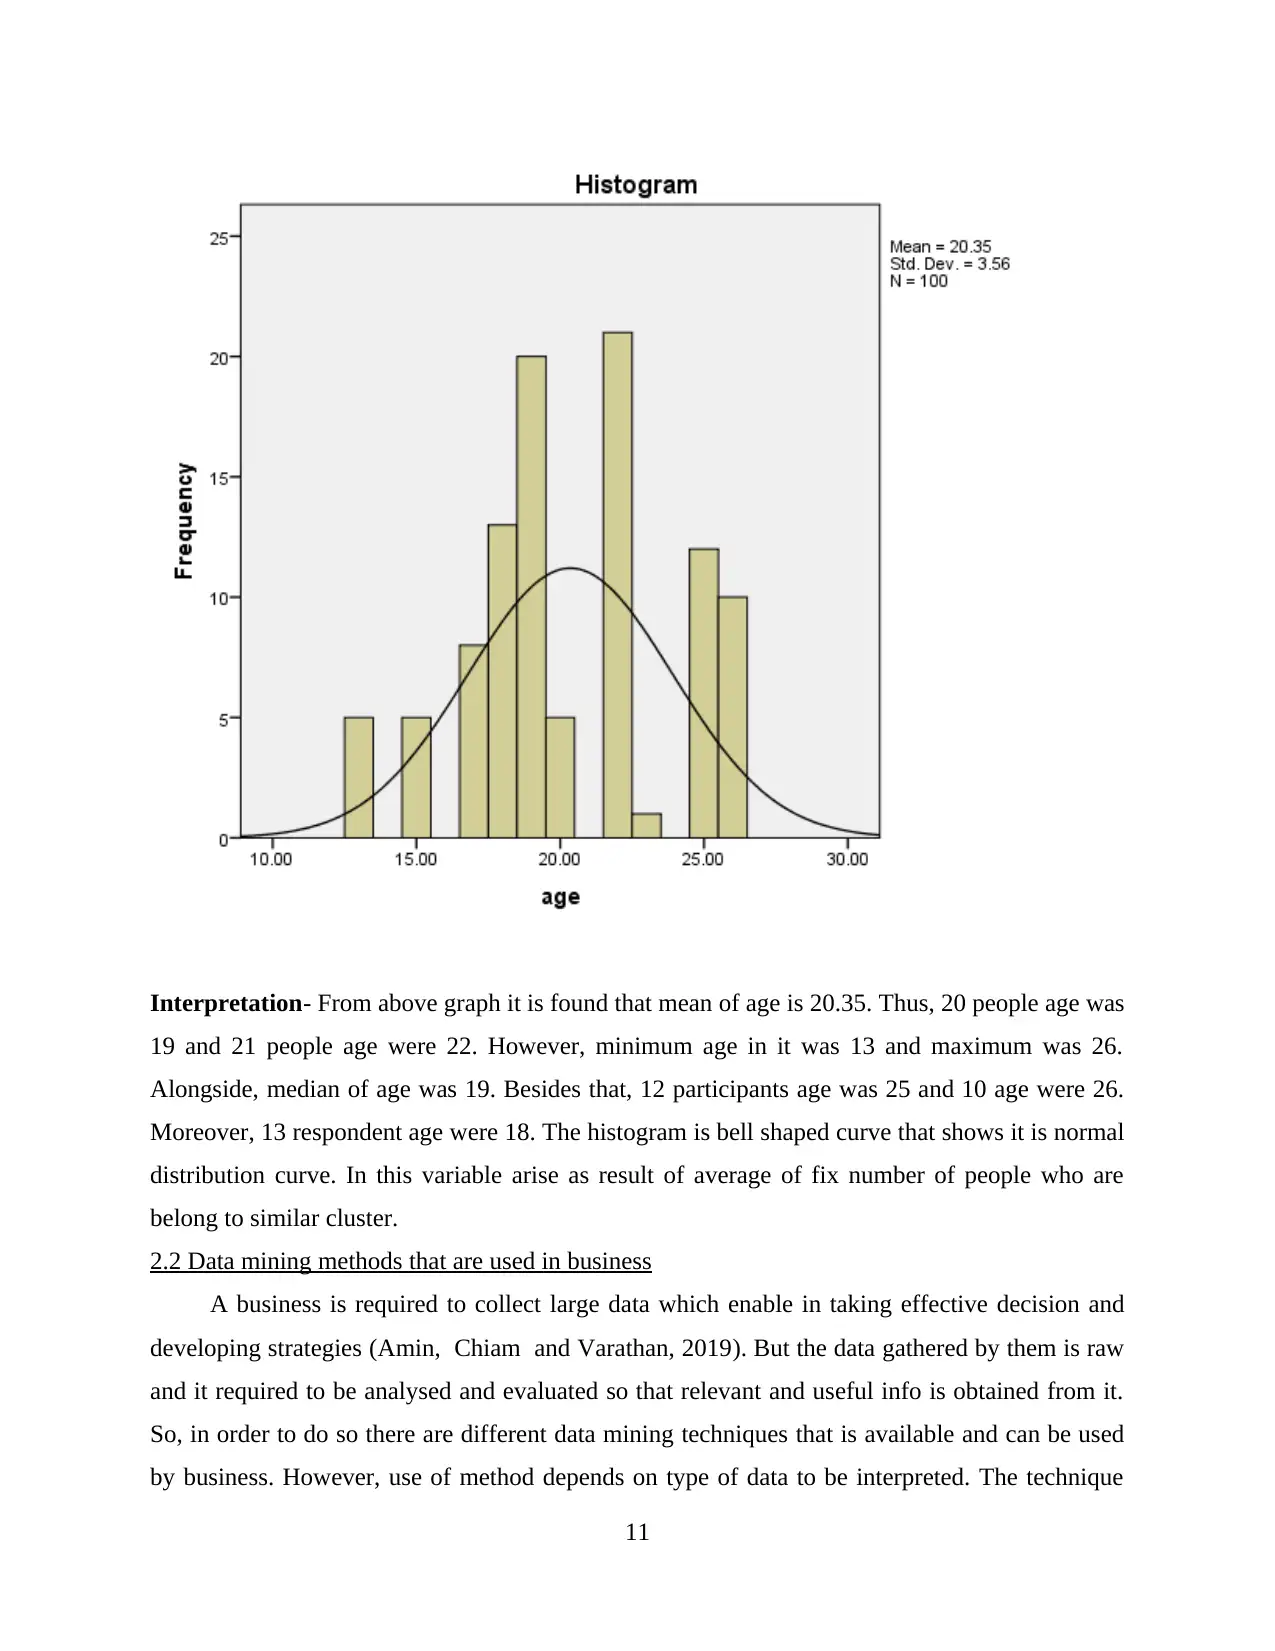
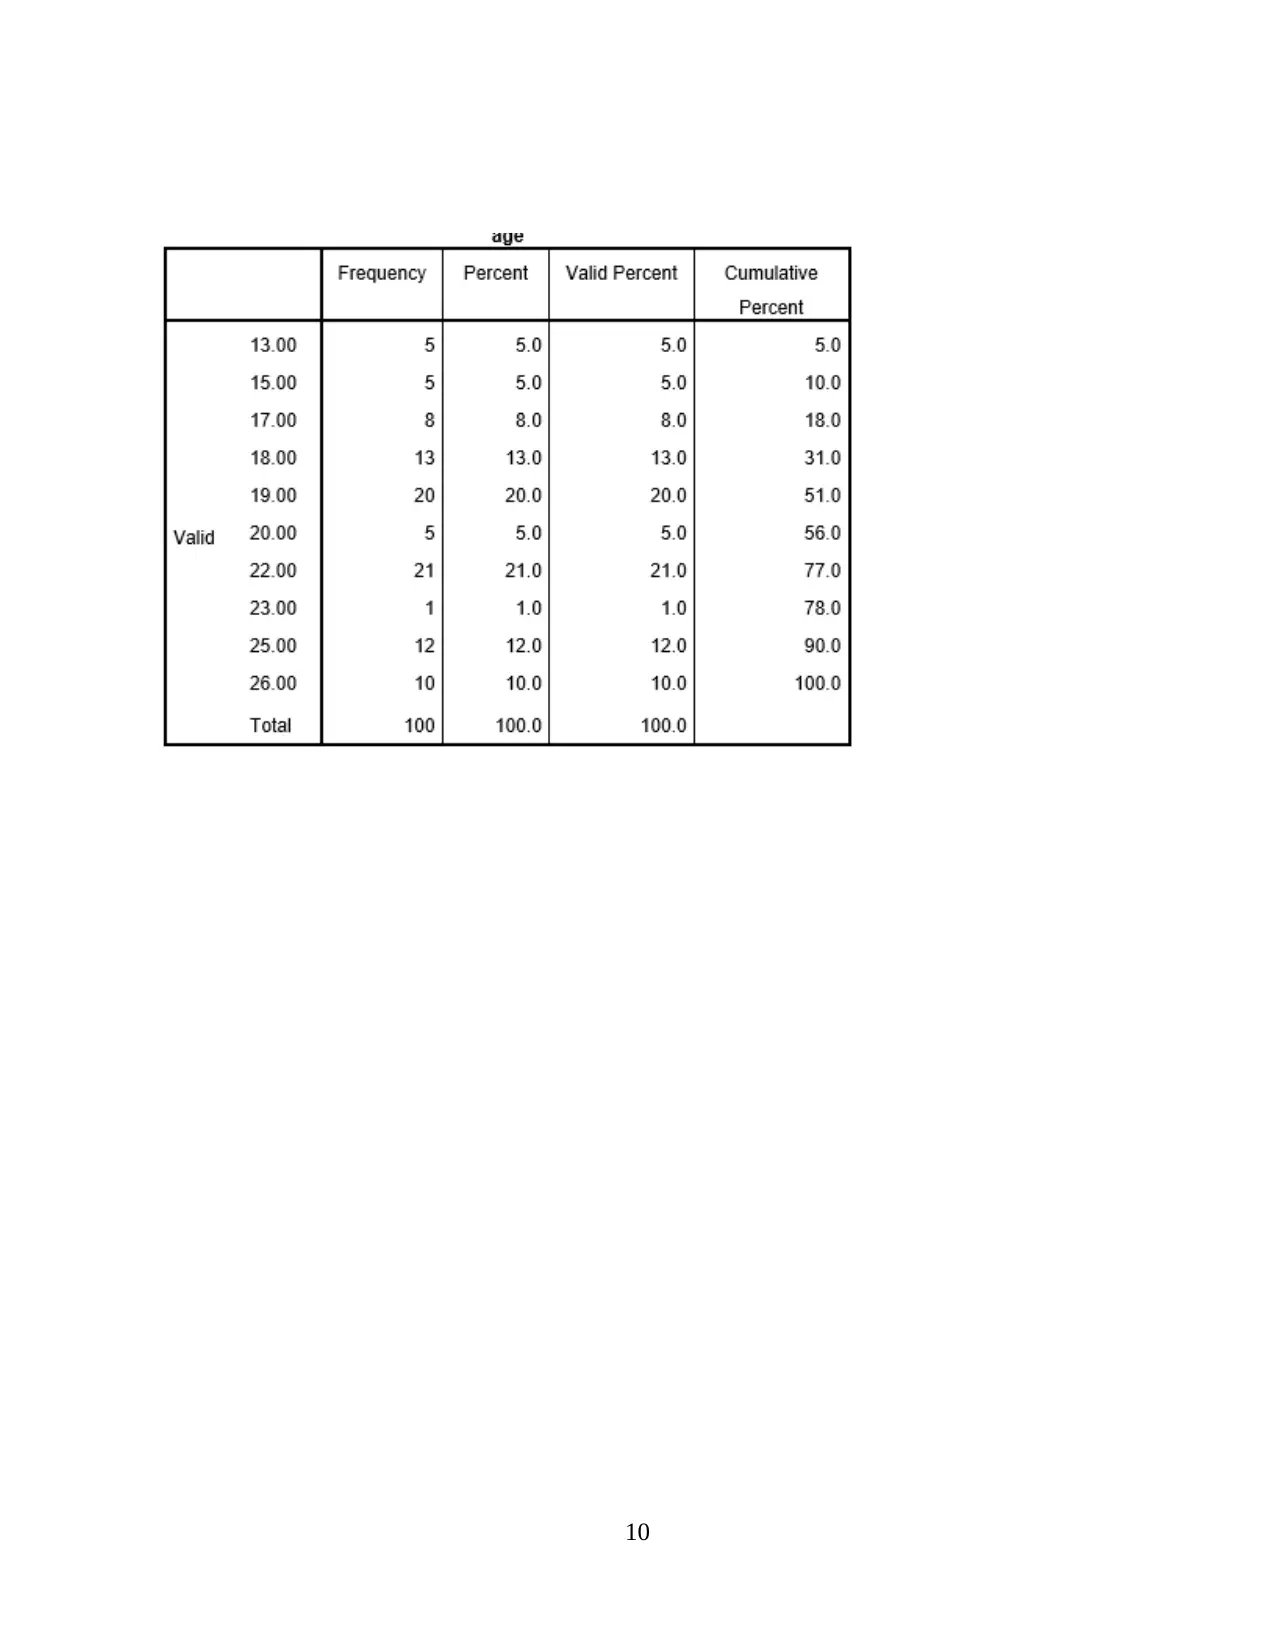
Interpretation- From above graph it is found that mean of age is 20.35. Thus, 20 people age was
19 and 21 people age were 22. However, minimum age in it was 13 and maximum was 26.
Alongside, median of age was 19. Besides that, 12 participants age was 25 and 10 age were 26.
Moreover, 13 respondent age were 18. The histogram is bell shaped curve that shows it is normal
distribution curve. In this variable arise as result of average of fix number of people who are
belong to similar cluster.
2.2 Data mining methods that are used in business
A business is required to collect large data which enable in taking effective decision and
developing strategies (Amin, Chiam and Varathan, 2019). But the data gathered by them is raw
and it required to be analysed and evaluated so that relevant and useful info is obtained from it.
So, in order to do so there are different data mining techniques that is available and can be used
by business. However, use of method depends on type of data to be interpreted. The technique
11
enables in evaluating data in depth and obtaining relevant info from it. The techniques are
explained as below :
Classification analysis – the technique is useful in retrieving data from metadata. In this various
classes are made that is known as clusters (Ye, Adjeroh, and Iyengar, 2017). This enable in
finding out data which is having similar characteristics and then grouped into classes. Then,
different algo is applied in it to classify data. For instance – finding out fake e mail and message
through algorithm.
Association rule learning- In this relationship is identified between variables. This makes it easy
to find out trends and pattern in it. Basically, it is used to find out customer decision making
process in buying a product. With that effective strategies are developed. for example- design of
product, change in features of it, etc. However, developer use the technique in machine learning.
Clustering analysis- The technique helps in gathering of data object which is included in same
cluster. With that it is useful in finding out association between two objects in cluster. Here,
association is high when objects are from same group and vice versa. Therefore, it is used in
creating persona of customers and their characteristics (Injadat, Salo, and Nassif, 2016).
Regression analysis- the technique helps in identifying whether there exists relationship between
two dependent and independent variables or not. so, on basis of that data is processed and
forecasting is done.
Anomaly- it is known as outliners division etc. which exist in dataset and does not match with
expected behavior. For instance- used to find out fraud detection system monitoring etc. hence, it
states that something has occurred in data set that must be solved.
2.3 Advantage and disadvantage of using SPSS over Excel
The SPSS and excel are two methods of analysing data. They both contain several
functions which is different and provide varied outcomes. They both helps in generating useful
outcomes and graphs which can be used in decision making. But there is advantage of using
SPSS over excel which is discussed as :
Easy access to stats – SPSS consists of in built and default functions by which data is interpreted.
Through that, there is easy access of stats as compared to MS Excel. Also, SPSS is fast and
provide more accurate outcomes than excel (Souri, and Hosseini, 2018).
Different tests are used in SPSS- There are various tests in SPSS like t test, anova, regression,
etc. So, with that it becomes easy to determine relationship between variables. These all features
12
⊘ This is a preview!⊘
Do you want full access?
Subscribe today to unlock all pages.
Trusted by 1+ million students worldwide
1 out of 16
Related Documents


Your All-in-One AI-Powered Toolkit for Academic Success.
+13062052269
info@desklib.com
Available 24*7 on WhatsApp / Email
![[object Object]](/_next/static/media/star-bottom.7253800d.svg)
Unlock your academic potential
Copyright © 2020–2026 A2Z Services. All Rights Reserved. Developed and managed by ZUCOL.