LCBB 5000: Data Handling and Business Intelligence Report
VerifiedAdded on 2023/01/12
|16
|3808
|35
Report
AI Summary
This report delves into the realms of data handling and business intelligence, commencing with an exploration of current trends in data warehousing, business intelligence, and data mining. It then undertakes a detailed analysis of sales and profit declines over time, utilizing provided data to identify key factors. The report proceeds to evaluate the efficacy of Excel for data pre-processing and visualization, followed by an examination of the WEKA tool, including its conjunction and application through a practical example. Furthermore, it outlines common data mining methods applicable to business scenarios, supported by real-world examples, and concludes with a comparative analysis of the advantages and disadvantages of WEKA over Excel. The report leverages provided data to illustrate concepts and provide actionable insights, catering to students seeking to enhance their understanding of data analysis and business intelligence.

Data Handling and Business
Intelligence
Intelligence
Paraphrase This Document
Need a fresh take? Get an instant paraphrase of this document with our AI Paraphraser
INTRODUCTION...........................................................................................................................3
PART 1............................................................................................................................................3
Describing the current trend in Data Warehousing, business intelligence and data mining.......3
Determining the decline in sales and profit over the years..........................................................4
Evaluate the use of excel for pre- processing the data and its visualizing the data.....................7
PART 2..........................................................................................................................................10
2.1 Describing the conjunction with Weka through an example...............................................10
2.2 Common data mining methods that can be used in business with real world examples.....12
2.3 Stating advantages and disadvantages of the WEKA over the excel..................................13
REFERENCES..............................................................................................................................15
INTRODUCTION
Data Handling is the process which is helps to make sure that research data is stored and
archived in a secure manner during and after the conclusion of every research. Therefore, in the
same manner, the current study will help to analyses the data which is already provided and
enhance the overall knowledge as well. Further, it is the scripting language which is also used in
order to transform the data in a knowledge and intelligence. Study will present the current trend
in data warehousing, business intelligence and data mining. Further, it will evaluate the use of
excel for pre- processing the data, analyzing the data through the figures and tables. In part-II,
report will describe working with Weka and then analyze the most common methods of data
which are used by the firm. Lastly, it will analyze the advantage and disadvantage of Weka tool
PART 1
Describing the current trend in Data Warehousing, business intelligence and data mining
Data mining, Business intelligence and data Warehousing are used by most of the
companies in order to gain high competitive advantage over a business. So, the current trends of
these three concepts are as mention below:
Data Warehousing: One of the finest trend which is run from 2019 onward for the
company. It means that a warehouse that is especially constructed by integrating the data from a
multiple heterogeneous sources which support the analytical reporting, structure and ad hoc
queries as well as help the company to take better decision (Déraspe and et.al., 2016). Basically
it is used for analytical purpose as well as for business reporting where a range of data is put in
consolidated manner that helps to provide solution.
Business Intelligence: This is refer to the technology and application which is used for
collection, integration analysis and presentation of business information. Further, its main
purpose is to provide support the business decision making (Larson and Chang, 2016). For
example, business intelligence technologies mainly includes the data warehouse and data
discovery tools in order to create a big data for the company which help to make better decision
and provide immediate solutions as well.
⊘ This is a preview!⊘
Do you want full access?
Subscribe today to unlock all pages.
Trusted by 1+ million students worldwide
Data Mining: Another biggest trend of this modern era which help top companies to turn
raw data into an useful information. Such that by using the software where its pattern is changes
in large batches of information so that business may learn much about the customers (Tan,
Steinbach and Kumar, 2016). Through this, many company also uses the best marketing
strategies which help to increase the sales as well as decrease cost. Therefore, another company
used this technology for manufacturing engineering, CRM and fraud detection. Overall, this
technique will help a business to increase the sales and enhance the overall financial performance
of a business.
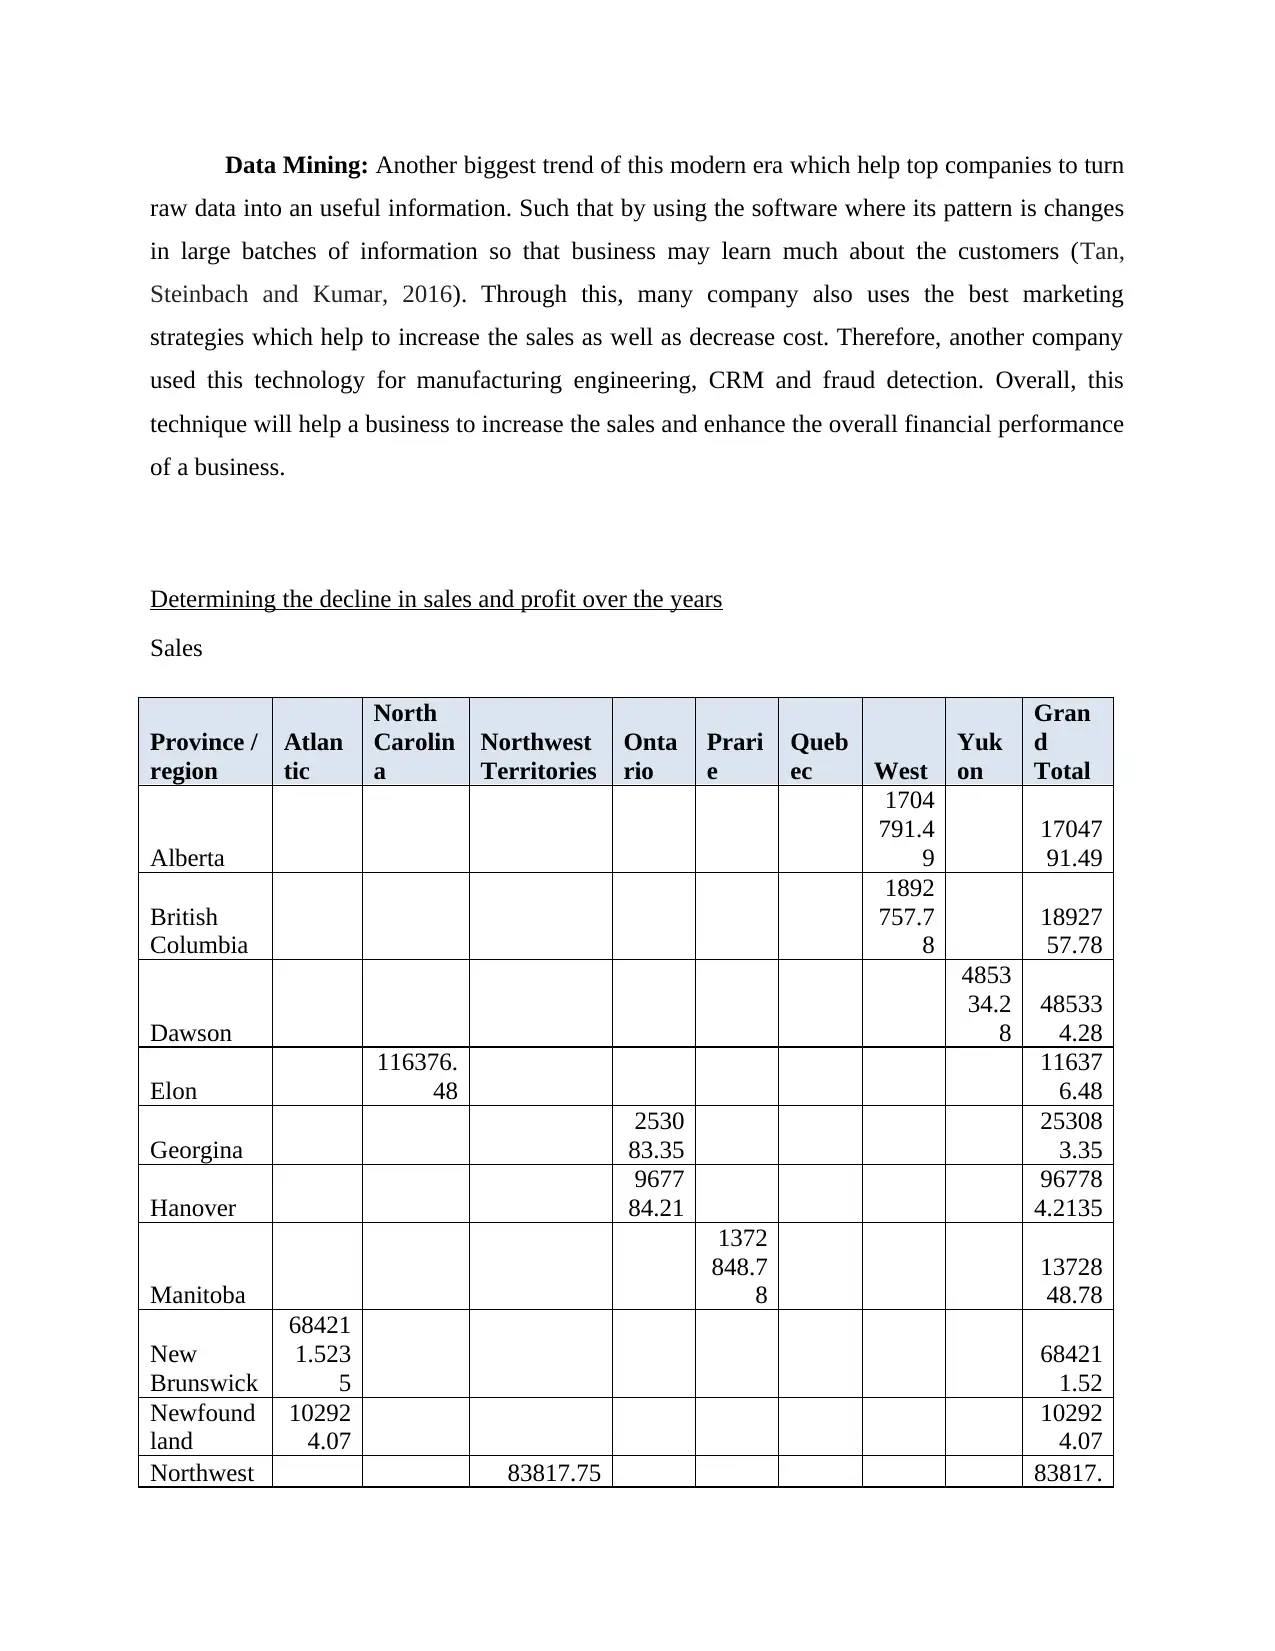
Determining the decline in sales and profit over the years
Sales
Province /
region
Atlan
tic
North
Carolin
a
Northwest
Territories
Onta
rio
Prari
e
Queb
ec West
Yuk
on
Gran
d
Total
Alberta
1704
791.4
9
17047
91.49
British
Columbia
1892
757.7
8
18927
57.78
Dawson
4853
34.2
8
48533
4.28
Elon
116376.
48
11637
6.48
Georgina
2530
83.35
25308
3.35
Hanover
9677
84.21
96778
4.2135
Manitoba
1372
848.7
8
13728
48.78
New
Brunswick
68421
1.523
5
68421
1.52
Newfound
land
10292
4.07
10292
4.07
Northwest 83817.75 83817.
raw data into an useful information. Such that by using the software where its pattern is changes
in large batches of information so that business may learn much about the customers (Tan,
Steinbach and Kumar, 2016). Through this, many company also uses the best marketing
strategies which help to increase the sales as well as decrease cost. Therefore, another company
used this technology for manufacturing engineering, CRM and fraud detection. Overall, this
technique will help a business to increase the sales and enhance the overall financial performance
of a business.
Determining the decline in sales and profit over the years
Sales
Province /
region
Atlan
tic
North
Carolin
a
Northwest
Territories
Onta
rio
Prari
e
Queb
ec West
Yuk
on
Gran
d
Total
Alberta
1704
791.4
9
17047
91.49
British
Columbia
1892
757.7
8
18927
57.78
Dawson
4853
34.2
8
48533
4.28
Elon
116376.
48
11637
6.48
Georgina
2530
83.35
25308
3.35
Hanover
9677
84.21
96778
4.2135
Manitoba
1372
848.7
8
13728
48.78
New
Brunswick
68421
1.523
5
68421
1.52
Newfound
land
10292
4.07
10292
4.07
Northwest 83817.75 83817.
Paraphrase This Document
Need a fresh take? Get an instant paraphrase of this document with our AI Paraphraser
Territories 75
Nova
Scotia
81772
9.36
81772
9.36
Ontario
1314
454.2
6
13144
54.26
Orangevill
e
5278
90.66
52789
0.66
Prince
Edward
Island
40938
3.25
40938
3.25
Quebec
1510
195.0
8
15101
95.08
Saskache
wan
1464
455.8
2
14644
55.82
Waterloo
7170
29.58
71702
9.58
Whitehors
e
4905
33.0
9
49053
3.09
Grand
Total
20142
48.20
116376.
48 83817.75
3780
242.0
6
2837
304.6
0
1510
195.0
8
3597
549.2
8
9758
67.3
7
14915
600.82
Interpretation: As per the above table, it is interpreted that the sales of Ontario is
highest i.e. 1314454.26. Further, the sale of Alberta is 170479, while British Columbia is
1892757.78. On the other side, Northwest Territories sale is lowest i.e. 83817.75.
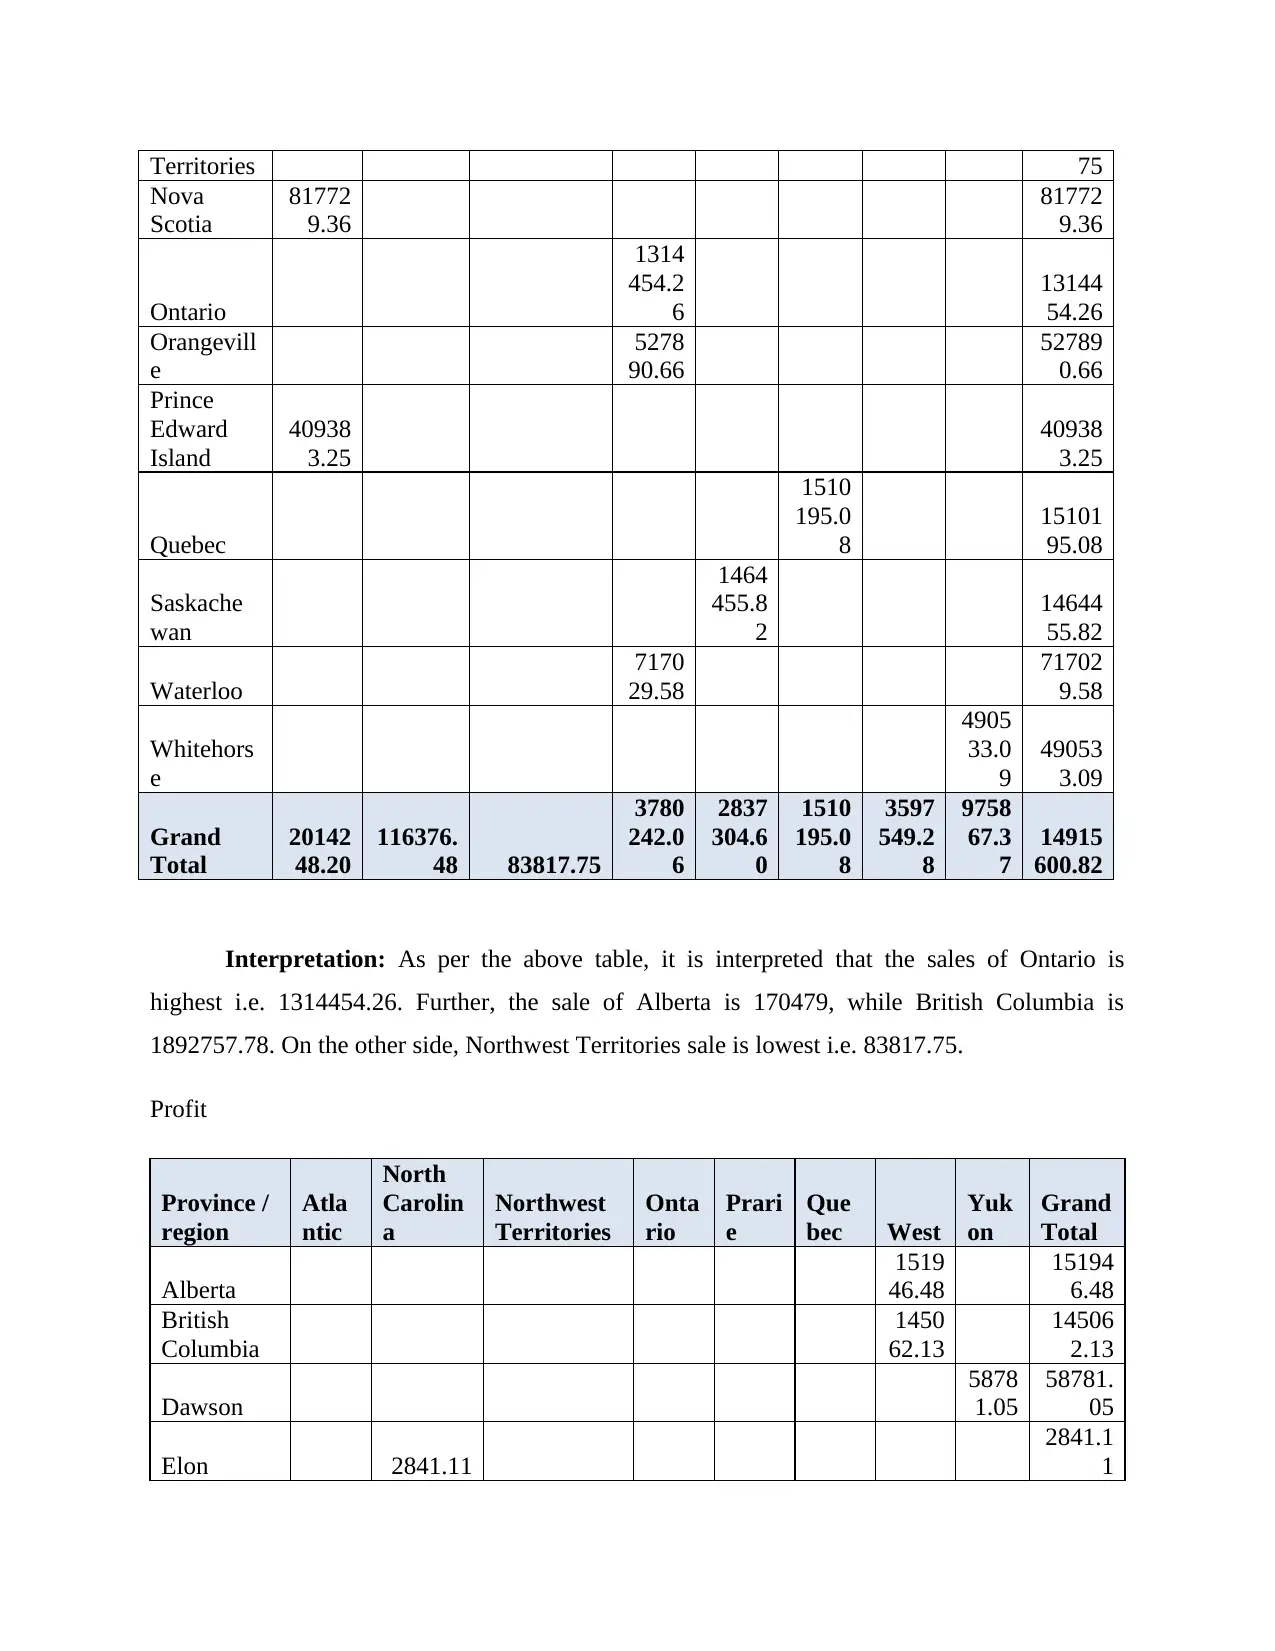
Profit
Province /
region
Atla
ntic
North
Carolin
a
Northwest
Territories
Onta
rio
Prari
e
Que
bec West
Yuk
on
Grand
Total
Alberta
1519
46.48
15194
6.48
British
Columbia
1450
62.13
14506
2.13
Dawson
5878
1.05
58781.
05
Elon 2841.11
2841.1
1
Nova
Scotia
81772
9.36
81772
9.36
Ontario
1314
454.2
6
13144
54.26
Orangevill
e
5278
90.66
52789
0.66
Prince
Edward
Island
40938
3.25
40938
3.25
Quebec
1510
195.0
8
15101
95.08
Saskache
wan
1464
455.8
2
14644
55.82
Waterloo
7170
29.58
71702
9.58
Whitehors
e
4905
33.0
9
49053
3.09
Grand
Total
20142
48.20
116376.
48 83817.75
3780
242.0
6
2837
304.6
0
1510
195.0
8
3597
549.2
8
9758
67.3
7
14915
600.82
Interpretation: As per the above table, it is interpreted that the sales of Ontario is
highest i.e. 1314454.26. Further, the sale of Alberta is 170479, while British Columbia is
1892757.78. On the other side, Northwest Territories sale is lowest i.e. 83817.75.
Profit
Province /
region
Atla
ntic
North
Carolin
a
Northwest
Territories
Onta
rio
Prari
e
Que
bec West
Yuk
on
Grand
Total
Alberta
1519
46.48
15194
6.48
British
Columbia
1450
62.13
14506
2.13
Dawson
5878
1.05
58781.
05
Elon 2841.11
2841.1
1
Georgina
2699
3.74
26993.
74
Hanover
1207
24.85
12072
4.85
Manitoba
1364
27.16
13642
7.16
New
Brunswick
1153
51.94
11535
1.94
Newfoundl
and
6885.
14
6885.1
4
Northwest
Territories 8307.05
8307.0
5
Nova
Scotia
8536
1.87
85361.
87
Ontario
1248
82.86
12488
2.86
Orangeville
7426
7.09
74267.
09
Prince
Edward
Island
3136
1.71
31361.
71
Quebec
1404
26.65
14042
6.65
Saskachew
an
1847
32.96
18473
2.96
Waterloo
9234
6.03
92346.
03
Whitehorse
1506
8.16
15068.
16
Grand
Total
2389
60.66 2841.11 8307.05
4392
14.57
3211
60.12
1404
26.65
2970
08.61
7384
9.21
15217
67.98
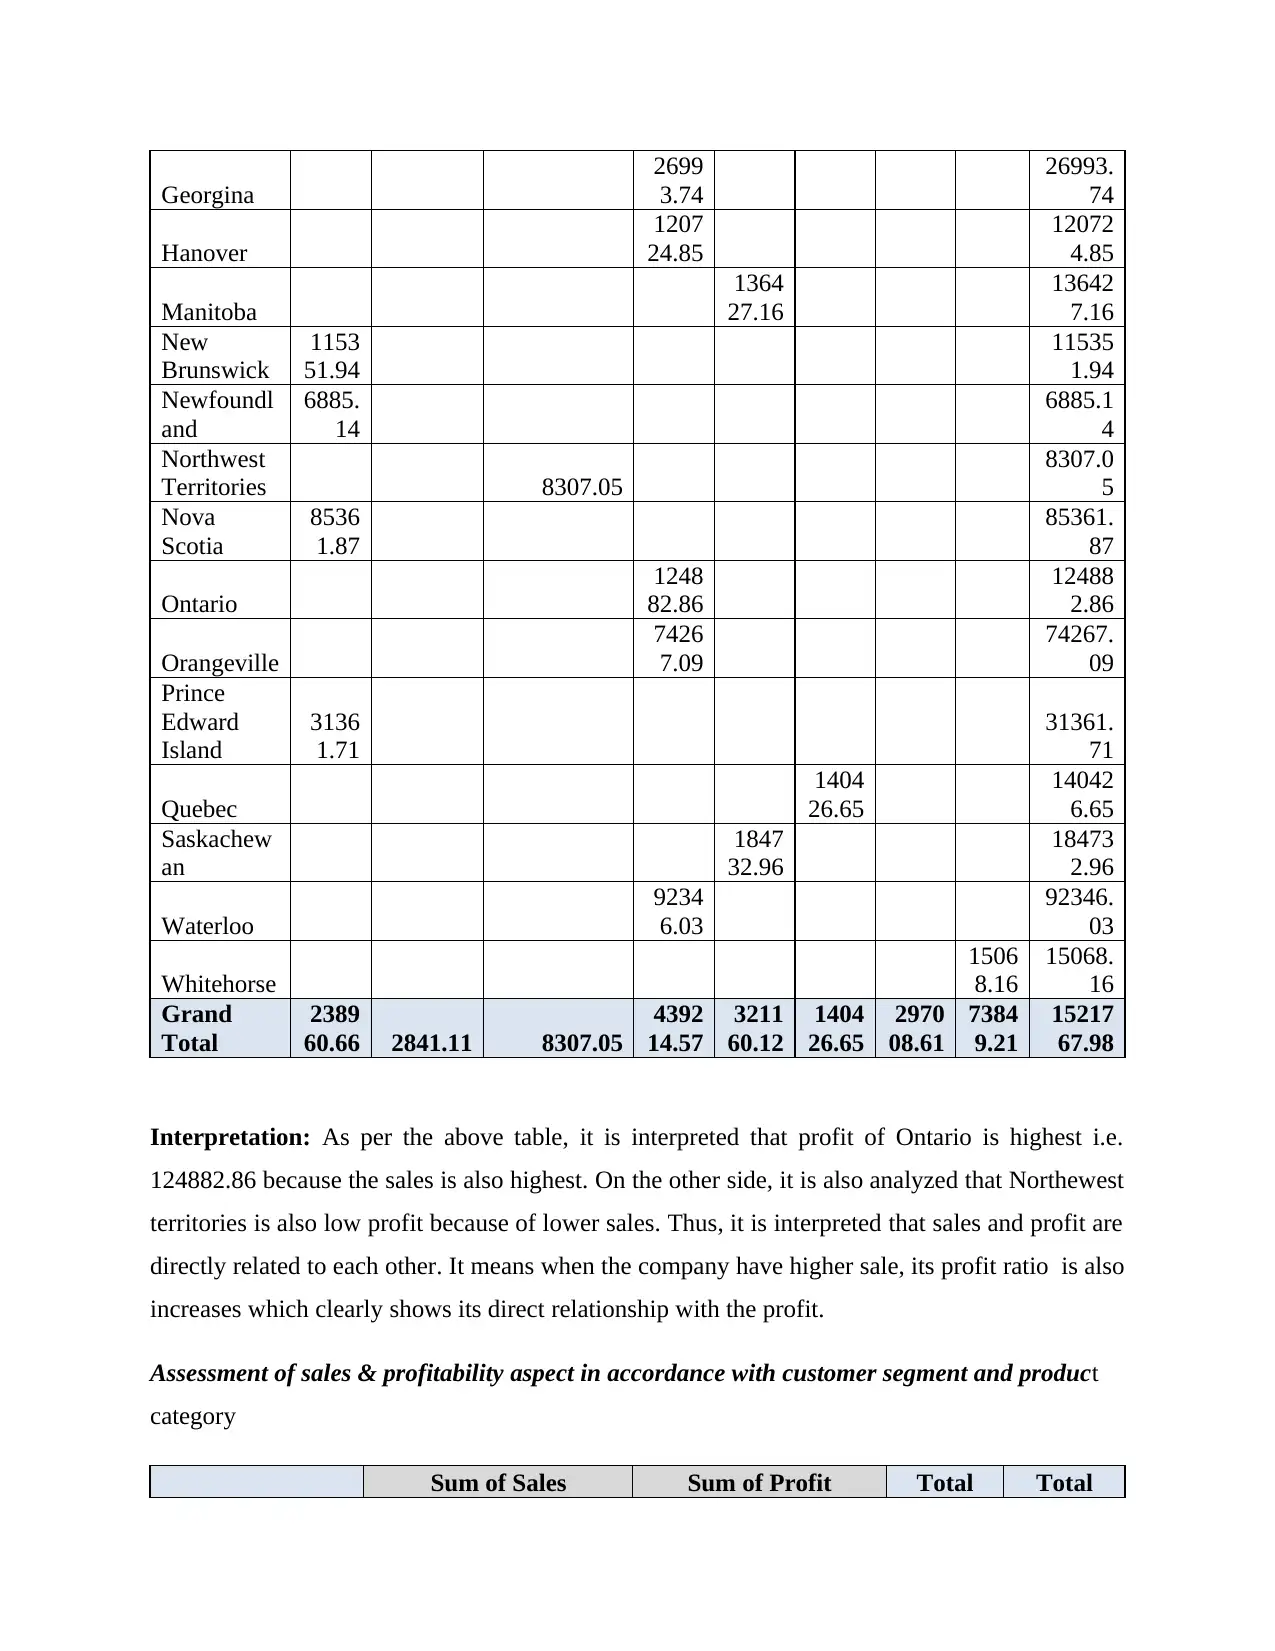
Interpretation: As per the above table, it is interpreted that profit of Ontario is highest i.e.
124882.86 because the sales is also highest. On the other side, it is also analyzed that Northewest
territories is also low profit because of lower sales. Thus, it is interpreted that sales and profit are
directly related to each other. It means when the company have higher sale, its profit ratio is also
increases which clearly shows its direct relationship with the profit.
Assessment of sales & profitability aspect in accordance with customer segment and product
category
Sum of Sales Sum of Profit Total Total
2699
3.74
26993.
74
Hanover
1207
24.85
12072
4.85
Manitoba
1364
27.16
13642
7.16
New
Brunswick
1153
51.94
11535
1.94
Newfoundl
and
6885.
14
6885.1
4
Northwest
Territories 8307.05
8307.0
5
Nova
Scotia
8536
1.87
85361.
87
Ontario
1248
82.86
12488
2.86
Orangeville
7426
7.09
74267.
09
Prince
Edward
Island
3136
1.71
31361.
71
Quebec
1404
26.65
14042
6.65
Saskachew
an
1847
32.96
18473
2.96
Waterloo
9234
6.03
92346.
03
Whitehorse
1506
8.16
15068.
16
Grand
Total
2389
60.66 2841.11 8307.05
4392
14.57
3211
60.12
1404
26.65
2970
08.61
7384
9.21
15217
67.98
Interpretation: As per the above table, it is interpreted that profit of Ontario is highest i.e.
124882.86 because the sales is also highest. On the other side, it is also analyzed that Northewest
territories is also low profit because of lower sales. Thus, it is interpreted that sales and profit are
directly related to each other. It means when the company have higher sale, its profit ratio is also
increases which clearly shows its direct relationship with the profit.
Assessment of sales & profitability aspect in accordance with customer segment and product
category
Sum of Sales Sum of Profit Total Total
⊘ This is a preview!⊘
Do you want full access?
Subscribe today to unlock all pages.
Trusted by 1+ million students worldwide
Sum of
Sales
Sum of
Profit
Customer
segment /
product category
Office
Suppli
es
Tech
nolog
y
Furni
ture
Office
Suppli
es
Tech
nolog
y
Fur
nitu
re
Small business
760009
.83
1126
714.3
24
9015
96.83
6
105306
.11
1816
84.41
2871
7.49
2788320.
99
315708.0
1
Consumer
691382
.23
1243
421.6
38
1128
807.2
14
88532.
29
1566
99.39
4272
8.26
3063611.
082
287959.9
4
Corporate
134131
5.63
2294
748.6
74
1862
840.5
74
203037
.38
3747
00.54
2200
8.08
5498904.
878 599746
Home Office
960054
.41
1319
363.5
47
1285
345.9
18
121145
.65
1732
29.18
2397
9.2
3564763.
875
318354.0
3
Grand Total
375276
2.1
5984
248.1
82
5178
590.5
42
518021
.43
8863
13.52
1174
33.0
3
1491560
0.82
1521767.
98
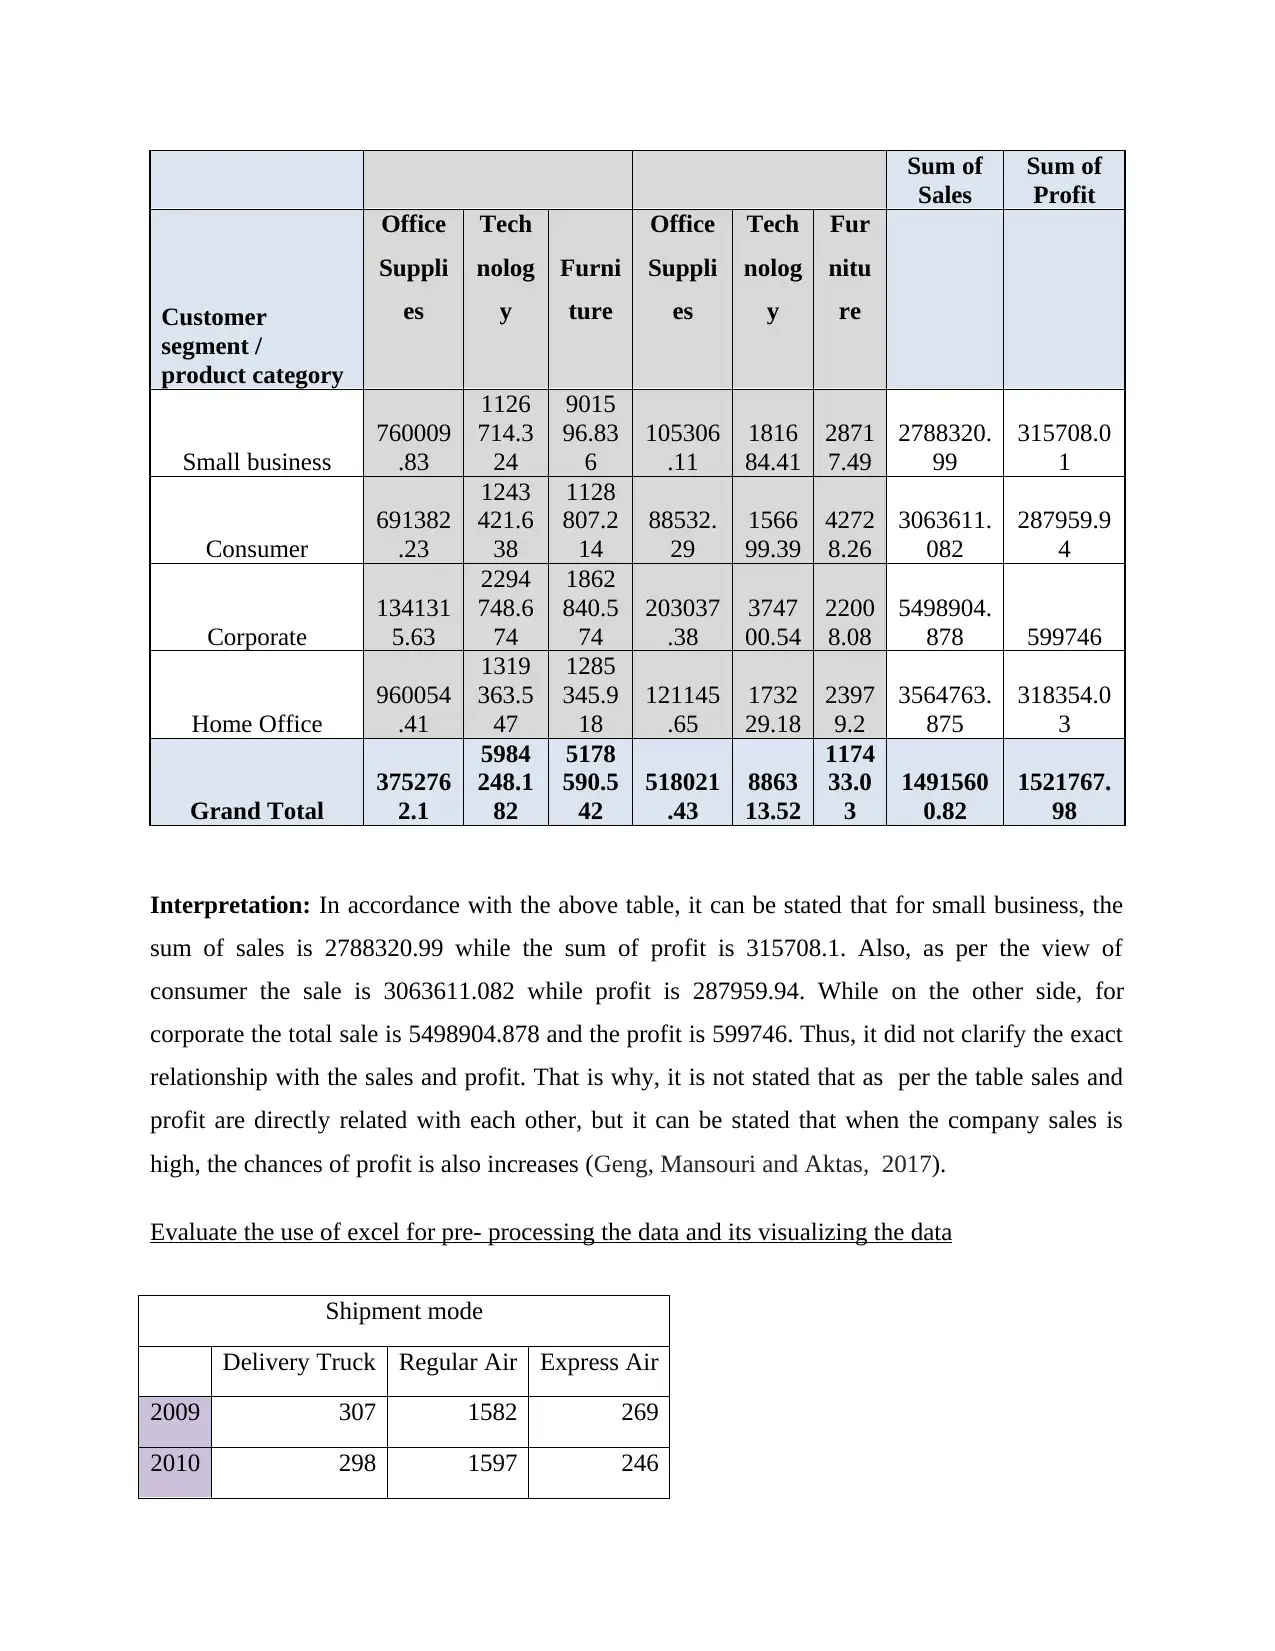
Interpretation: In accordance with the above table, it can be stated that for small business, the
sum of sales is 2788320.99 while the sum of profit is 315708.1. Also, as per the view of
consumer the sale is 3063611.082 while profit is 287959.94. While on the other side, for
corporate the total sale is 5498904.878 and the profit is 599746. Thus, it did not clarify the exact
relationship with the sales and profit. That is why, it is not stated that as per the table sales and
profit are directly related with each other, but it can be stated that when the company sales is
high, the chances of profit is also increases (Geng, Mansouri and Aktas, 2017).
Evaluate the use of excel for pre- processing the data and its visualizing the data
Shipment mode
Delivery Truck Regular Air Express Air
2009 307 1582 269
2010 298 1597 246
Sales
Sum of
Profit
Customer
segment /
product category
Office
Suppli
es
Tech
nolog
y
Furni
ture
Office
Suppli
es
Tech
nolog
y
Fur
nitu
re
Small business
760009
.83
1126
714.3
24
9015
96.83
6
105306
.11
1816
84.41
2871
7.49
2788320.
99
315708.0
1
Consumer
691382
.23
1243
421.6
38
1128
807.2
14
88532.
29
1566
99.39
4272
8.26
3063611.
082
287959.9
4
Corporate
134131
5.63
2294
748.6
74
1862
840.5
74
203037
.38
3747
00.54
2200
8.08
5498904.
878 599746
Home Office
960054
.41
1319
363.5
47
1285
345.9
18
121145
.65
1732
29.18
2397
9.2
3564763.
875
318354.0
3
Grand Total
375276
2.1
5984
248.1
82
5178
590.5
42
518021
.43
8863
13.52
1174
33.0
3
1491560
0.82
1521767.
98
Interpretation: In accordance with the above table, it can be stated that for small business, the
sum of sales is 2788320.99 while the sum of profit is 315708.1. Also, as per the view of
consumer the sale is 3063611.082 while profit is 287959.94. While on the other side, for
corporate the total sale is 5498904.878 and the profit is 599746. Thus, it did not clarify the exact
relationship with the sales and profit. That is why, it is not stated that as per the table sales and
profit are directly related with each other, but it can be stated that when the company sales is
high, the chances of profit is also increases (Geng, Mansouri and Aktas, 2017).
Evaluate the use of excel for pre- processing the data and its visualizing the data
Shipment mode
Delivery Truck Regular Air Express Air
2009 307 1582 269
2010 298 1597 246
Paraphrase This Document
Need a fresh take? Get an instant paraphrase of this document with our AI Paraphraser
2011 263 1460 275
2012 291 1609 202
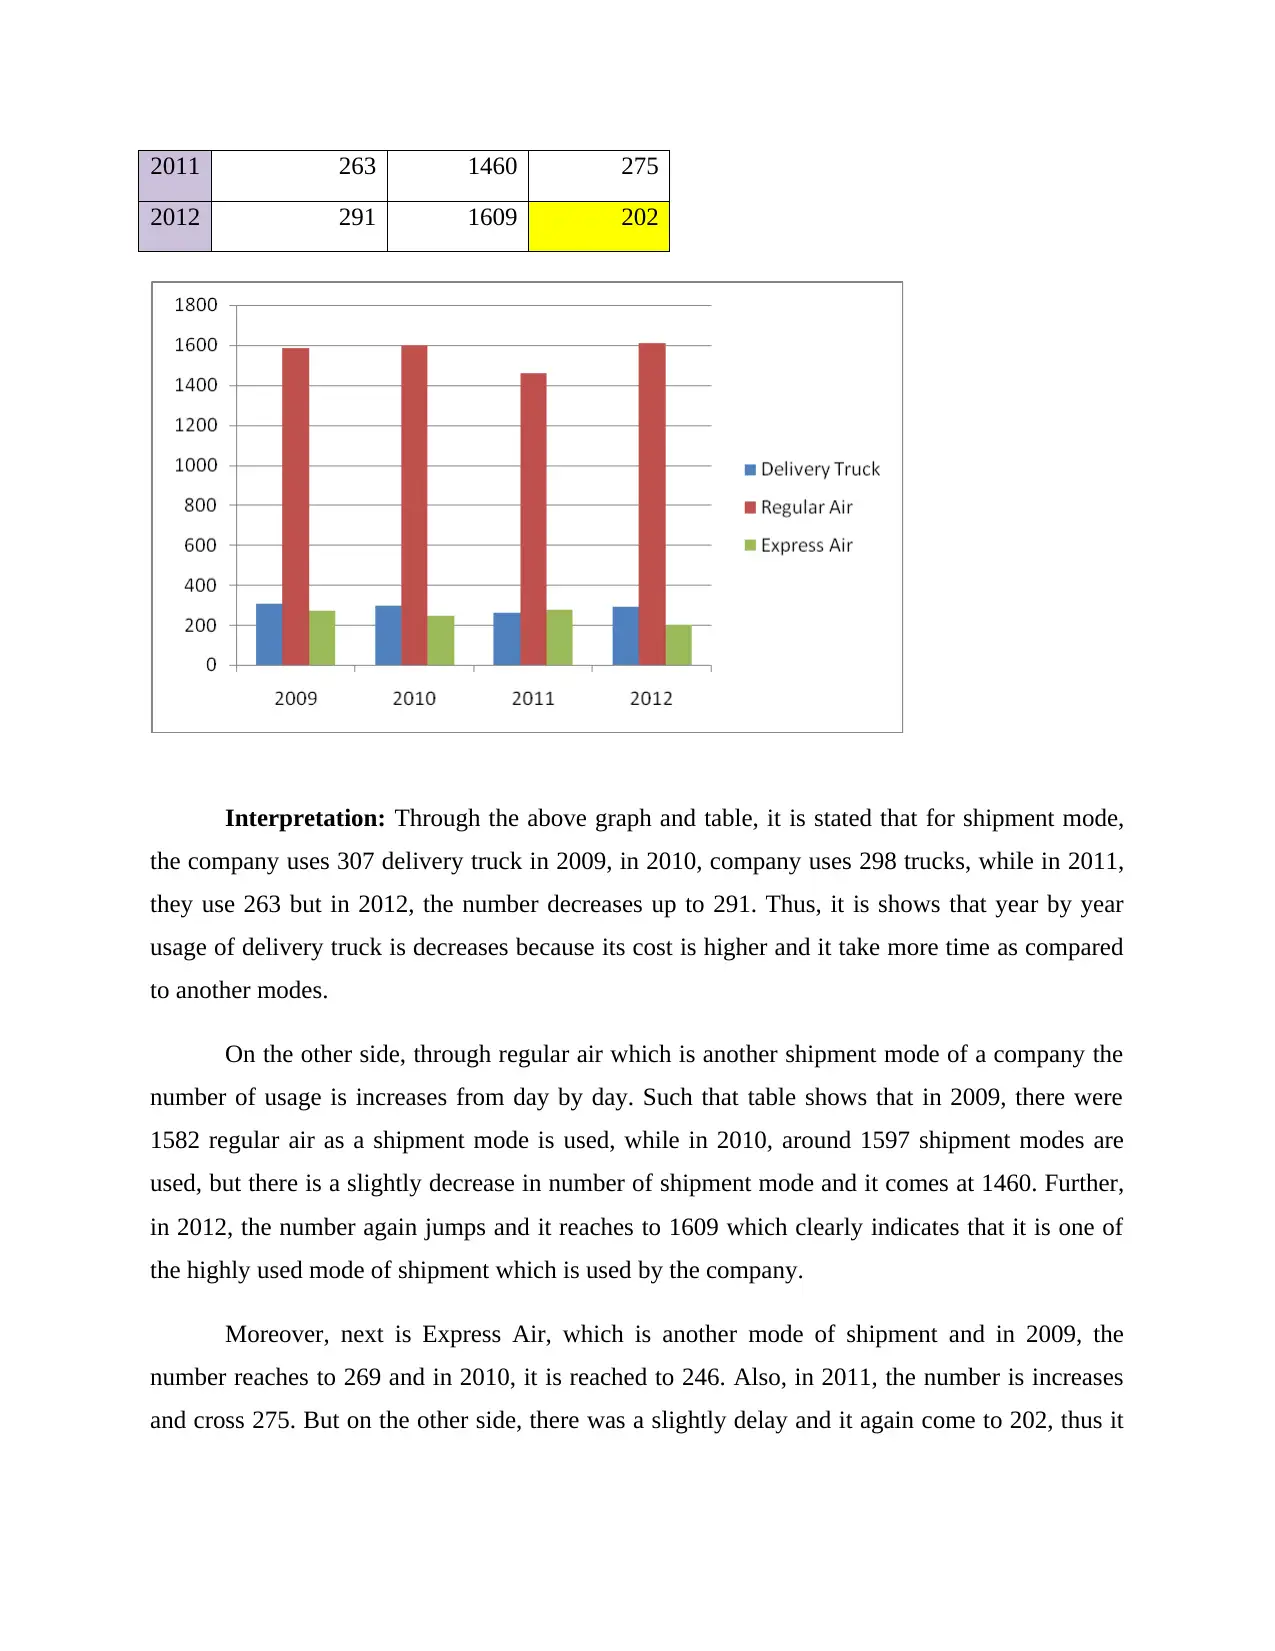
Interpretation: Through the above graph and table, it is stated that for shipment mode,
the company uses 307 delivery truck in 2009, in 2010, company uses 298 trucks, while in 2011,
they use 263 but in 2012, the number decreases up to 291. Thus, it is shows that year by year
usage of delivery truck is decreases because its cost is higher and it take more time as compared
to another modes.
On the other side, through regular air which is another shipment mode of a company the
number of usage is increases from day by day. Such that table shows that in 2009, there were
1582 regular air as a shipment mode is used, while in 2010, around 1597 shipment modes are
used, but there is a slightly decrease in number of shipment mode and it comes at 1460. Further,
in 2012, the number again jumps and it reaches to 1609 which clearly indicates that it is one of
the highly used mode of shipment which is used by the company.
Moreover, next is Express Air, which is another mode of shipment and in 2009, the
number reaches to 269 and in 2010, it is reached to 246. Also, in 2011, the number is increases
and cross 275. But on the other side, there was a slightly delay and it again come to 202, thus it
2012 291 1609 202
Interpretation: Through the above graph and table, it is stated that for shipment mode,
the company uses 307 delivery truck in 2009, in 2010, company uses 298 trucks, while in 2011,
they use 263 but in 2012, the number decreases up to 291. Thus, it is shows that year by year
usage of delivery truck is decreases because its cost is higher and it take more time as compared
to another modes.
On the other side, through regular air which is another shipment mode of a company the
number of usage is increases from day by day. Such that table shows that in 2009, there were
1582 regular air as a shipment mode is used, while in 2010, around 1597 shipment modes are
used, but there is a slightly decrease in number of shipment mode and it comes at 1460. Further,
in 2012, the number again jumps and it reaches to 1609 which clearly indicates that it is one of
the highly used mode of shipment which is used by the company.
Moreover, next is Express Air, which is another mode of shipment and in 2009, the
number reaches to 269 and in 2010, it is reached to 246. Also, in 2011, the number is increases
and cross 275. But on the other side, there was a slightly delay and it again come to 202, thus it
may be low services and non-timely deliveries, which decreases the number year by year. Thus,
sudden decrease in number off shipment is consider another reason for lowering the sales.
2009 2010 2011 2012
Office Supplies 1169 1170 1112 1159
Technology 541 531 468 525
Furniture 448 440 418 418
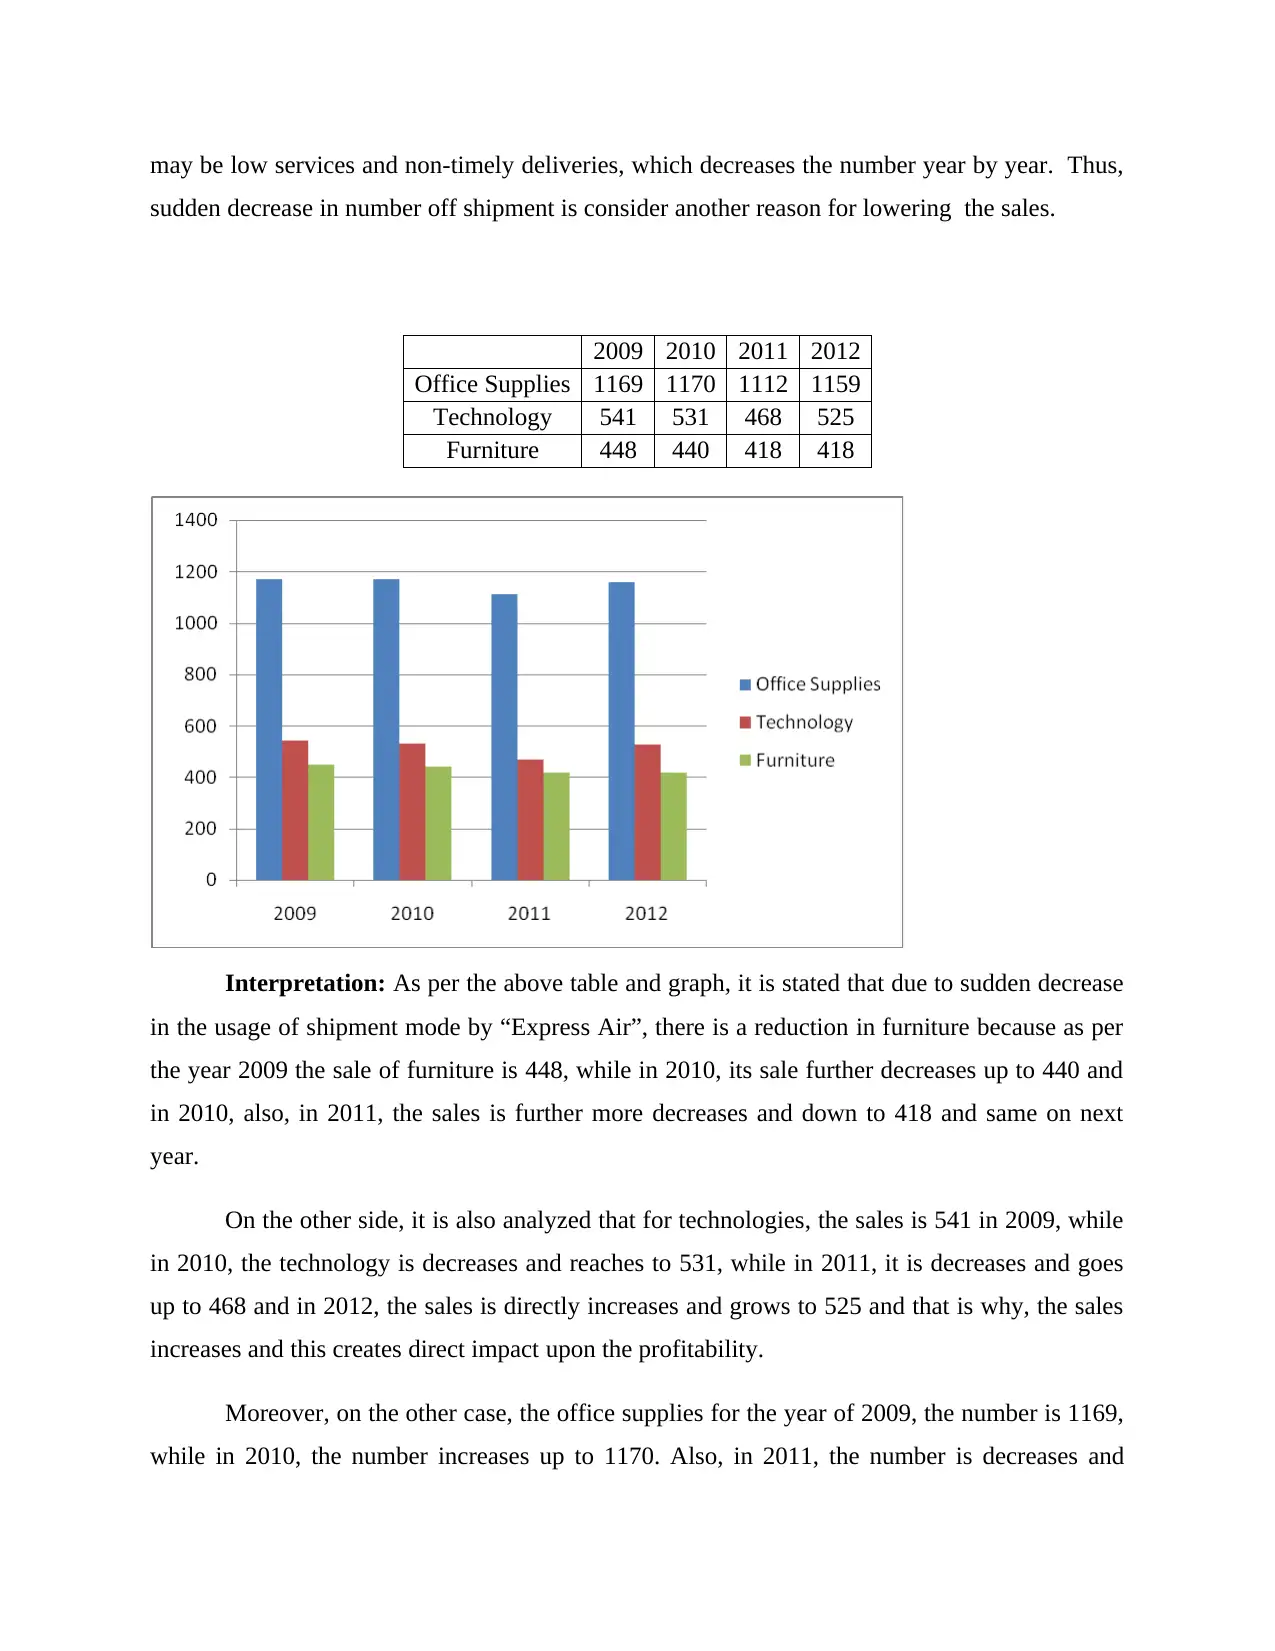
Interpretation: As per the above table and graph, it is stated that due to sudden decrease
in the usage of shipment mode by “Express Air”, there is a reduction in furniture because as per
the year 2009 the sale of furniture is 448, while in 2010, its sale further decreases up to 440 and
in 2010, also, in 2011, the sales is further more decreases and down to 418 and same on next
year.
On the other side, it is also analyzed that for technologies, the sales is 541 in 2009, while
in 2010, the technology is decreases and reaches to 531, while in 2011, it is decreases and goes
up to 468 and in 2012, the sales is directly increases and grows to 525 and that is why, the sales
increases and this creates direct impact upon the profitability.
Moreover, on the other case, the office supplies for the year of 2009, the number is 1169,
while in 2010, the number increases up to 1170. Also, in 2011, the number is decreases and
sudden decrease in number off shipment is consider another reason for lowering the sales.
2009 2010 2011 2012
Office Supplies 1169 1170 1112 1159
Technology 541 531 468 525
Furniture 448 440 418 418
Interpretation: As per the above table and graph, it is stated that due to sudden decrease
in the usage of shipment mode by “Express Air”, there is a reduction in furniture because as per
the year 2009 the sale of furniture is 448, while in 2010, its sale further decreases up to 440 and
in 2010, also, in 2011, the sales is further more decreases and down to 418 and same on next
year.
On the other side, it is also analyzed that for technologies, the sales is 541 in 2009, while
in 2010, the technology is decreases and reaches to 531, while in 2011, it is decreases and goes
up to 468 and in 2012, the sales is directly increases and grows to 525 and that is why, the sales
increases and this creates direct impact upon the profitability.
Moreover, on the other case, the office supplies for the year of 2009, the number is 1169,
while in 2010, the number increases up to 1170. Also, in 2011, the number is decreases and
⊘ This is a preview!⊘
Do you want full access?
Subscribe today to unlock all pages.
Trusted by 1+ million students worldwide
decline up to 1112 and in the year of 2012, it raises and reaches to 1159. Thus, it is analyzed that
there is a fluctuation in the rates and that is why, there is no impact upon the sales and profit
because the sales is sometimes increases and decreases. Thus, it is analyzed that there is no
relationship in this situation.
PART 2
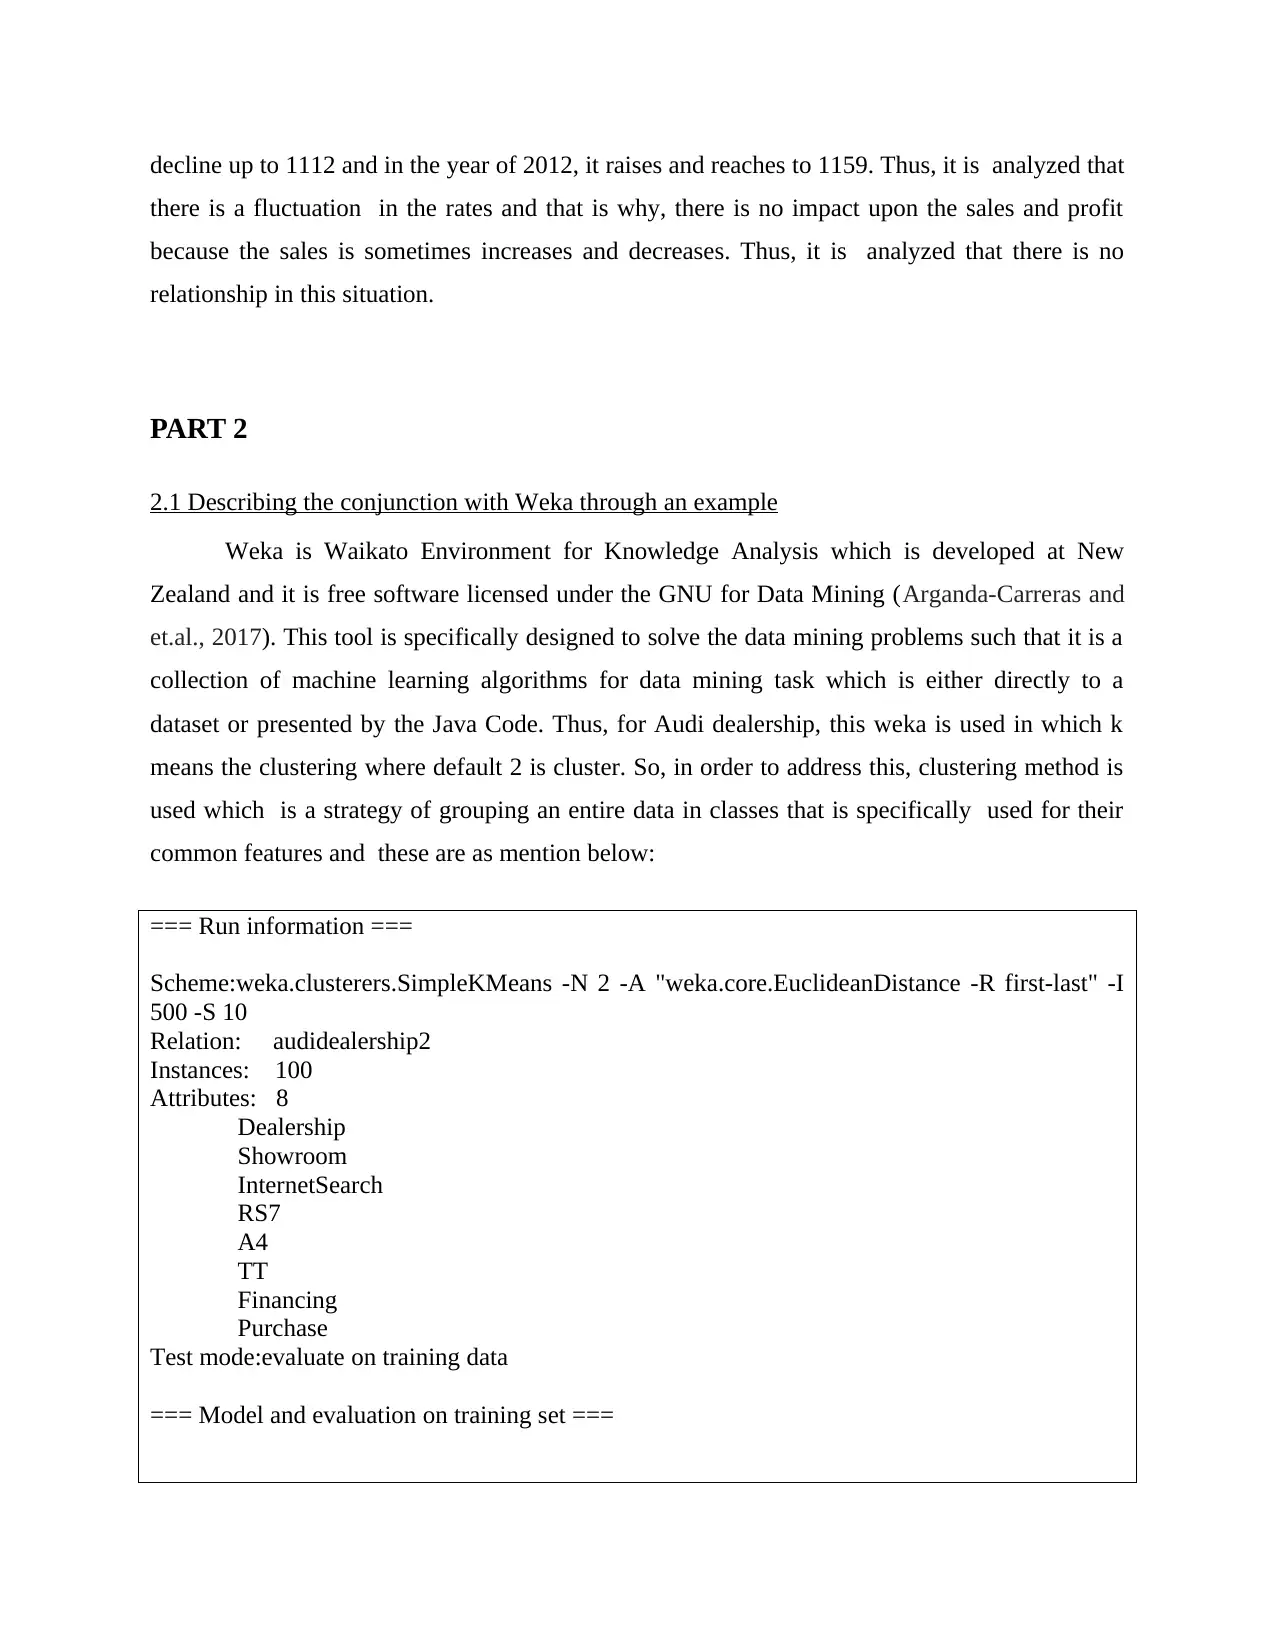
2.1 Describing the conjunction with Weka through an example
Weka is Waikato Environment for Knowledge Analysis which is developed at New
Zealand and it is free software licensed under the GNU for Data Mining (Arganda-Carreras and
et.al., 2017). This tool is specifically designed to solve the data mining problems such that it is a
collection of machine learning algorithms for data mining task which is either directly to a
dataset or presented by the Java Code. Thus, for Audi dealership, this weka is used in which k
means the clustering where default 2 is cluster. So, in order to address this, clustering method is
used which is a strategy of grouping an entire data in classes that is specifically used for their
common features and these are as mention below:
=== Run information ===
Scheme:weka.clusterers.SimpleKMeans -N 2 -A "weka.core.EuclideanDistance -R first-last" -I
500 -S 10
Relation: audidealership2
Instances: 100
Attributes: 8
Dealership
Showroom
InternetSearch
RS7
A4
TT
Financing
Purchase
Test mode:evaluate on training data
=== Model and evaluation on training set ===
there is a fluctuation in the rates and that is why, there is no impact upon the sales and profit
because the sales is sometimes increases and decreases. Thus, it is analyzed that there is no
relationship in this situation.
PART 2
2.1 Describing the conjunction with Weka through an example
Weka is Waikato Environment for Knowledge Analysis which is developed at New
Zealand and it is free software licensed under the GNU for Data Mining (Arganda-Carreras and
et.al., 2017). This tool is specifically designed to solve the data mining problems such that it is a
collection of machine learning algorithms for data mining task which is either directly to a
dataset or presented by the Java Code. Thus, for Audi dealership, this weka is used in which k
means the clustering where default 2 is cluster. So, in order to address this, clustering method is
used which is a strategy of grouping an entire data in classes that is specifically used for their
common features and these are as mention below:
=== Run information ===
Scheme:weka.clusterers.SimpleKMeans -N 2 -A "weka.core.EuclideanDistance -R first-last" -I
500 -S 10
Relation: audidealership2
Instances: 100
Attributes: 8
Dealership
Showroom
InternetSearch
RS7
A4
TT
Financing
Purchase
Test mode:evaluate on training data
=== Model and evaluation on training set ===
Paraphrase This Document
Need a fresh take? Get an instant paraphrase of this document with our AI Paraphraser
kMeans
======
Number of iterations: 6
Within cluster sum of squared errors: 160.2980769230769
Missing values globally replaced with mean/mode
Cluster centroids:
Cluster#
Attribute Full Data 0 1
(100) (48) (52)
=================================================
Dealership 0.54 0.3333 0.7308
Showroom 0.64 0.6667 0.6154
InternetSearch 0.39 0.4375 0.3462
RS7 0.53 0.2917 0.75
A4 0.55 0.8125 0.3077
TT 0.5 0.5833 0.4231
Financing 0.6 0.3333 0.8462
Purchase 0.38 0.0417 0.6923
Time taken to build model (full training data) : 0.02 seconds
=== Model and evaluation on training set ===
Clustered Instances
0 48 ( 48%)
1 52 ( 52%)
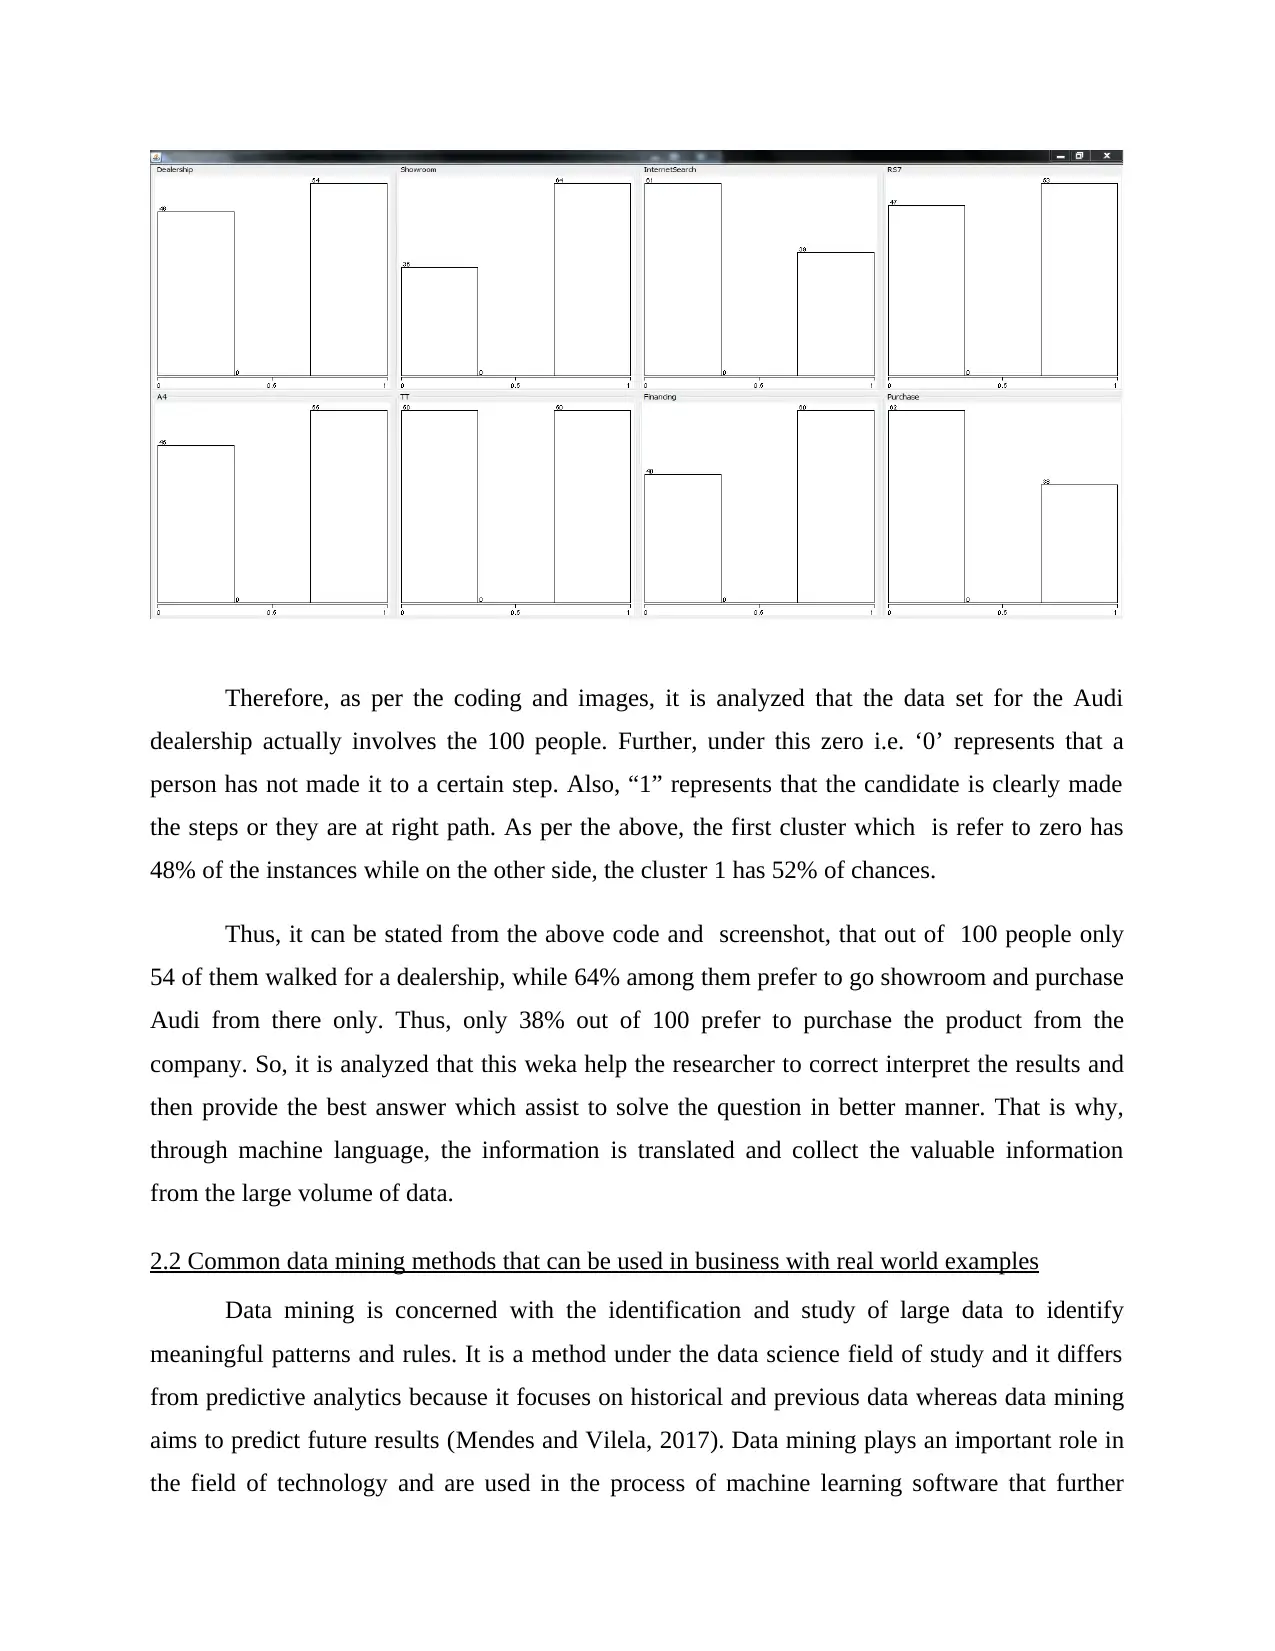
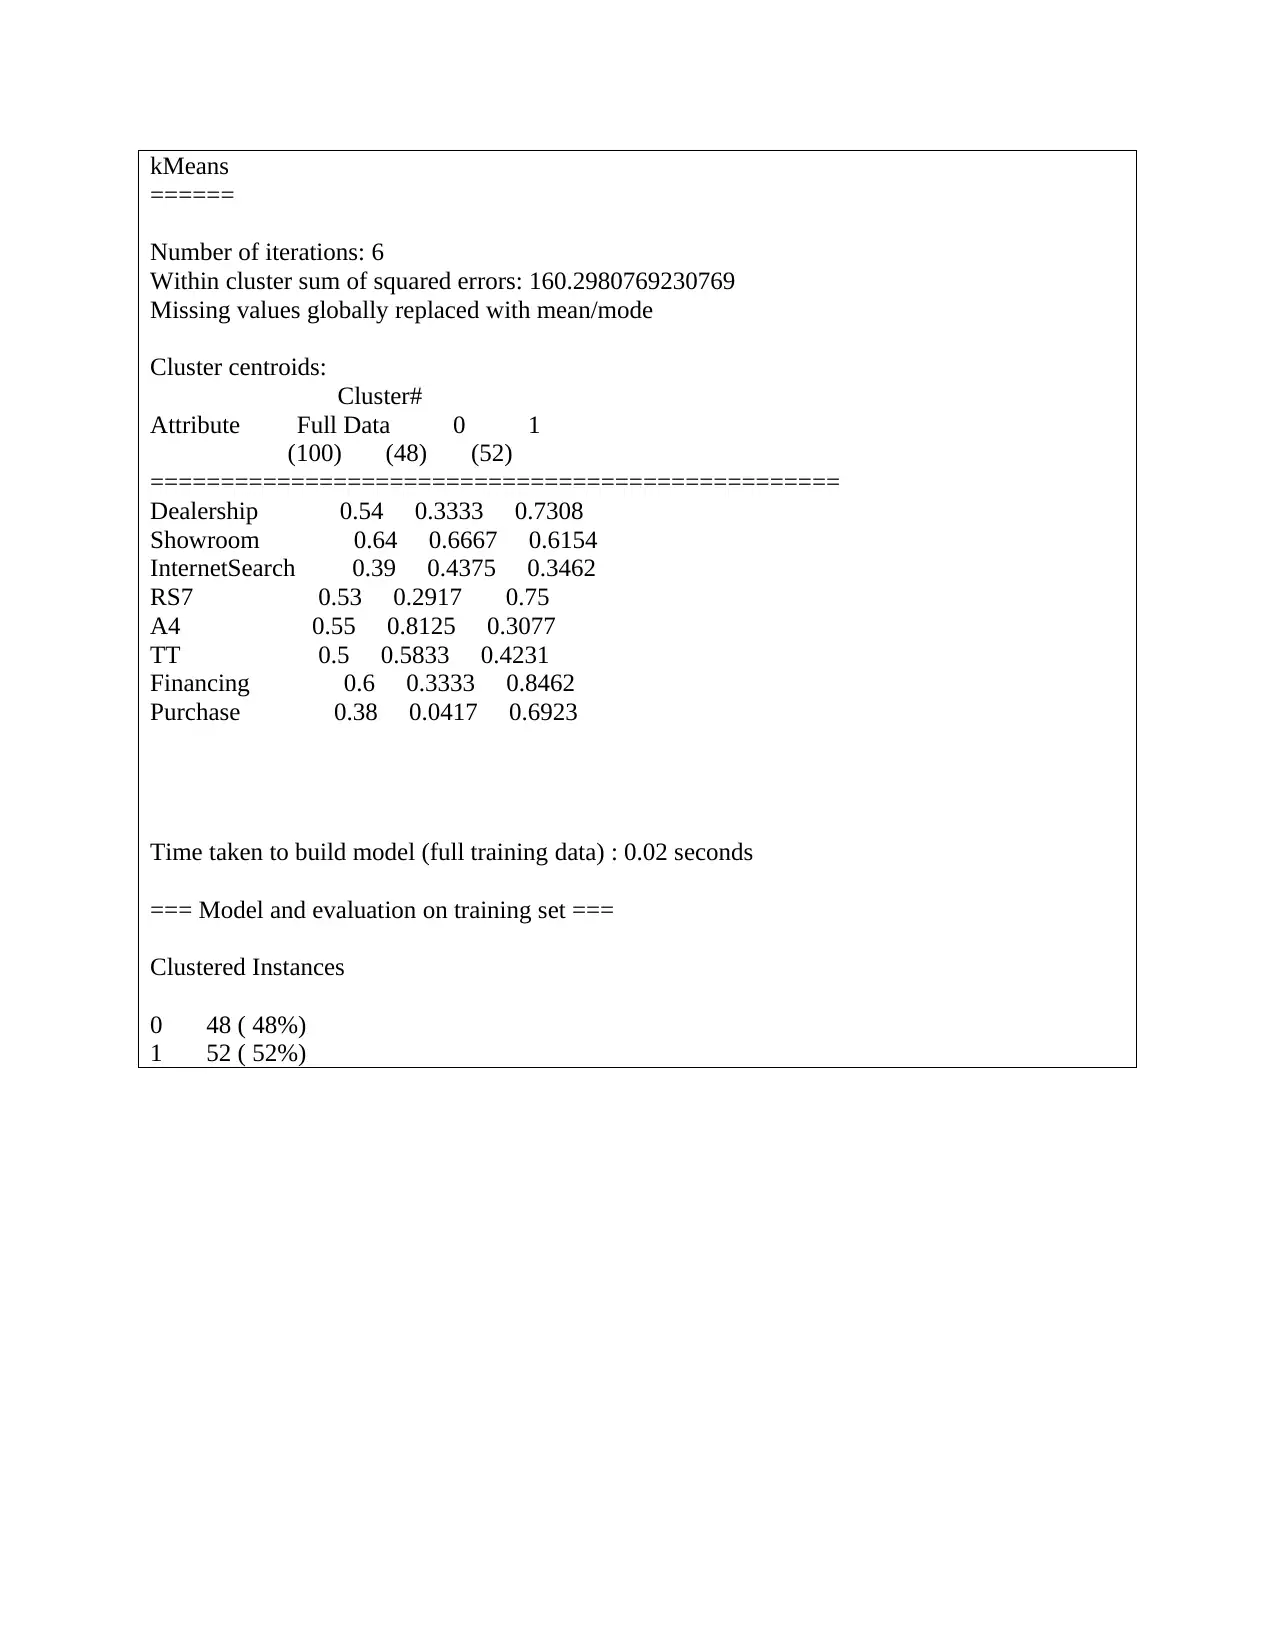
Therefore, as per the coding and images, it is analyzed that the data set for the Audi
dealership actually involves the 100 people. Further, under this zero i.e. ‘0’ represents that a
person has not made it to a certain step. Also, “1” represents that the candidate is clearly made
the steps or they are at right path. As per the above, the first cluster which is refer to zero has
48% of the instances while on the other side, the cluster 1 has 52% of chances.
Thus, it can be stated from the above code and screenshot, that out of 100 people only
54 of them walked for a dealership, while 64% among them prefer to go showroom and purchase
Audi from there only. Thus, only 38% out of 100 prefer to purchase the product from the
company. So, it is analyzed that this weka help the researcher to correct interpret the results and
then provide the best answer which assist to solve the question in better manner. That is why,
through machine language, the information is translated and collect the valuable information
from the large volume of data.
2.2 Common data mining methods that can be used in business with real world examples
Data mining is concerned with the identification and study of large data to identify
meaningful patterns and rules. It is a method under the data science field of study and it differs
from predictive analytics because it focuses on historical and previous data whereas data mining
aims to predict future results (Mendes and Vilela, 2017). Data mining plays an important role in
the field of technology and are used in the process of machine learning software that further
⊘ This is a preview!⊘
Do you want full access?
Subscribe today to unlock all pages.
Trusted by 1+ million students worldwide
1 out of 16
Related Documents


Your All-in-One AI-Powered Toolkit for Academic Success.
+13062052269
info@desklib.com
Available 24*7 on WhatsApp / Email
![[object Object]](/_next/static/media/star-bottom.7253800d.svg)
Unlock your academic potential
Copyright © 2020–2026 A2Z Services. All Rights Reserved. Developed and managed by ZUCOL.