BA Business Management: Data Handling and Business Intelligence Report
VerifiedAdded on 2023/01/11
|19
|3196
|51
Report
AI Summary
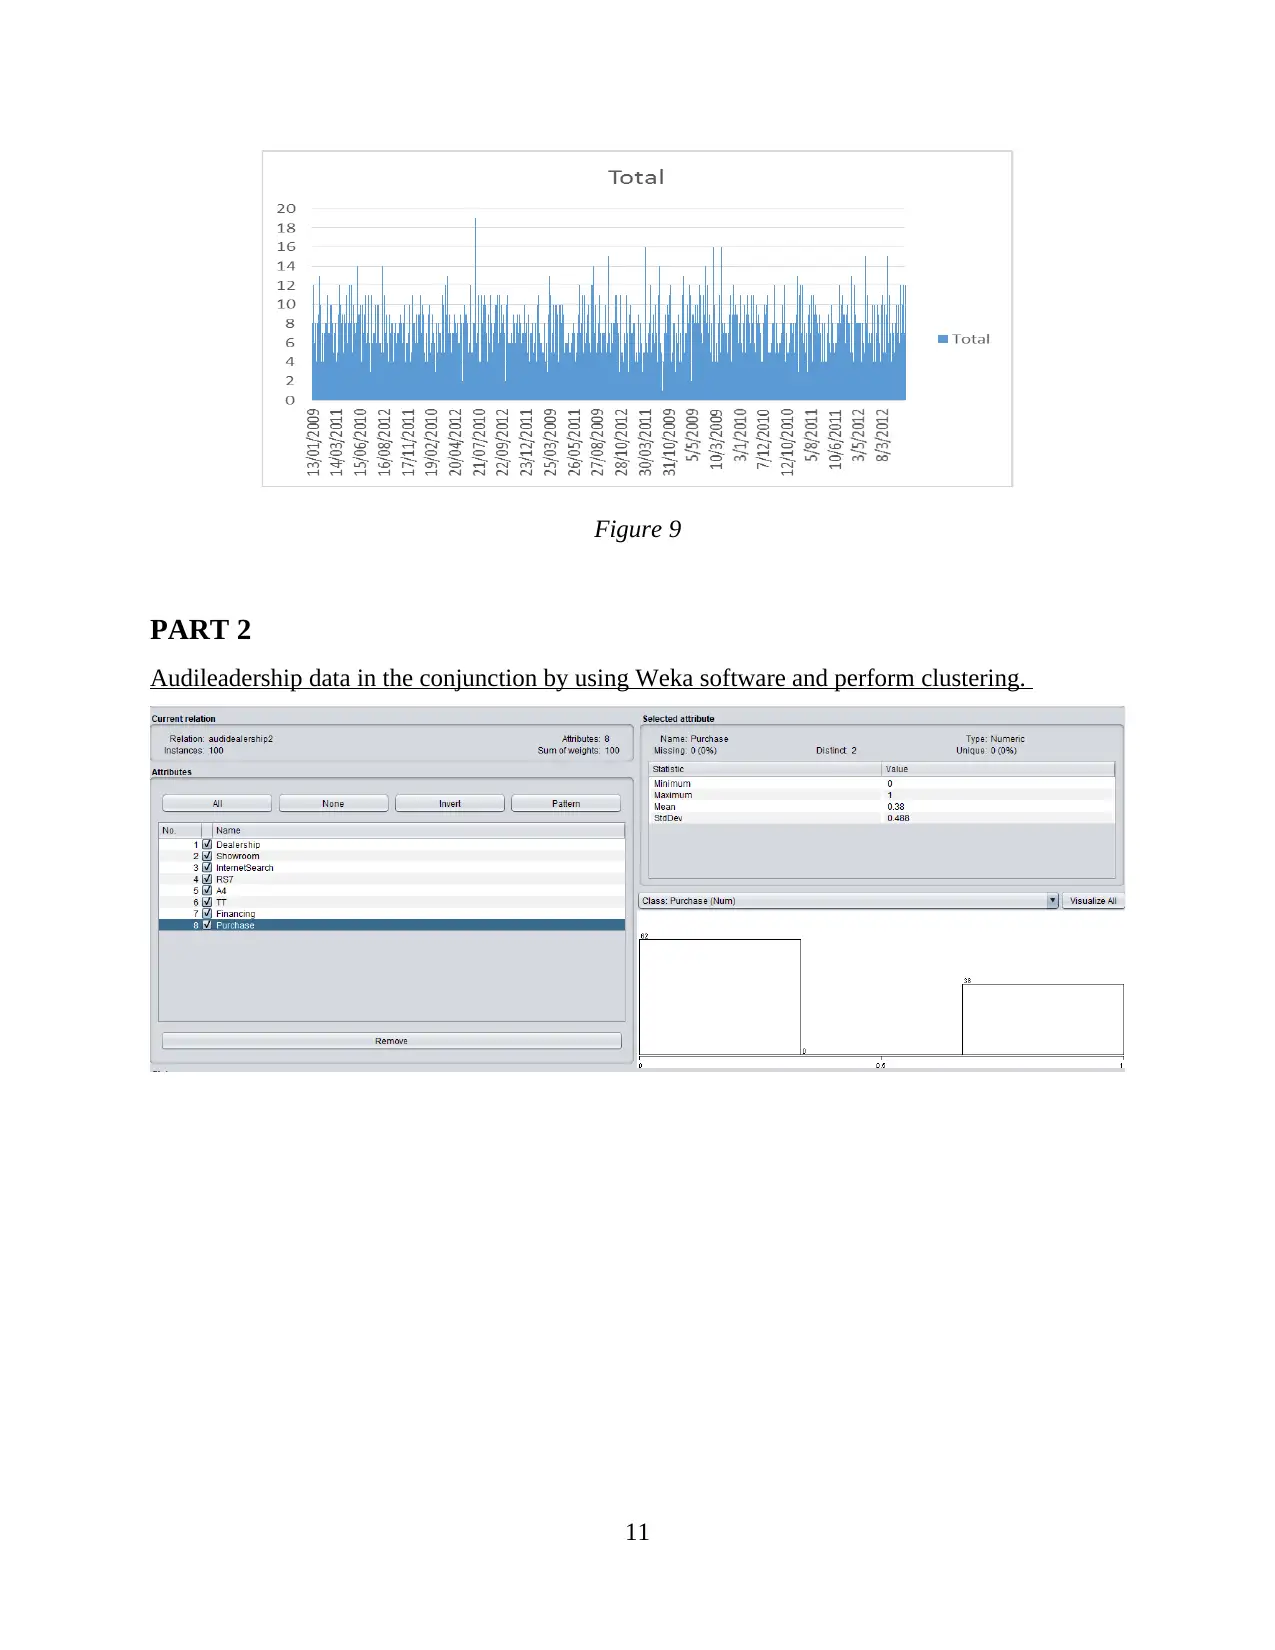
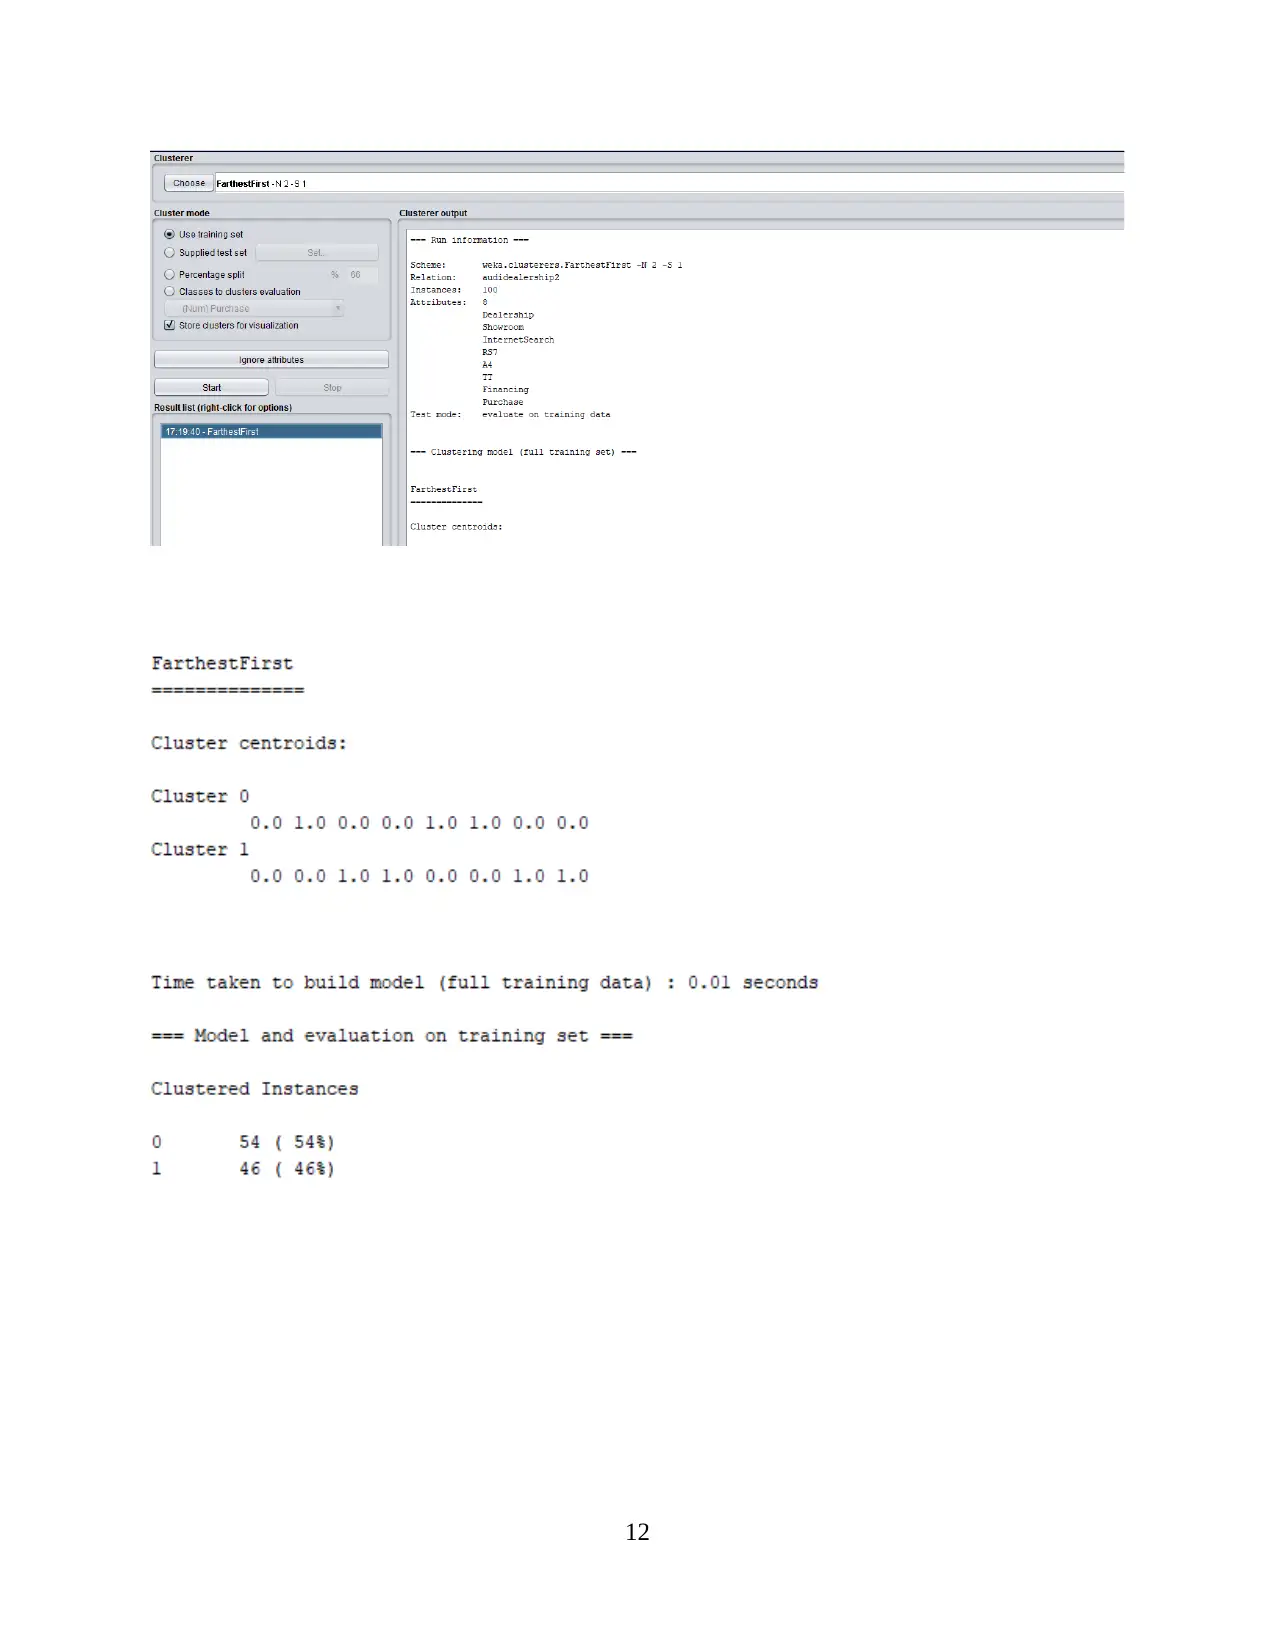
This report provides a comprehensive analysis of data handling and business intelligence. Part 1 focuses on identifying sales and profit trends over the years, with an evaluation of Excel for data preprocessing, demonstrating the use of Excel functions such as pivot tables, lookup, graphs, and charts. Part 2 delves into the application of Weka software for clustering audileadership data and explores various data mining methods applicable within a business context. The report also provides a comparative analysis of Weka and Excel, outlining their respective advantages and disadvantages. The report concludes with a discussion of the key findings and insights derived from the analysis, along with references to the sources used.
Contribute Materials
Your contribution can guide someone’s learning journey. Share your
documents today.

Data Handling and Business
Intelligence
1
Intelligence
1
Secure Best Marks with AI Grader
Need help grading? Try our AI Grader for instant feedback on your assignments.

Contents
INTRODUCTION...........................................................................................................................3
PART 1............................................................................................................................................3
Identify the sales and profit over years, evaluate the use of Excel for pre-processing the data or
information..................................................................................................................................3
Demonstrate that how can practical ways to perform operation by using Excel function such as
Pivot table, if, Lookup, graph and chart......................................................................................6
PART 2..........................................................................................................................................11
Audileadership data in the conjunction by using Weka software and perform clustering........11
Describe about the data mining methods that can be used within a business............................14
Advantage and disadvantage of Weka over Excel....................................................................15
CONCLUSION..............................................................................................................................17
REFERENCES..............................................................................................................................18
2

INTRODUCTION
Data Mining is consider as a process of identifying the different patterns, interrelation
between large volume data or information. this process is mainly used the large organization
where every day collecting large information within system. It will support for filtering data on
the basis of categorising. Marketing assistant will participate in the business expansion so that
they will use data mining software to gather relevant information or data. In order to cut the
cost / price while improving the customer relationship. Moreover, it will minimise the various
type of risk, threat in the organization. Data mining is an important factor for exploring and
analysing the large amount of data. It provide the facilities to discover the meaningful pattern,
facts, and figures. The documentation will describe about the sales information and also
calculating the profit, sales over years. The primary vision is to predict the future outcome or
result through data mining concept. In additional, data mining is a type of appropriate technique
which help for building the machine learning model in term of artificial intelligence.
PART 1
Identify the sales and profit over years, evaluate the use of Excel for pre-processing the data or
information.
Row Labels Average of Profit Sum of Sales
Furniture 68.11660673 5178590.542
2009 140.1369955 1469508.194
2010 20.65391403 1250043.046
2011 115.326226 1258336.514
2012 -5.173357143 1200702.788
Office Supplies 112.3690738 3752762.1
2009 153.4285381 1031244.56
2010 97.14263473 885095.79
2011 80.42802855 816902.13
2012 117.6447423 1019519.62
Technology 429.2075157 5984248.182
2009 337.0125974 1668572.052
2010 474.5130402 1416503.546
2011 518.2162105 1380213.417
2012 398.3725568 1518959.168
3

Grand Total 181.1844243 14915600.82
Table:1
Figure 1
Figure 2
4
Table:1
Figure 1
Figure 2
4
Secure Best Marks with AI Grader
Need help grading? Try our AI Grader for instant feedback on your assignments.

Figure 3
Calculate the sum of profit and sum of sales through Excel
Row Labels
Sum of
Sales Sum of Profit
Furniture 5178590.542 117433.03
Atlantic 708726.782 15345.65
North Carolina 43545.614 3478.88
Northwest Territories 31451.192 5057.79
Ontario 1361004.216 22280.36
Prarie 919191.126 30551.22
Quebec 605784.144 -760.77
West 1172989.394 30924.64
Yukon 335898.074 10555.26
Office Supplies 3752762.1 518021.43
Atlantic 478464.42 66970.47
North Carolina 38615.47 -3124.02
Northwest Territories 21955.03 1317.97
Ontario 1122325.15 188888.85
Prarie 720090.43 83259.7
Quebec 351822.68 42982.17
West 797510.76 116666.85
Yukon 221978.16 21059.44
Technology 5984248.182 886313.52
Atlantic 827057.0015 156644.54
North Carolina 34215.3995 2486.25
Northwest Territories 30411.524 1931.29
Ontario 1296912.697 228045.36
Prarie 1198023.046 207349.2
5

Quebec 552588.256 98205.25
West 1627049.122 149417.12
Yukon 417991.137 42234.51
Grand Total 14915600.82 1521767.98
Table: 2
Figure 4
Demonstrate that how can practical ways to perform operation by using Excel function such as
Pivot table, if, Lookup, graph and chart.
Pivot table: it is based on the statistics that mainly summarised large amount of data which
become more extensive table. It may include averages, sums and other type of statistical
information. Pivot table is consider as technique which mainly used for data processing. There
are large number of statistical data used to draw attention towards useful information (Aufaure
and et.al., 2016). A pivot table summarised the data by using tool and processing to reorganise,
count, group and average data stored within database. It allows for user transform column into
rows.
6

Lookup: this function is basically used to categorise under excel and reference functions. It
can be performed the rough match lookup either in a one column range and return the
corresponding values.
Calculate the Sum of shipping cost, sum or product base margin and sum of sales for Furniture.
Row Labels
Sum of Shipping
Cost
Sum of Product Base
Margin
Sum of
Sales
Furniture 53243.69 1006.77 5178590.542
Bookcases 8646.07 122.09 822652.04
Chairs & Chairmats 15512.69 228.46 1761836.55
Office Furnishings 8402.72 414.31 698093.81
Tables 20682.21 241.91 1896008.142
Figure 5
Estimate the actual Sum of shipping cost, sum or product base margin and sum of sales for office
supplies.
Office Supplies 36095.51 2116.77
Appliances 6854.11 240.64
Binders and Binder Accessories 6633.52 342.42
Envelopes 1682.77 91.97
Labels 288.66 108.61
Paper 7914.41 458.85
Pens & Art Supplies 2041.81 337.76
7
Paraphrase This Document
Need a fresh take? Get an instant paraphrase of this document with our AI Paraphraser

Rubber Bands 225.21 95.14
Scissors, Rulers and Trimmers 670.51 92.23
Storage & Organization 9784.51 349.15
Figure 6
Calculate the Sum of shipping cost, sum or product base margin and sum of sales for office
supplies.
Technology 18491.84 1148.77 5984248.182
Computer Peripherals 4067.34 449.67 795875.94
Copiers and Fax 2446.88 36.37 1130361.3
Office Machines 7135.91 149.75 2168697.14
Telephones and Communication 4841.71 512.98 1889313.802
Figure 7
8

Calculate Sum of region By Profit
Row Labels
Sum of
Profit
Atlantic 238960.66
North Carolina 2841.11
Northwest
Territories 8307.05
Ontario 439214.57
Prarie 321160.12
Quebec 140426.65
West 297008.61
Yukon 73849.21
Grand Total 1521767.98
Figure 8
Date wise count customer segments
Row
Labels
Count of Customer
Segment
13/01/2009 4
13/01/2010 8
13/01/2011 8
13/01/2012 12
13/02/2009 6
13/02/2010 6
13/02/2011 5
9

13/02/2012 8
13/03/2009 6
13/03/2010 4
13/03/2011 3
13/03/2012 8
13/04/2009 5
13/04/2010 5
13/04/2011 9
13/04/2012 6
13/05/2009 8
13/05/2010 13
13/05/2011 5
13/05/2012 10
13/06/2009 5
13/06/2010 4
13/06/2011 4
10
13/03/2009 6
13/03/2010 4
13/03/2011 3
13/03/2012 8
13/04/2009 5
13/04/2010 5
13/04/2011 9
13/04/2012 6
13/05/2009 8
13/05/2010 13
13/05/2011 5
13/05/2012 10
13/06/2009 5
13/06/2010 4
13/06/2011 4
10
Secure Best Marks with AI Grader
Need help grading? Try our AI Grader for instant feedback on your assignments.

Figure 9
PART 2
Audileadership data in the conjunction by using Weka software and perform clustering.
11
PART 2
Audileadership data in the conjunction by using Weka software and perform clustering.
11

12

13
Paraphrase This Document
Need a fresh take? Get an instant paraphrase of this document with our AI Paraphraser

Describe about the data mining methods that can be used within a business
Data mining is based on the technique that utilise to refine data analysis tool and find out
the previously unknown information, valid patterns and relationship in huge data sets. This data
mining tool can corporate statistical models, machine learning technique and mathematical
algorithms such as neural networks, decision tress (Bordeleau, Mosconi and Santa-Eulalia,
2018). It should be considered the different data mining technique that can help for business for
growth and development.
Classification Analysis: it is based on the data mining method which mainly used to
identify or distinguish between different items. In order to classify and group with different
category. It always providing the help for predicting behaviour of item within specific group.
This technique can be completed into different steps: initially, it can use learning step in which
providing training set for purpose of analysed. In another step is that when classification
different process while estimating the rules (Jalil and Hwang, 2019). For Example- Banking
sector used this method for classification and identifying the loan applicant who have low,
medium and high credit risk.
Clustering analysis: It is to be consider as classification but also differentiate in different
manner. Clusters are generally made of dependence or similarities of data items. It can be
divided into different clusters that have unrelated and dissimilar objective. In most of cause, it
called as data segmentation because it help for partitioning huge amount of data sets into
different clusters. The clustering methods that are basically used by organization as per
requirements. For Example- if bank want to cluster with high credit risk, filtering on the basis of
salary, age. In order to handle and control the data in proper manner.
Prediction: it is based on the method that mainly used by organization to predict future on
the basis of present, past trends. Prediction is an essential for business to gather information with
the help of combination of other mining method such as relation, pattern matching, trend analysis
and classification (Mitrovic, 2020). In some situation, prediction method is commonly used by
supermarket because they can try to estimate the future growth and development. For Example-
Supermarket is mainly used to predict the overall revenue of business where every item can
generate on the basis if previous sales report.
Sequential pattern and tracking: it is also common method that mainly used for purpose of
data mining where organization use for identifying various pattern in order to complete task over
14

certain time intervals. Many retail enterprise uses this pattern for increasing demand of product
and service in global marketplace. It can be possible when potential customer can easily track
sensitive data or information in proper manner. For Example- Retail firms use this method to
calculate the maximum sales of product within specific time intervals. In order to increase the
demand of good and service in global marketplace. Pattern tracking will recognise opinion of
potential customer related particular product.
Decision Tree: it is based on the data mining technique which is mainly applicable in the
organization to classify their item so as need improve their decision related business growth and
development (Ogudo and Nestor, 2018). In some situation, Government enterprises use decision
tree technique for eliminating issue or problem. It provide the facility to identify individual who
are under 18 so that they can issue licence. In this method, it can provide direction to classify the
citizen in different age groups.
Outlier analysis: this type of method is basically used by companies for identification of
data items. They do not comply with the different patterns and expected behaviours. As per
identified the unexpected data which is known as noise. The technique is basically used by
companies for different purpose such as banking sector to determine the fraud detection,
intrusion detection. These are considered as common approach which help for identifying
unexpected data items.
Neural network: it is a process which completely based on the neural network. It can be
established the relationship between input as well as output. Many companies are using neural
network for recognition within input or output in proper manner. It is to be consider as important
method for classifying the data or information.
Advantage and disadvantage of Weka over Excel.
Weka is an open source data mining software. It does not only support machine learning
algorithms, but also data preparation and meta-learners like bagging and boosting. Complete
suite is written in java, so it can run on any platform (Park, El Sawy and Fiss, 2017). The
package has three different interfaces: a command line interface, an Explorer GUI interface
which allows you to try out different preparation, transformation and modeling algorithms on a
dataset and an Experimenter GUI interface which allows to run different algorithms in batch and
to compare the results.
15

The functionalities of Weka more or less boil down to the algorithms described in Witten
and Frank’s data mining book. An overview of the Weka functionalities:
SVM’s: only polynomial kernels are supported. Also, support vector regression is not
supported.
Decision trees: ID3 and C4.5 are implemented, and M5’: a model tree induction
algorithm for predicting numeric values (each leaf node has a regression model). PART is
a rule-learner that makes rules by building different decision trees and each time keeping
the leaf with the largest coverage.
Memory based methods: kNN and locally weighted regression.
Neural Networks: only backpropogation with momentum is supported.
Simpler methods: naive Bayes (for numeric values, a normal distribution is used, but also
‘kernel density estimation’ can be used to avoid assuming a normal distribution) and
linear regression are useful simple methods.
Advantages:
Weka data mining can truly aid an enterprise attain its fullest prospective. It is an approach to
evaluate how business is becoming impacted by particular qualities, and may assist company
entrepreneur improve their earnings and steer clear of generating company mistakes down the
line. Fundamentally, through this process, a company is analyzing specific information from
distinct perspective to be able to obtain a total rounded watch of how their business is performing
(Villamarín and Diaz Pinzon, 2017). Enterprise proprietors can get a broad point of view on
points these as client trending, where they may be shedding cash and where they are cheating
cash. The knowledge may also reveal methods that may help a business lower unneeded fees and
may aid them boost their overall income. The obvious advantage of a package like Weka is that a
whole range of data preparation, feature selection and data mining algorithms are integrated.
This means that only one data format is needed, and trying out and comparing different
approaches becomes really easy. The package also comes with a GUI, which should make it
easier to use.
Another advantage of Weka can be that it is constantly under development and not only
by its original designers. People have already been utilizing weka data mining for several years
in different formats (Wani and Jabin, 2018). Only since the technological innovation is now
obtainable has data software program been utilized. But there happen to be numerous technique
16
Secure Best Marks with AI Grader
Need help grading? Try our AI Grader for instant feedback on your assignments.

inside the past for organizations to evaluate their data and utilize it to their advantage. However
it cannot be denied that the accessibility to better technology has significantly improved the
ability to store or gather info, make predictions about outcomes and rehearse client trend reports
to greater positive aspects.
Disadvantages:
Probably the most important disadvantage of data mining suite like this is that they don’t
implement the newest technique. For example the MLP implemented has a very basic training
algorithms (backdrop with momentum), and the SVM only uses polynomial kernels, and does
not support numeric estimation. Therefore, it will be necessary to combine WEKA with some of
the other tools like Netlab or SVM_torch. One more important disadvantage arise from the fact
that software is free: the documentation for the GUI is quite limited (Wani and Jabin, 2018). The
software is constantly growing day by day but the documentation is not up to date with
everything either (the most up to date and complete information about algorithm options can be
obtained using the -h option in the command line interface). Another possible problem is scaling.
For more complex tasks on large datasets, the running time can become quite long, and java
sometimes gives an OutOfMemory error, but this problem can be reduced by using the ‘-mxx’
option when calling java, where x is memory size. For large database it will always be necessary
to reduce the size to be able to work within reasonable time limits. Another problem or
disadvantage is that GUI does not implement all the possible options. Things that could be very
useful, like scoring of a test set, are not provided in the GUI, but can be called from the
command line interface (Wani and Jabin, 2018). So, sometimes it will be necessary to switch
between GUI and command line.
Lastly, the data preparation and visualization techniques offered might not be enough. Most
of them are very useful, but in most of the data mining tasks it will be need more to get to know
the data well and to get it in the right format. Another disadvantage of Weka can be that its
performance is often sacrificed in favor of portability, design, transparency, etc.
17

CONCLUSION
From above discussion, it concluded that Data Mining is based on the process of
determining the different patterns, interrelation between large volume data or information. The
mining process help for large organization where every day collecting large information within
system. It will support for filtering data on the basis of categorising. In another way, Data mining
is an important factor for exploring and analysing the large amount of data. It provide the
facilities to discover the meaningful pattern, facts, and figures. It has summarised about the sales
information and also calculating the profit, sales over years. Therefore, it can easily predict the
future outcome or result through data mining concept. In additional, data mining is a type of
appropriate technique which help for building the machine learning model in term of artificial
intelligence.
18

REFERENCES
Book and Journals
Aufaure, M.A. and et.al., 2016. From Business Intelligence to semantic data stream
management. Future Generation Computer Systems. 63. pp.100-107.
Bordeleau, F.E., Mosconi, E. and Santa-Eulalia, L.A., 2018, January. Business Intelligence in
Industry 4.0: State of the art and research opportunities. In Proceedings of the 51st Hawaii
International Conference on System Sciences.
Jalil, N.A. and Hwang, H.J., 2019. Technological-centric business intelligence: Critical success
factors. Int. J. Innov. Creat. Chang.
Mitrovic, S., 2020. Adapting of international practices of using business-intelligence to the
economic analysis in Russia. In Digital Transformation of the Economy: Challenges,
Trends and New Opportunities (pp. 129-139). Springer, Cham.
Ogudo, K.A. and Nestor, D.M.J., 2018, August. Modeling of an efficient low cost, tree based
data service quality management for mobile operators using in-memory big data
processing and business intelligence use cases. In 2018 International Conference on
Advances in Big Data, Computing and Data Communication Systems (icABCD) (pp. 1-8).
IEEE.
Park, Y., El Sawy, O.A. and Fiss, P., 2017. The role of business intelligence and communication
technologies in organizational agility: a configurational approach. Journal of the
association for information systems. 18(9). p.1.
Villamarín, J.M. and Diaz Pinzon, B., 2017. Key success factors to business intelligence solution
implementation. Journal of Intelligence Studies in Business. 7(1). pp.48-69.
Wani, M.A. and Jabin, S., 2018. Big data: issues, challenges, and techniques in business
intelligence. In Big data analytics (pp. 613-628). Springer, Singapore.
19
1 out of 19

Your All-in-One AI-Powered Toolkit for Academic Success.
+13062052269
info@desklib.com
Available 24*7 on WhatsApp / Email
Unlock your academic potential
© 2024 | Zucol Services PVT LTD | All rights reserved.