Data Analysis and Humidity Forecasting Report Using Linear Model

Verified

Added on  2023/06/13

|10
|1509
|162
Report
AI Summary
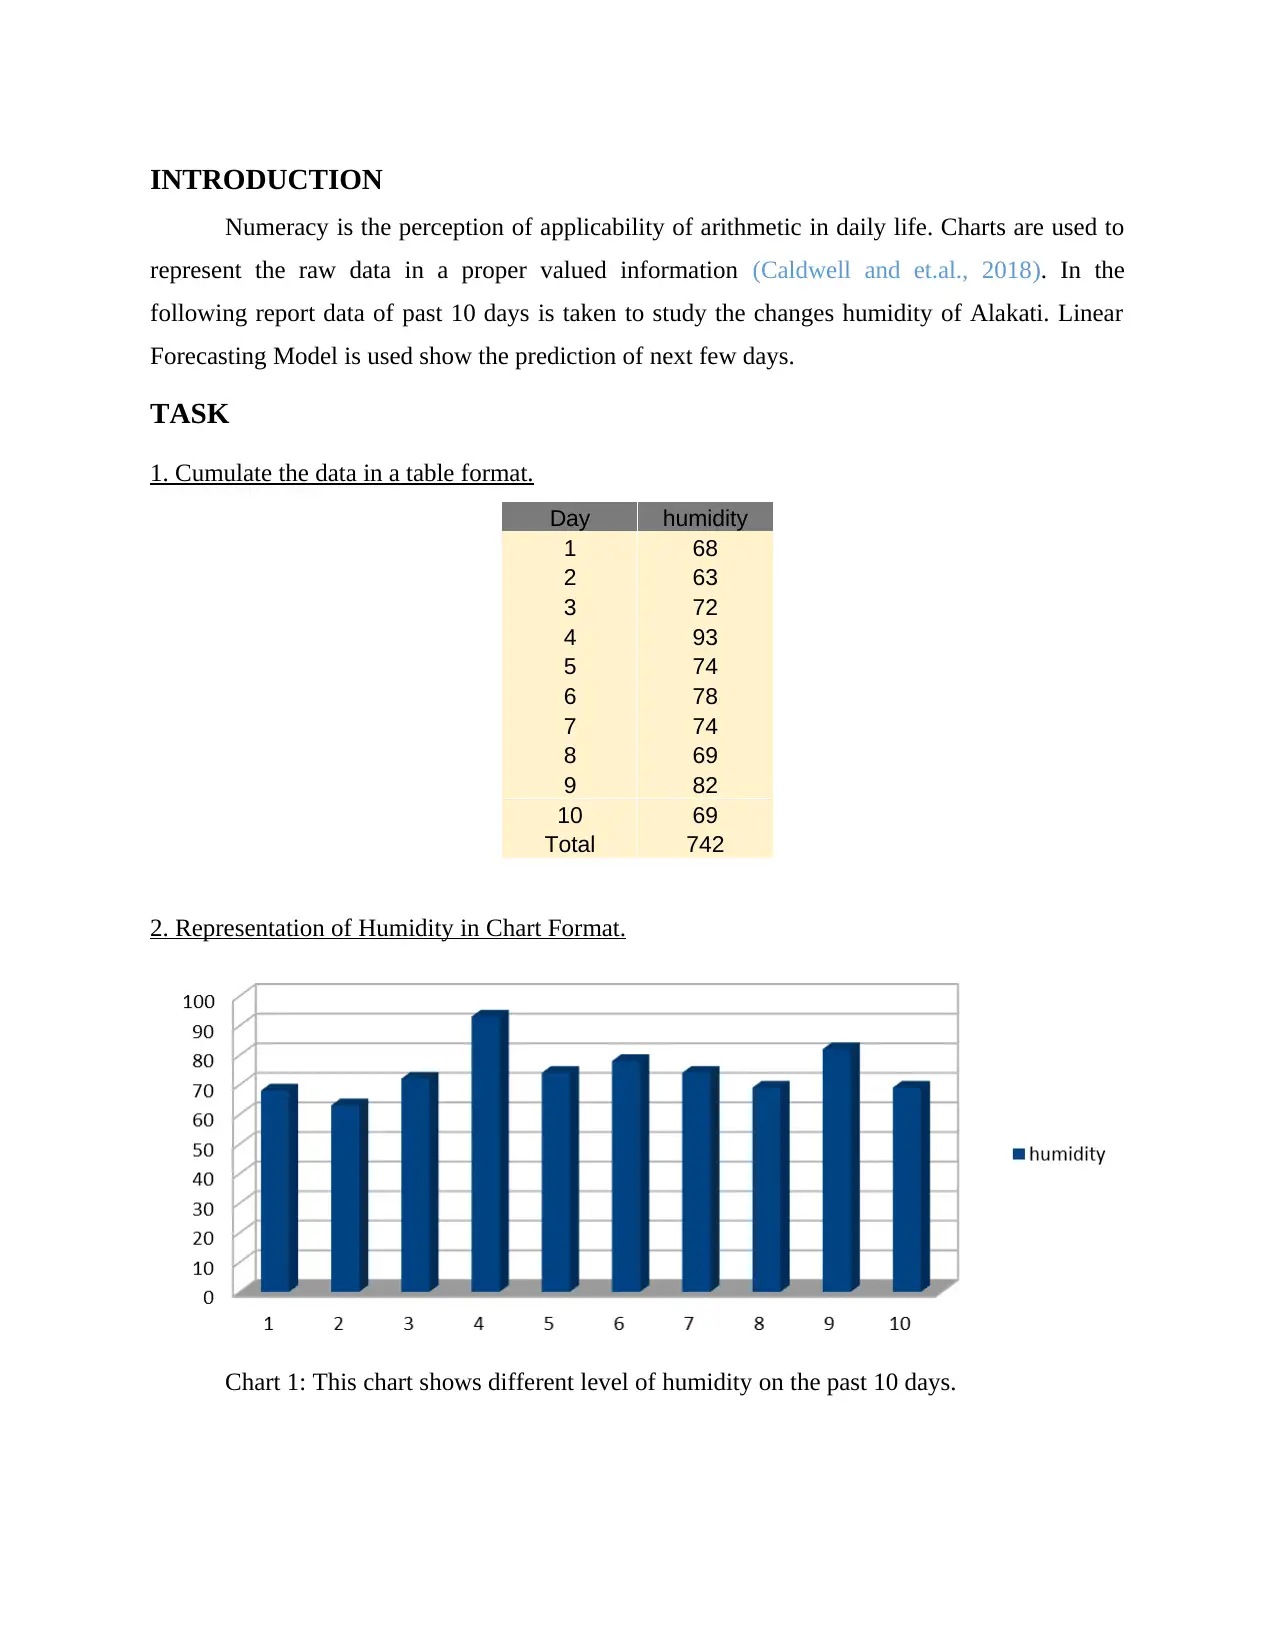
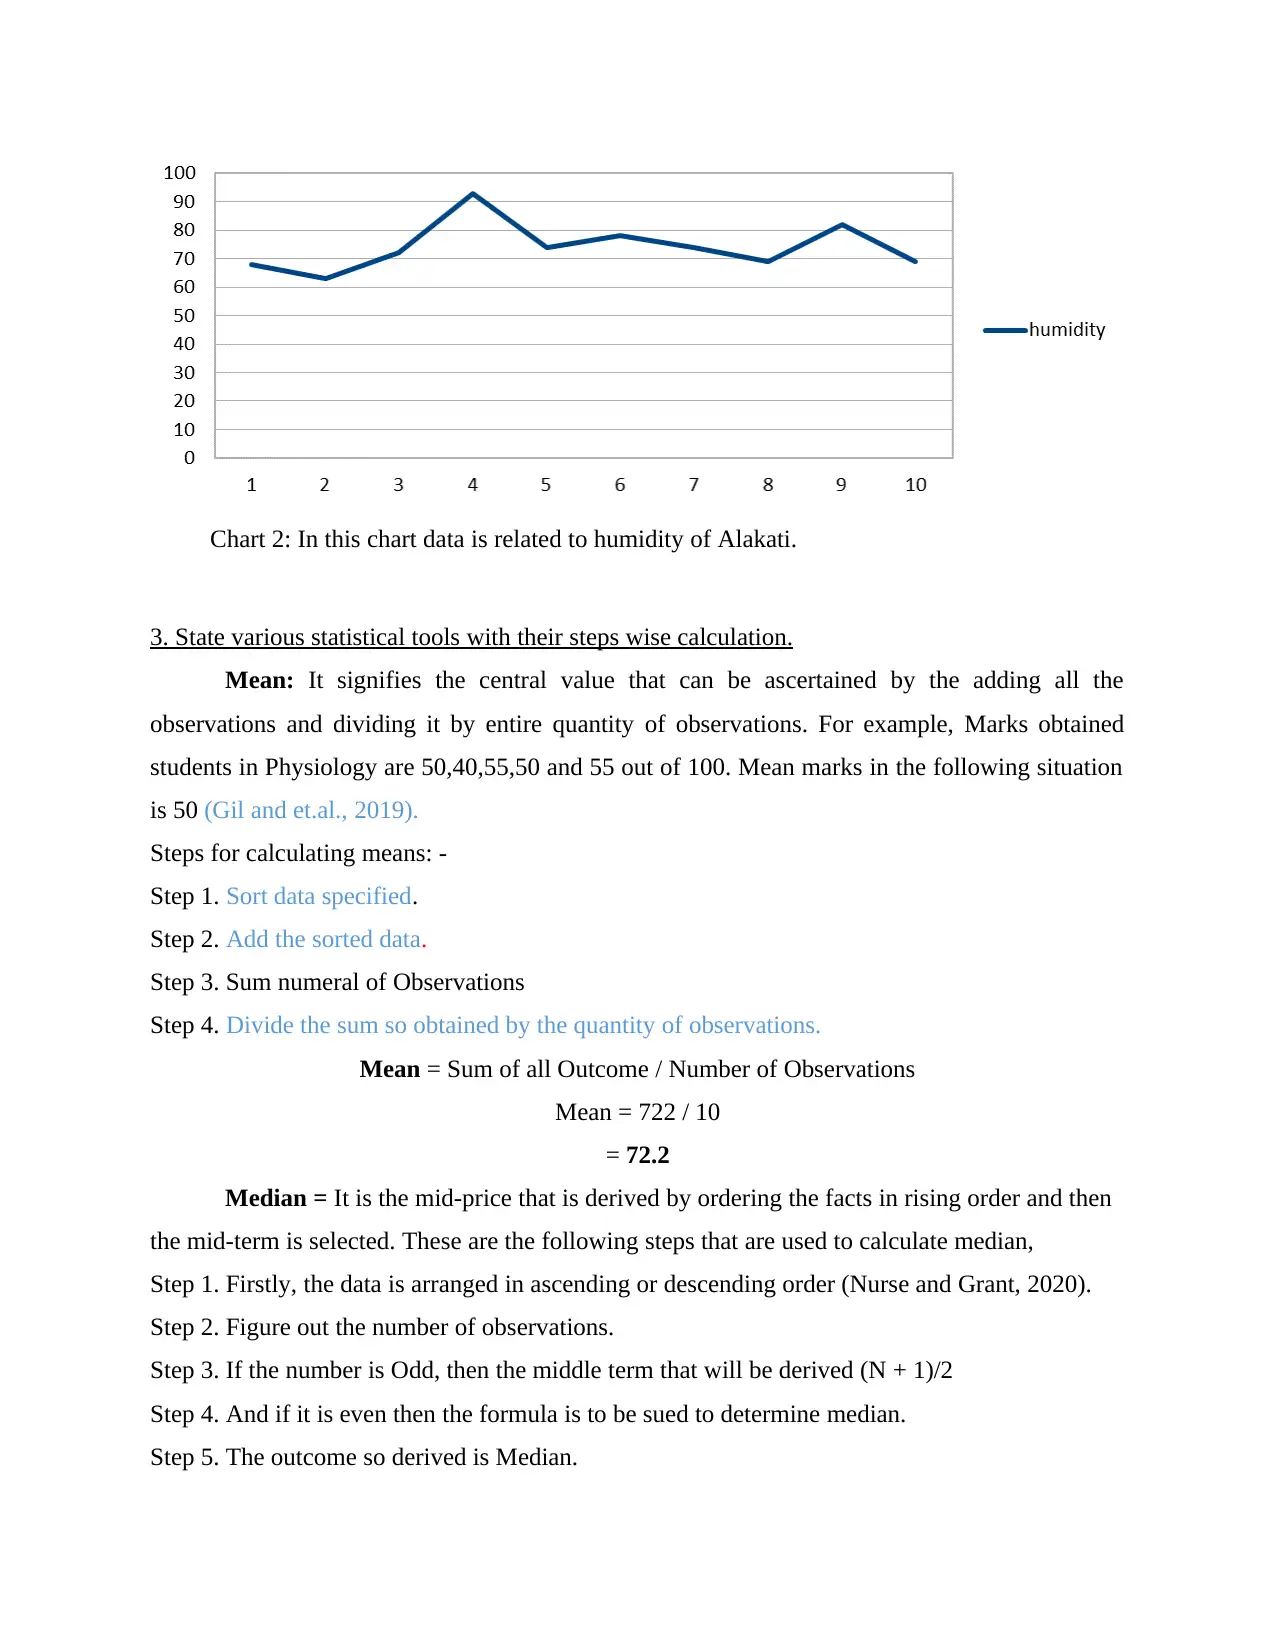
This report presents a data analysis and forecasting exercise focused on humidity levels in Alakati over a 10-day period. The analysis includes cumulating the data in a table format and representing it in chart formats. Various statistical tools such as mean, median, mode, range, and standard deviation are calculated to understand the central tendency and dispersion of the humidity data. A linear forecasting model is then applied to predict future humidity levels, with detailed steps provided for calculating the values of 'm' and 'c' in the linear equation. The report concludes with an analysis of the forecasted humidity for days 12 and 14, noting the potential limitations of the model and referencing the consistency of the historical data. Desklib provides access to this and other solved assignments for students.
Document Page
Data Analysis and
Forecasting
tabler-icon-diamond-filled.svg

Paraphrase This Document

Need a fresh take? Get an instant paraphrase of this document with our AI Paraphraser
Document Page
Contents
INTRODUCTION...........................................................................................................................3
TASK...............................................................................................................................................3
1. Cumulate the data in a table format.........................................................................................3
2. Representation of Humidity in Chart Format..........................................................................3
3. State various statistical tools with their steps wise calculation...............................................4
4. By using Linear Predicting model perform regression investigates and find the worth of m
and c.............................................................................................................................................6
CONCLUSION................................................................................................................................9
REFERENCES..............................................................................................................................10
Document Page
INTRODUCTION
Numeracy is the perception of applicability of arithmetic in daily life. Charts are used to
represent the raw data in a proper valued information (Caldwell and et.al., 2018). In the
following report data of past 10 days is taken to study the changes humidity of Alakati. Linear
Forecasting Model is used show the prediction of next few days.
TASK
1. Cumulate the data in a table format.
Day humidity
1 68
2 63
3 72
4 93
5 74
6 78
7 74
8 69
9 82
10 69
Total 742
2. Representation of Humidity in Chart Format.
Chart 1: This chart shows different level of humidity on the past 10 days.
Document Page
Chart 2: In this chart data is related to humidity of Alakati.
3. State various statistical tools with their steps wise calculation.
Mean: It signifies the central value that can be ascertained by the adding all the
observations and dividing it by entire quantity of observations. For example, Marks obtained
students in Physiology are 50,40,55,50 and 55 out of 100. Mean marks in the following situation
is 50 (Gil and et.al., 2019).
Steps for calculating means: -
Step 1. Sort data specified.
Step 2. Add the sorted data.
Step 3. Sum numeral of Observations
Step 4. Divide the sum so obtained by the quantity of observations.
Mean = Sum of all Outcome / Number of Observations
Mean = 722 / 10
= 72.2
Median = It is the mid-price that is derived by ordering the facts in rising order and then
the mid-term is selected. These are the following steps that are used to calculate median,
Step 1. Firstly, the data is arranged in ascending or descending order (Nurse and Grant, 2020).
Step 2. Figure out the number of observations.
Step 3. If the number is Odd, then the middle term that will be derived (N + 1)/2
Step 4. And if it is even then the formula is to be sued to determine median.
Step 5. The outcome so derived is Median.
tabler-icon-diamond-filled.svg

Paraphrase This Document

Need a fresh take? Get an instant paraphrase of this document with our AI Paraphraser
Document Page
Median: If 'N' is odd = (N+1) / 2
If 'N' is even = (N / 2)
Given data is in percentage:
61,55,58,91,78,93,88,59,57,82
55,57,58,59,61,78,82,88,91,91
Median = (N / 2)
= 10 / 2
= 5th Position
Median = 61
Mode: It is the price that have recurring the maximum in a sequence (Henry and
Peytcheva, M., 2018).
Steps to be calculate Mode:
Step 1: Data is collected and prepared in rising or declining order.
Step 2: Find out the value which has repeated the most.
Step 3: Count the quantity of times the number has incurred.
Step 4: The value which have incurred most times is Mode.
Mode = 91
From the above calculations the mode of the data is
Range: It is the worth which is derived after subtracting the bottom value from the
maximum value of data. If the range is large then it does not form part of chief tendency and if
the range is minor then it is the portion of the chief tendency (Hopfenbeck and Thomas, 2020).
Steps for calculating Range:
Step 1. Sort the given data.
Step 2. Figure out the highest and the lowest value from the data given.
Step 3. Lowest value is deducted from the highest value.
Step 4. The value so resultant is Range.
Range = Highest Value – Lowest Value
Range = 93 - 55
Range = 38
Document Page
Standard Deviation: It is the value which is derived by considering the amount of
deviation from the mean.
Following are the steps to calculate Standard Deviation:
Step 1. Firstly, ascertain the Mean of the data.
Step 2. Then the difference of each observation is calculated after deducting mean value from it.
Step 3. The value derived is the summed up.
Step 4. Divide the sum by the number of observations.
Step 5. At last square root of the data is calculated.
Standard Deviation= √ (xi – μ) 2 / N
= √ (2193.6) / 10
= √ 21.94
= 4.68
4. By using Linear Predicting model perform regression investigates and find the worth of m and
c.
Linear Forecasting Model: - This model helps in ascertaining the future value based on
the past observations.
y = mx + c
'y' is the Reliant Factor
'mx' is the Self-governing Factor
'c' is the constant
Steps for calculating m value,
1. Multiply date and humidity which are termed as x and y variable.
2. Add all the values calculated.
3. Sum of the x factor and y variable individually.
4. Multiply the variables.
5. Calculate ( x) 2 and assign the values in the formula.
6. The derived of 'm'.
Document Page
m= 10 (4078) – (55) * (722) / 10 * (385) – (55) 2
m= 40780 – 39710 / 3850 - 3025
m= 1070 / 825
m= 1.30
Steps of calculation value of 'c'
1. Firstly, determine the summation of ‘x’ factor.
2. Compute the summation of 'y' factor.
3. Divide the result by 'N'.
4. The amount so derived is value of 'c'.
c= 722 – (1.30) * (55) / 10
c = (722 - 71.75) / 10
= 650.25 / 10
= 65.03
Humidity on Day 12: -
m= 1.30, c= 65.03, x= 12,
y= mx + c
y= 1.30(12) + 65.03
y = 15.6 + 65.03
y = 80.63
Humidity on Day 14: -
m= 1.30, c= 65.03, x=14
y= mx+ c
y= 1.30 (14) + 65.03
tabler-icon-diamond-filled.svg

Paraphrase This Document

Need a fresh take? Get an instant paraphrase of this document with our AI Paraphraser
Document Page
y= 18.2 + 65.03
y= 83.23
Analysis: The above calculated linear forecasting model helps in determining the
temperature which may be occur on the day 12 and 14. It is only forecasted it may be possible
that the temperature on the following day may be different from the result showed. It can be seen
from the data of last 10 days that the fluctuation in the temperature is not much, thus it may be
possible that the data is not fluctuated from the other day in the last 10 days.
Document Page
CONCLUSION
From the above report it shows data of Alakati in Table 1. which shows stickiness of earlier 10
days. Both the chart shows the humidity of the city. Arithmetical tools are used to ascertain the
humidity level of the city. From the above calculations it can be seen that the mean is 72.2,
median is 61 and mode are 91. The Range of the data is 38 and Standard deviation is 4.68. Linear
Forecasting Model is used to forecast the humidity of Day 12 and Day 14 that are 80.63 and
83.23.
Document Page
REFERENCES
Books and Journals
Caldwell, E.P. and et.al., 2018. The use of the newest vital sign health literacy instrument
in adolescents with sickle cell disease. Journal of Pediatric Oncology Nursing, 35(5), pp.361-
367.
Gil, J. and et.al., 2019. Early childhood developmental delay in 63 low-and middle-
income countries: prevalence and inequalities estimated from national health surveys. Available
at SSRN 3386281.
Henry, E. and Peytcheva, M., 2018. Earnings-announcement narrative and investor
judgment. Accounting Horizons, 32(3), pp.123-143.
Hopfenbeck, T.N. and Thomas, S.M., 2020. Harvey Goldstein: a tribute and
appreciation. Assessment in Education: Principles, Policy & Practice, 27(3), pp.312-317.
Ouyang, X. and et.al., 2021. Antecedents and consequences of young children's interest
in mathematics. Early Childhood Research Quarterly, 57, pp.51-60.
chevron_up_icon
1 out of 10
circle_padding
hide_on_mobile
zoom_out_icon
[object Object]