Comprehensive Analysis of Data and Information Management Processes

Verified

Added on  2022/12/30

|13
|867
|96
Report
AI Summary
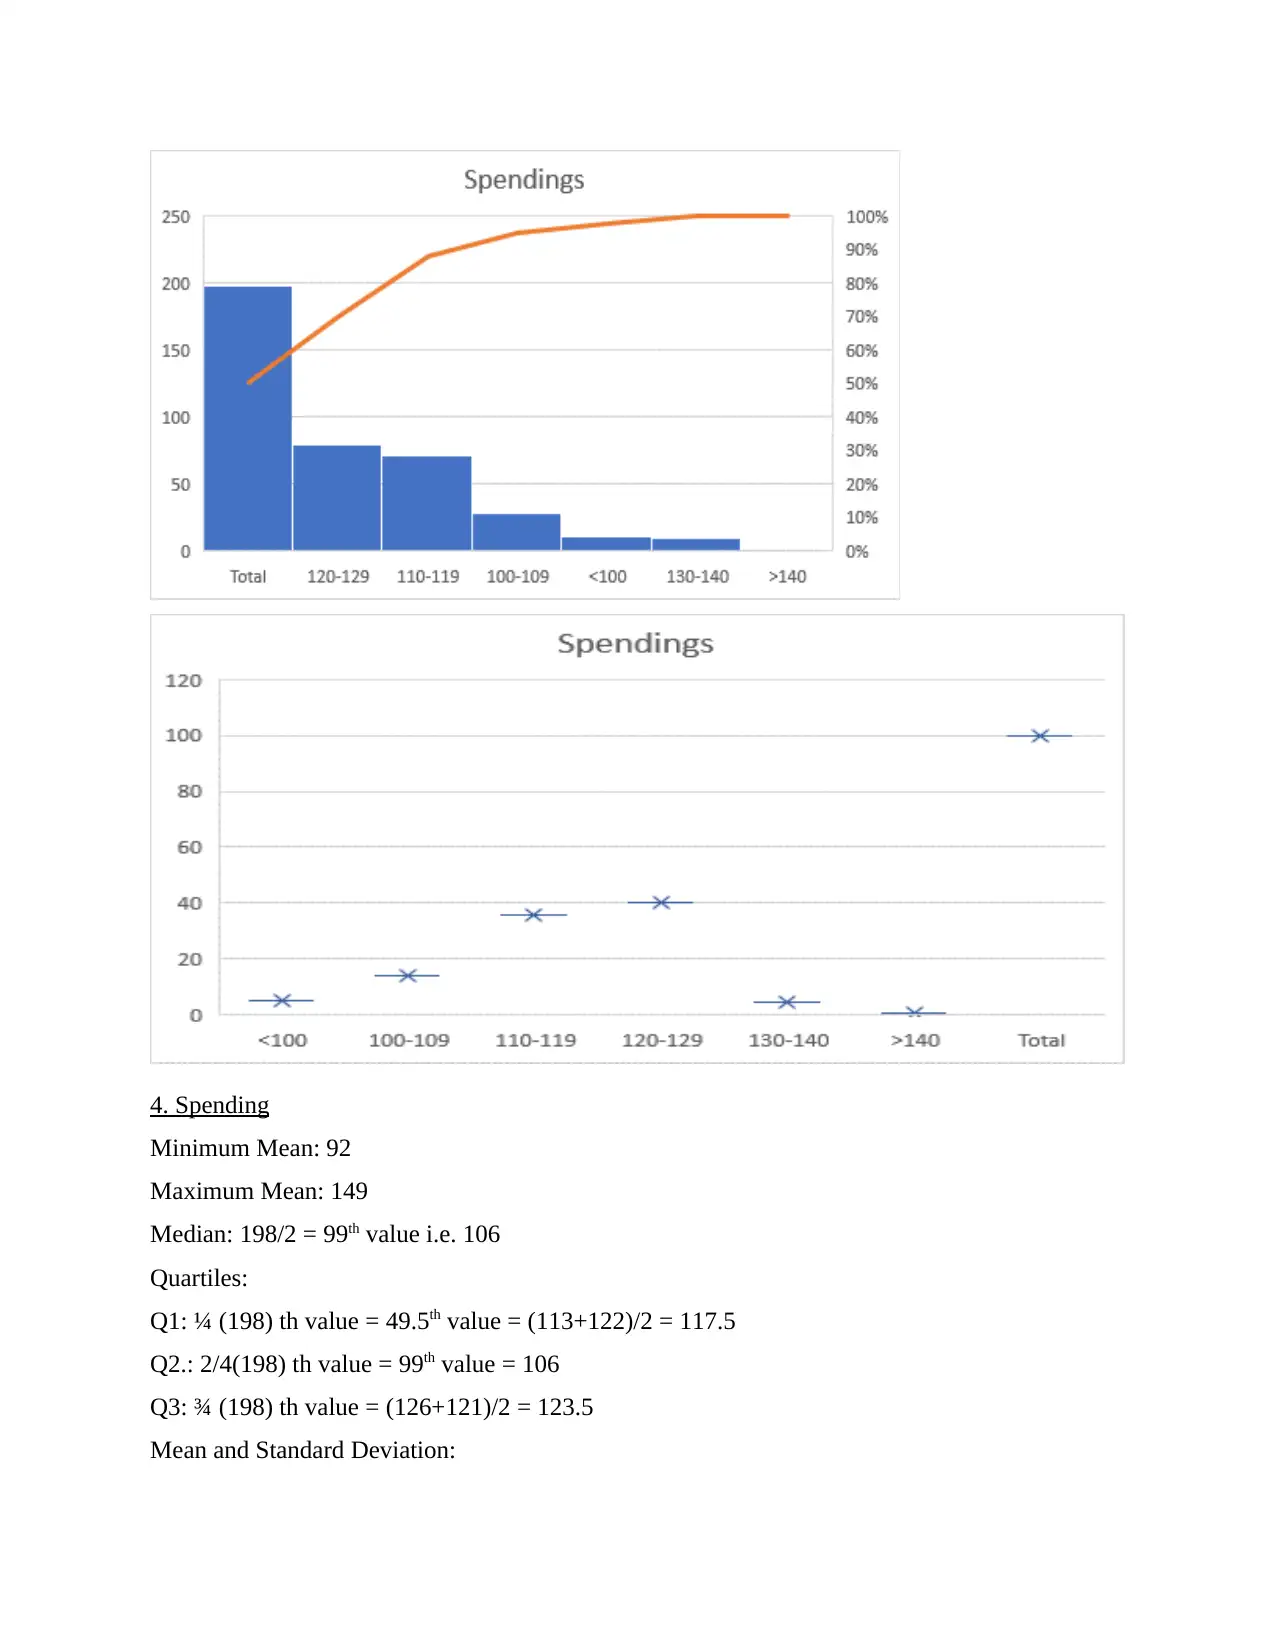
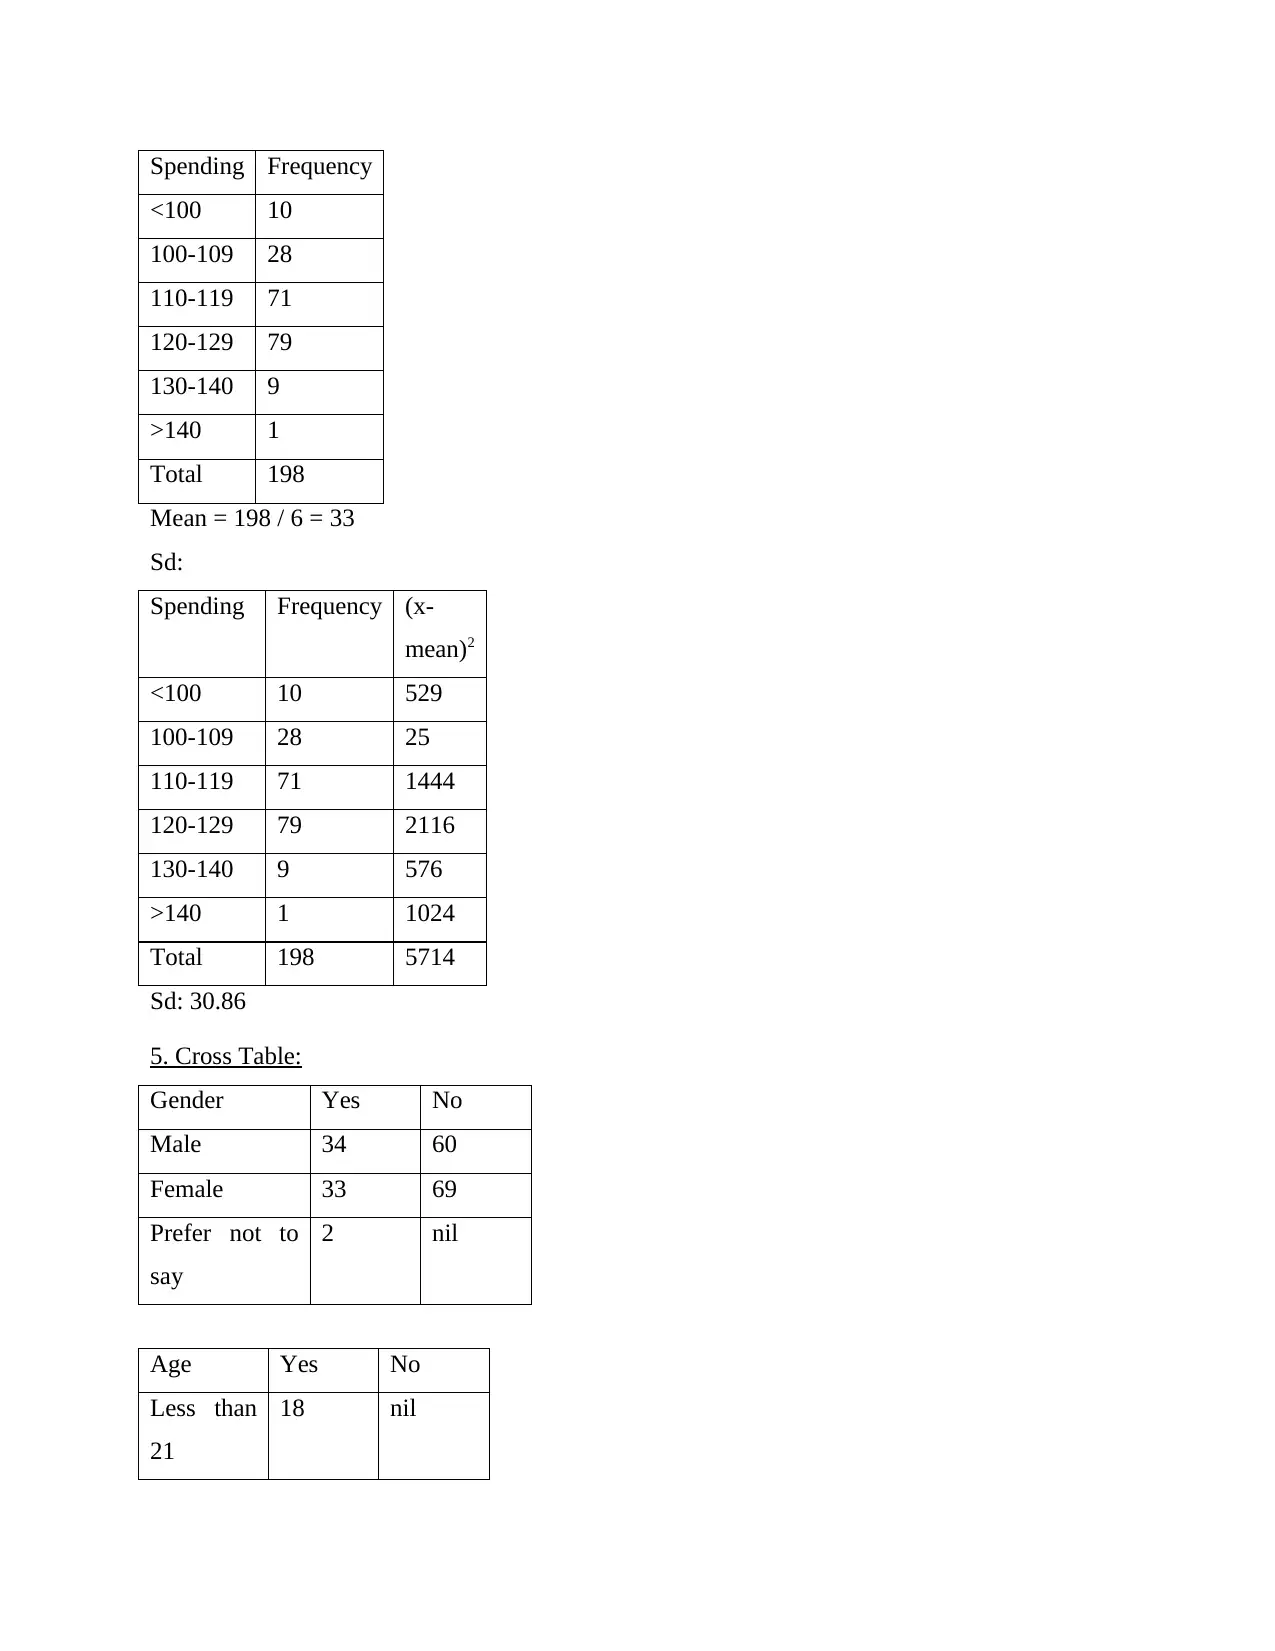
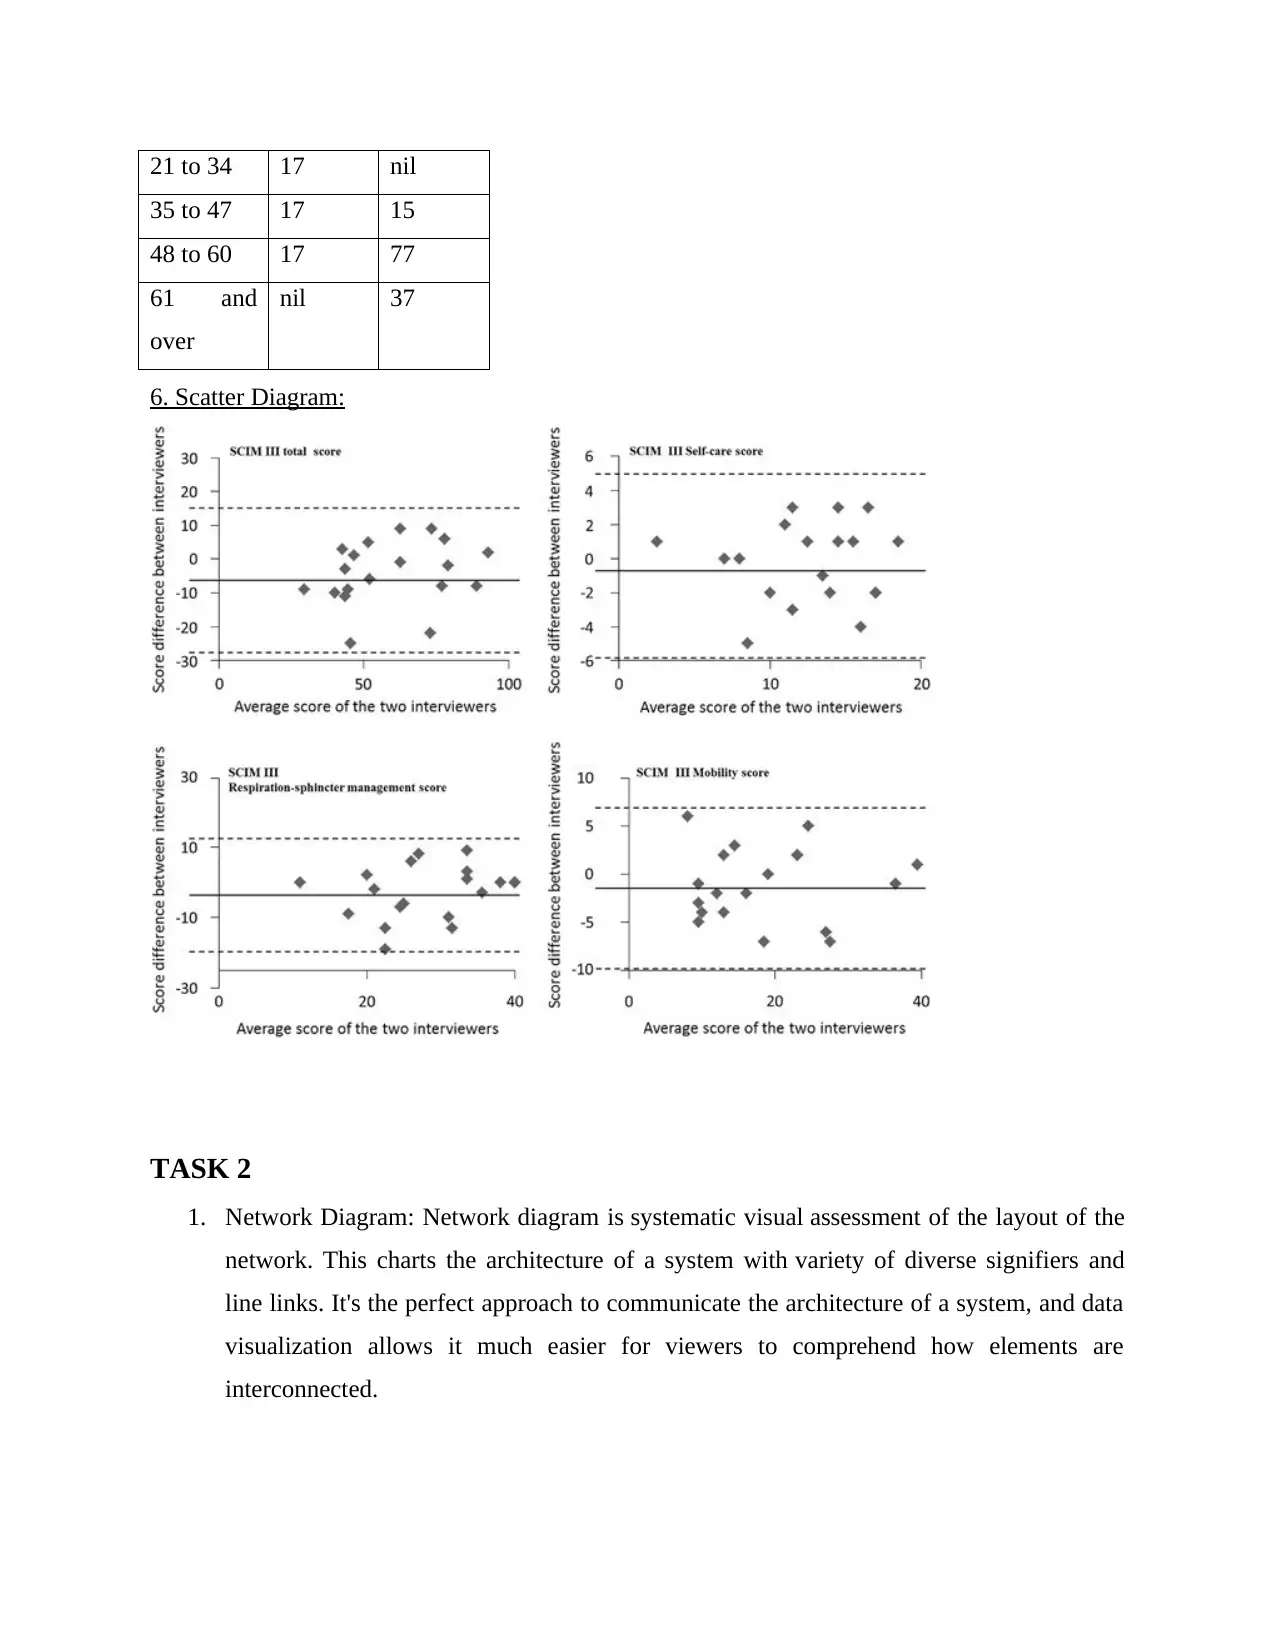
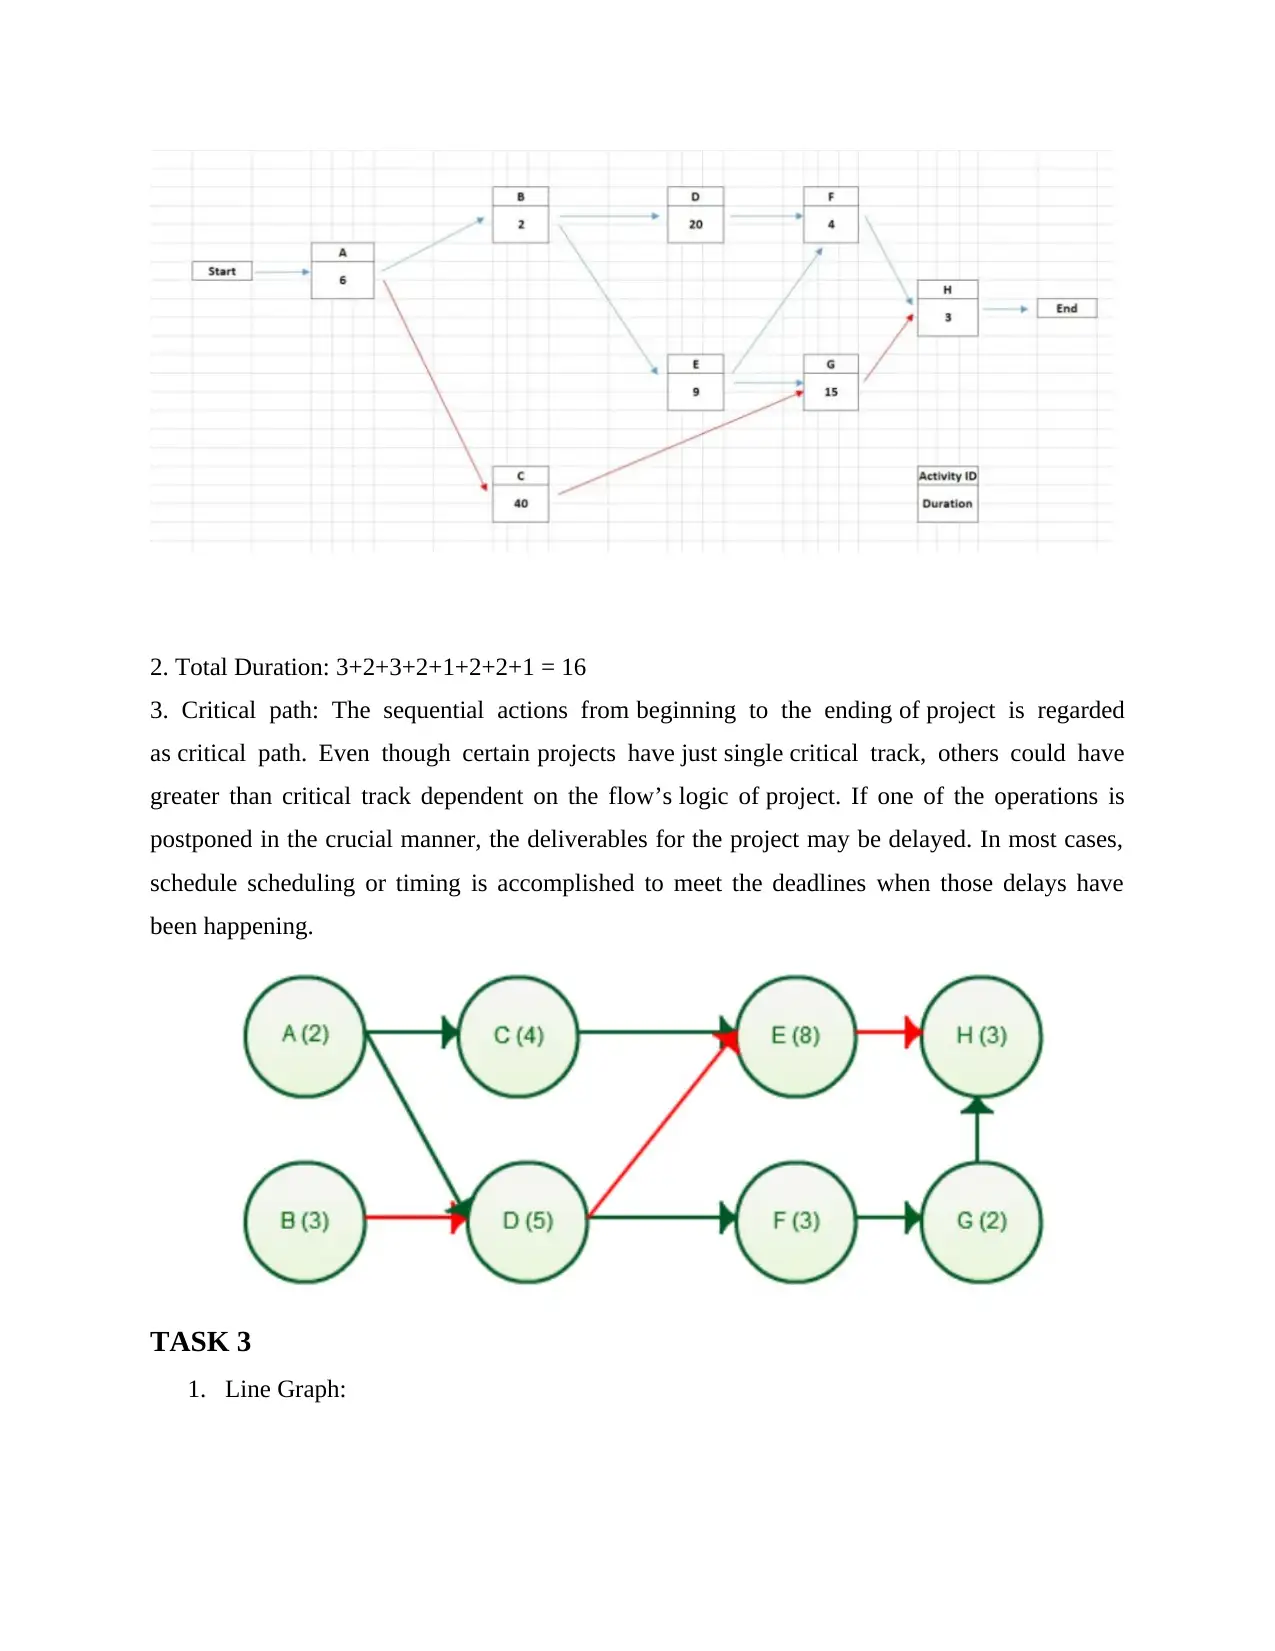
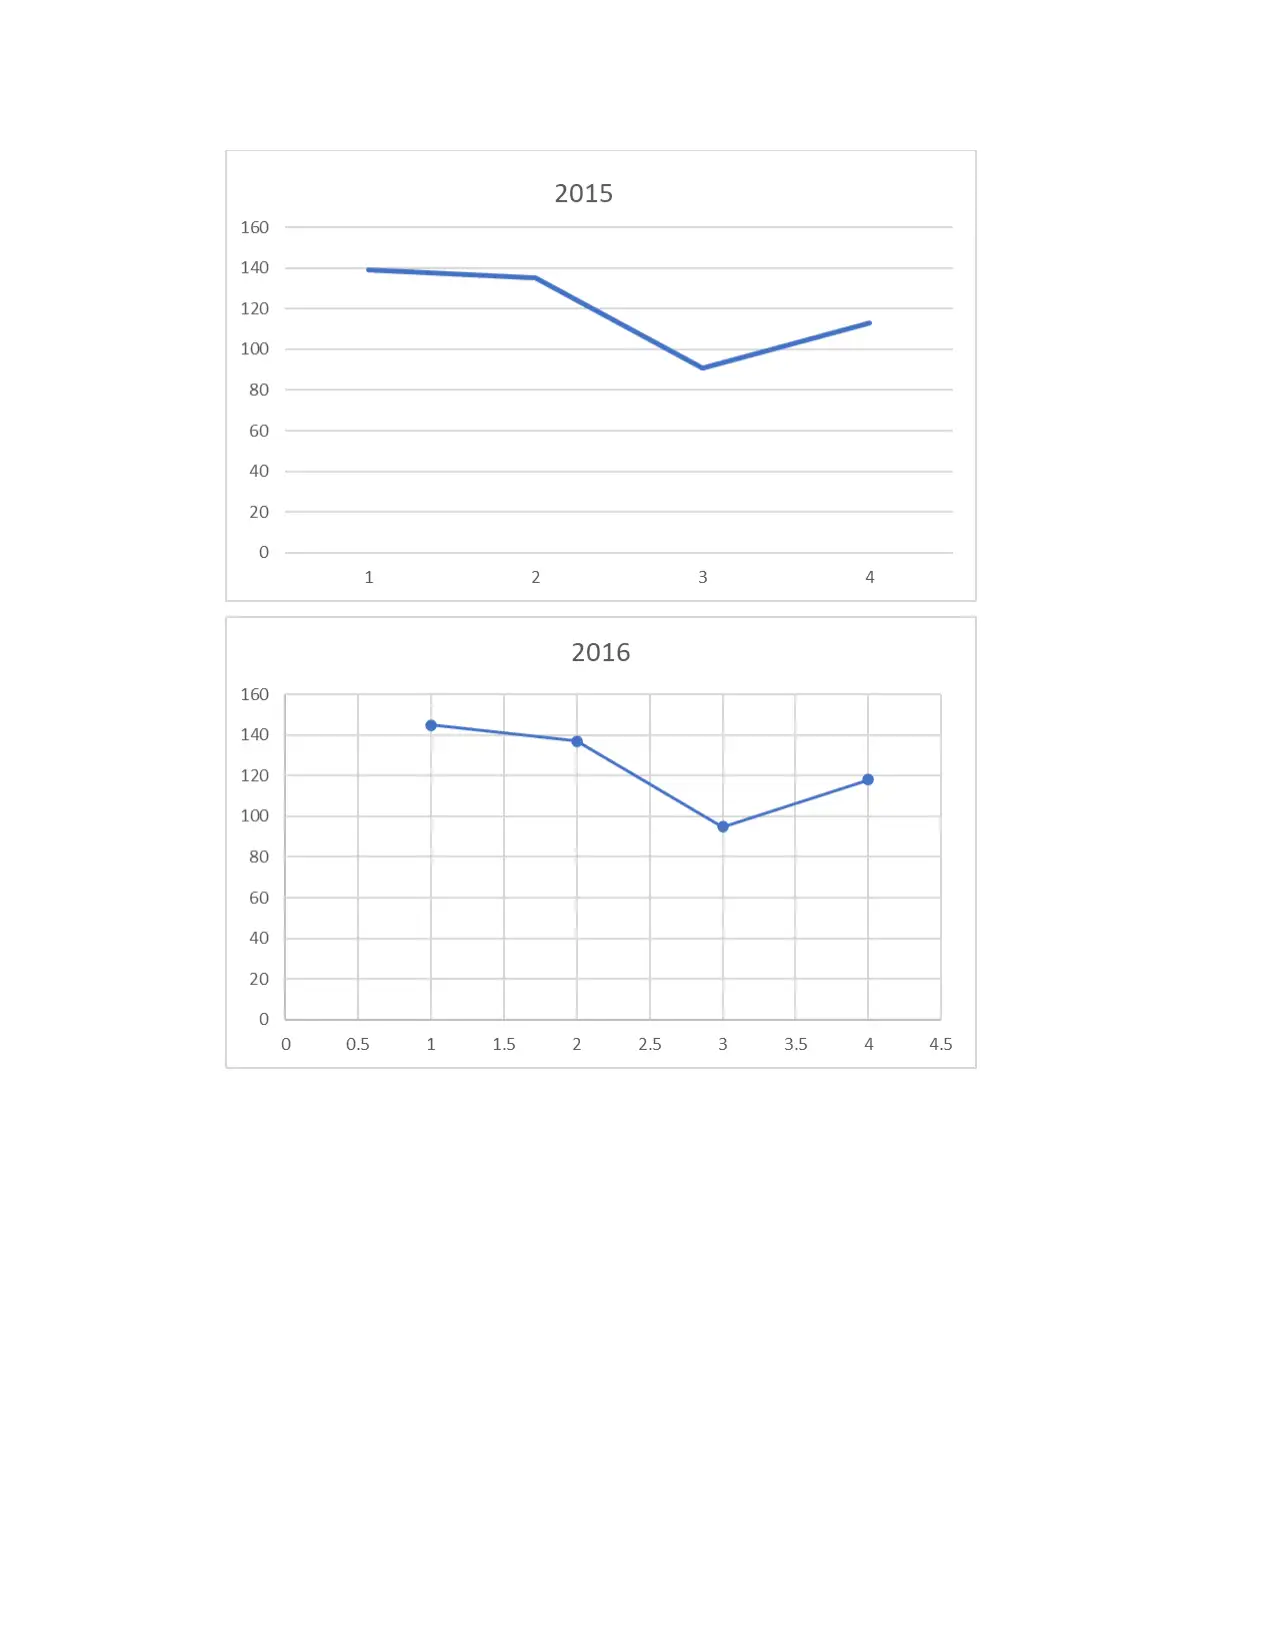
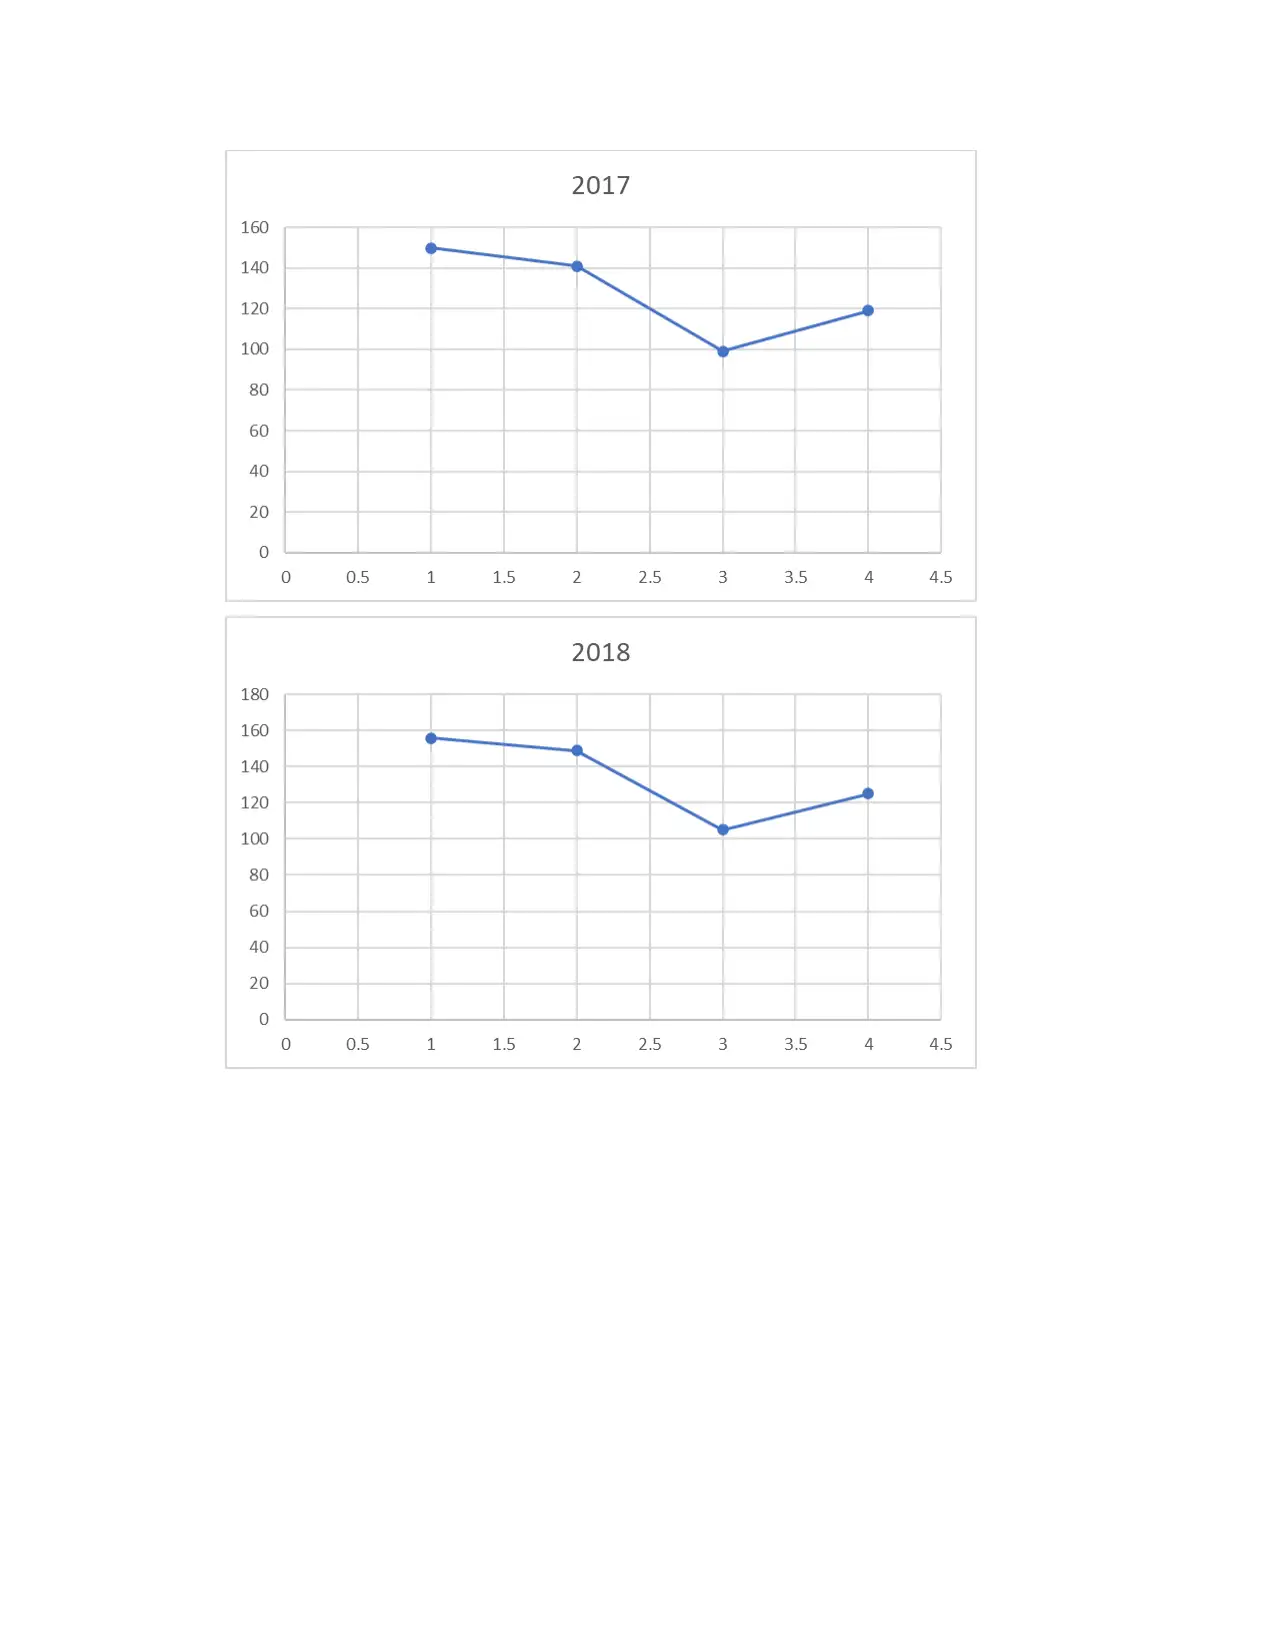
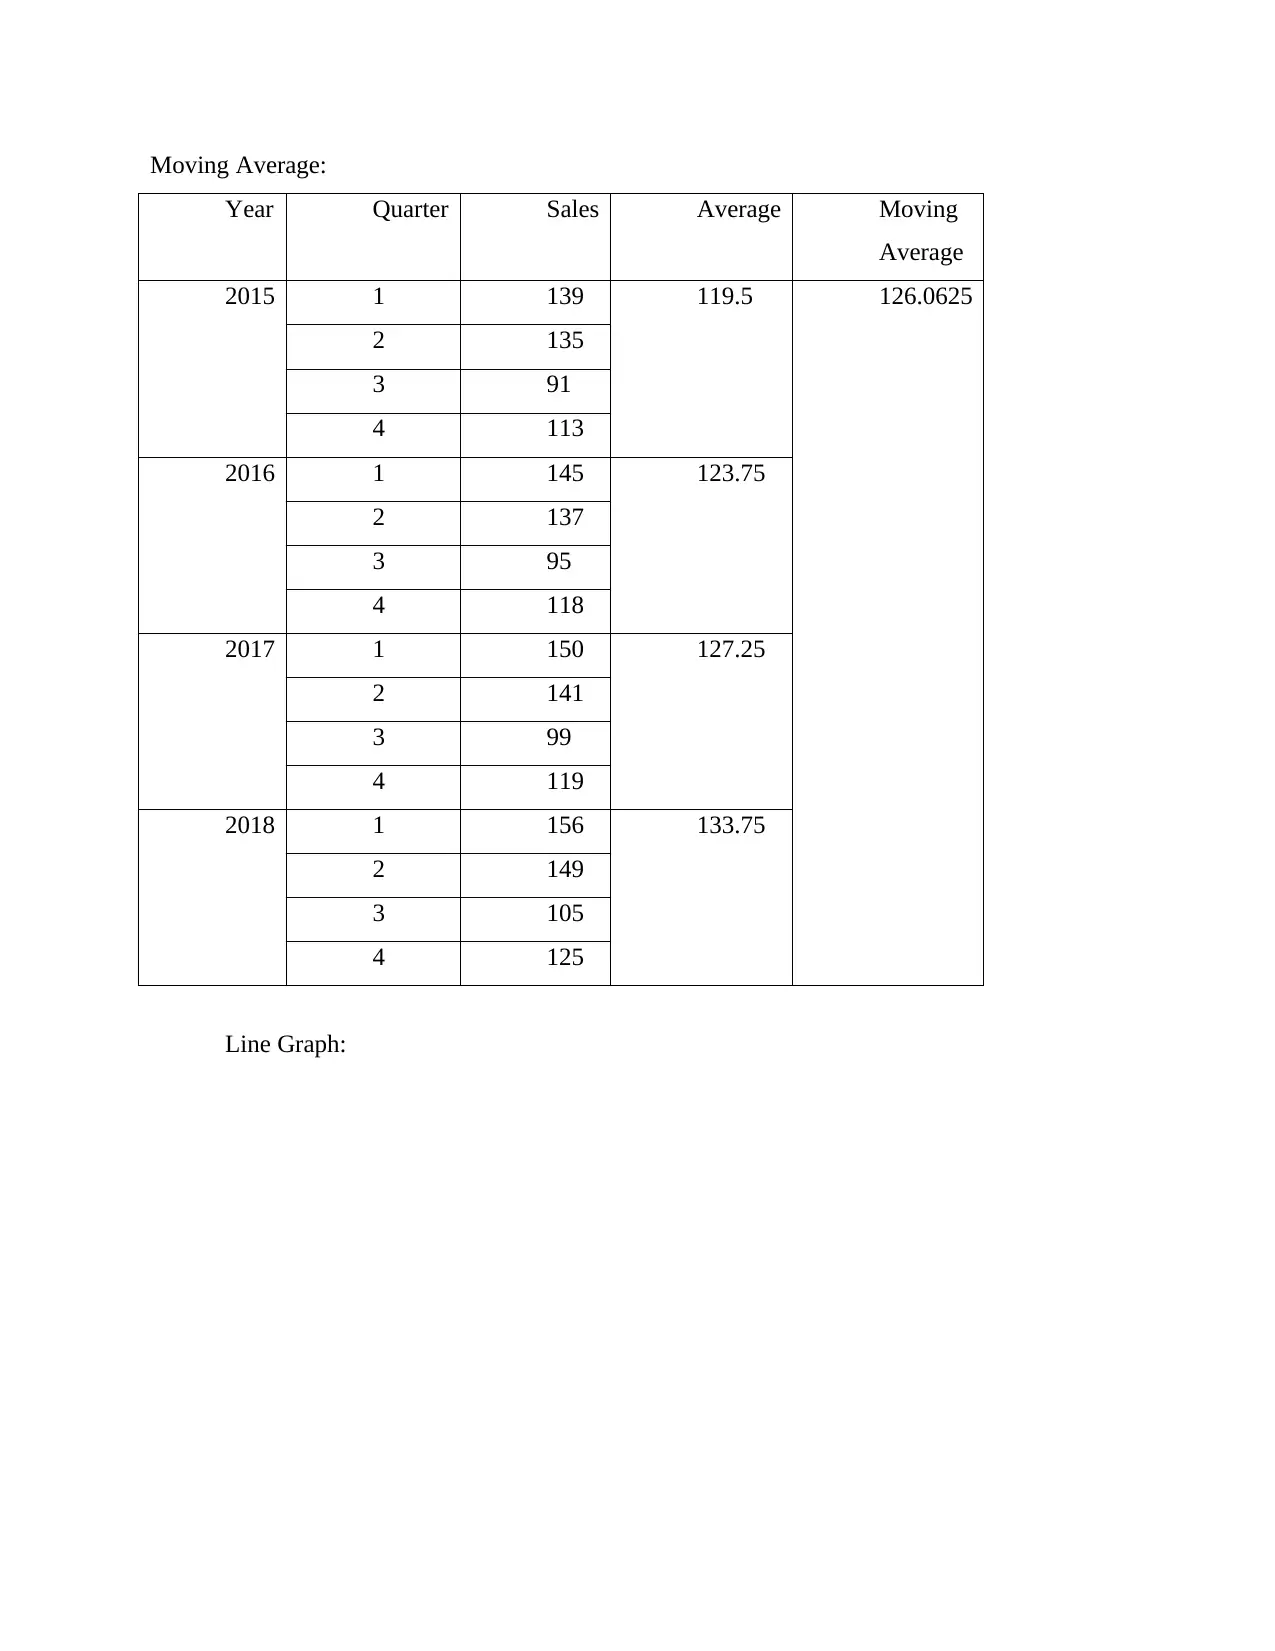
This report provides a comprehensive analysis of data management and information processing. Task 1 focuses on labeling codes, creating frequency and percentage frequency tables, and generating graphical representations, including bar charts and pie charts. It also delves into spending analysis, cross tables, and scatter diagrams to visualize relationships between variables. Task 2 explores network diagrams and critical path analysis to understand project timelines and dependencies. Task 3 utilizes line graphs and moving averages to analyze sales trends over time, providing insights into seasonal variations and overall performance. The report concludes with a summary of findings and their implications for effective data management and decision-making.
Document Page
Managing Data and Information
tabler-icon-diamond-filled.svg

Paraphrase This Document

Need a fresh take? Get an instant paraphrase of this document with our AI Paraphraser
Document Page
Contents
INTRODUCTION...........................................................................................................................3
TASK 1............................................................................................................................................3
1. Label the codes for categories:...........................................................................................3
2. Frequency and percentage frequency tables:......................................................................3
3. Graphical representation:....................................................................................................5
4. Spending.............................................................................................................................6
5. Cross Table:........................................................................................................................7
6. Scatter Diagram:.................................................................................................................8
TASK 2............................................................................................................................................8
TASK 3............................................................................................................................................9
CONCLUSION..............................................................................................................................13
Document Page
INTRODUCTION
Data management processing is a channel of picking up, application and exploiting data
in secure, consistent and budgeted way. The task of data management processes is to help
individuals, corporations and associated depts strengthen the usage of details
within legislative regulatory frameworks in such way as to make vital decisions and actions that
significantly improve the economic advantages of the corporation. A thorough data collection
approach is expanding increasingly crucial than ever, because businesses increasingly
concentrating on value-generating intangibles. The study-report includes various areas of usage
and also data analysis across various tasks.
TASK 1
1. Label the codes for categories:
Gender:
1. Male? 2. Female? 3. Prefer not to say
Age:
1. Less than 21 2. 21 to 34 3. 35 to 47 4. 48 to 60 5. 61 and over
Education:
1. GCSE or below 2. A’ level or Diploma 3. Degree or further
Are you a regular user of self-checkout user:
1. Yes 2. No
2. Frequency and percentage frequency tables:
Gender
Frequency Percentage
Male 94 47.47%
Female 102 51.51%
Prefer not to
say
2 1.01%
Total 198 100%
Age Frequency Percentage
Document Page
Less than
21
18 9.09%
21 to 34 17 8.58%
35 to 47 32 16.16%
48 to 60 94 47.47%
61 and
over
37 18.68%
Total 198 100
Education Frequency Percentage
GCSE or below 67 33.83838
A’ level or
Diploma
72 36.36364
Degree or further 59 29.79798
Total 198 100
SSC
User
Frequency Percentage
Yes 69 34.84848
No 129 65.15152
Total 198 100
Spending Frequency Percentage
<100 10 5.050505
100-109 28 14.14141
110-119 71 35.85859
120-129 79 39.89899
130-140 9 4.545455
>140 1 0.505051
Total 198 100
tabler-icon-diamond-filled.svg

Paraphrase This Document

Need a fresh take? Get an instant paraphrase of this document with our AI Paraphraser
Document Page
3. Graphical representation:
Document Page
4. Spending
Minimum Mean: 92
Maximum Mean: 149
Median: 198/2 = 99th value i.e. 106
Quartiles:
Q1: ¼ (198) th value = 49.5th value = (113+122)/2 = 117.5
Q2.: 2/4(198) th value = 99th value = 106
Q3: ¾ (198) th value = (126+121)/2 = 123.5
Mean and Standard Deviation:
Document Page
Spending Frequency
<100 10
100-109 28
110-119 71
120-129 79
130-140 9
>140 1
Total 198
Mean = 198 / 6 = 33
Sd:
Spending Frequency (x-
mean)2
<100 10 529
100-109 28 25
110-119 71 1444
120-129 79 2116
130-140 9 576
>140 1 1024
Total 198 5714
Sd: 30.86
5. Cross Table:
Gender Yes No
Male 34 60
Female 33 69
Prefer not to
say
2 nil
Age Yes No
Less than
21
18 nil
tabler-icon-diamond-filled.svg

Paraphrase This Document

Need a fresh take? Get an instant paraphrase of this document with our AI Paraphraser
Document Page
21 to 34 17 nil
35 to 47 17 15
48 to 60 17 77
61 and
over
nil 37
6. Scatter Diagram:
TASK 2
1. Network Diagram: Network diagram is systematic visual assessment of the layout of the
network. This charts the architecture of a system with variety of diverse signifiers and
line links. It's the perfect approach to communicate the architecture of a system, and data
visualization allows it much easier for viewers to comprehend how elements are
interconnected.
Document Page
2. Total Duration: 3+2+3+2+1+2+2+1 = 16
3. Critical path: The sequential actions from beginning to the ending of project is regarded
as critical path. Even though certain projects have just single critical track, others could have
greater than critical track dependent on the flow’s logic of project. If one of the operations is
postponed in the crucial manner, the deliverables for the project may be delayed. In most cases,
schedule scheduling or timing is accomplished to meet the deadlines when those delays have
been happening.
TASK 3
1. Line Graph:
Document Page
tabler-icon-diamond-filled.svg

Paraphrase This Document

Need a fresh take? Get an instant paraphrase of this document with our AI Paraphraser
Document Page
Document Page
Moving Average:
Year Quarter Sales Average Moving
Average
2015 1 139 119.5 126.0625
2 135
3 91
4 113
2016 1 145 123.75
2 137
3 95
4 118
2017 1 150 127.25
2 141
3 99
4 119
2018 1 156 133.75
2 149
3 105
4 125
Line Graph:
chevron_up_icon
1 out of 13
circle_padding
hide_on_mobile
zoom_out_icon
[object Object]