Assignment: Using and Managing Data and Information Analysis

Verified

Added on  2022/12/17

|11
|504
|54
Homework Assignment
AI Summary
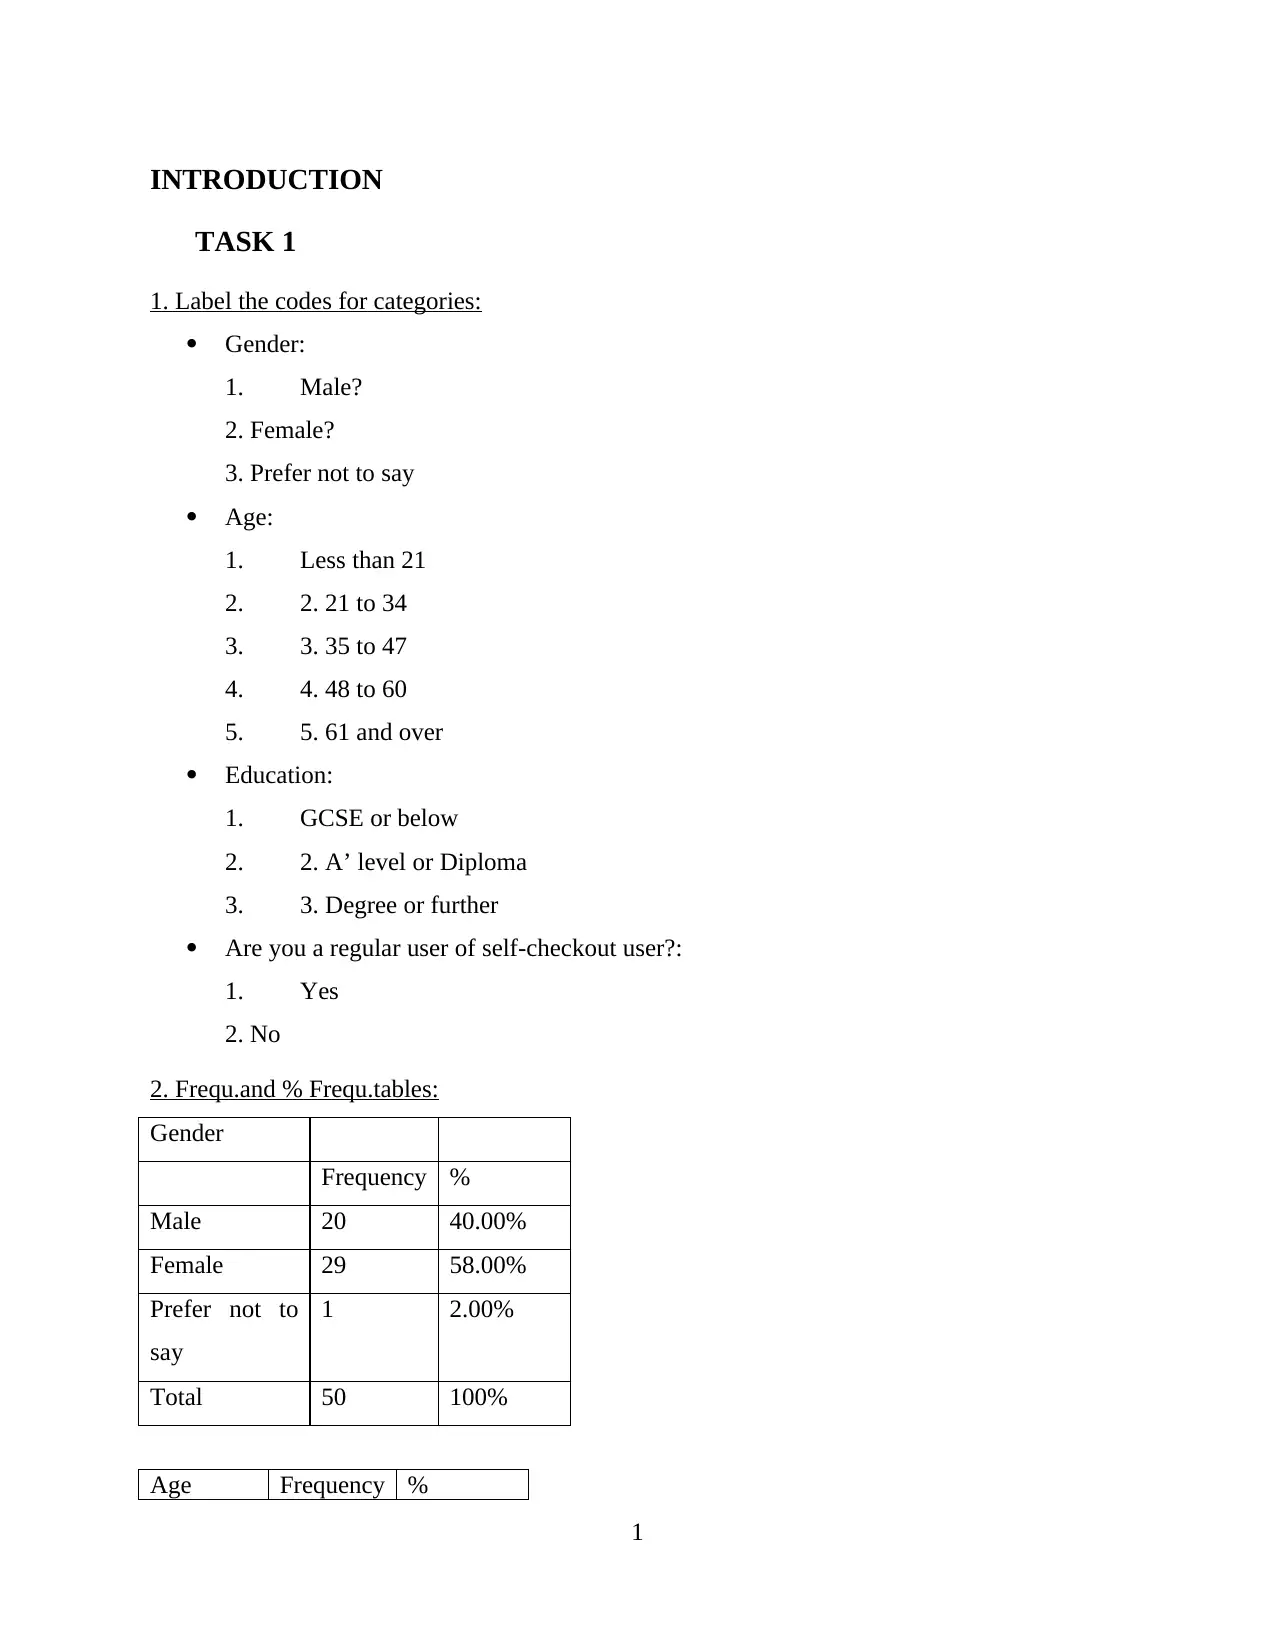
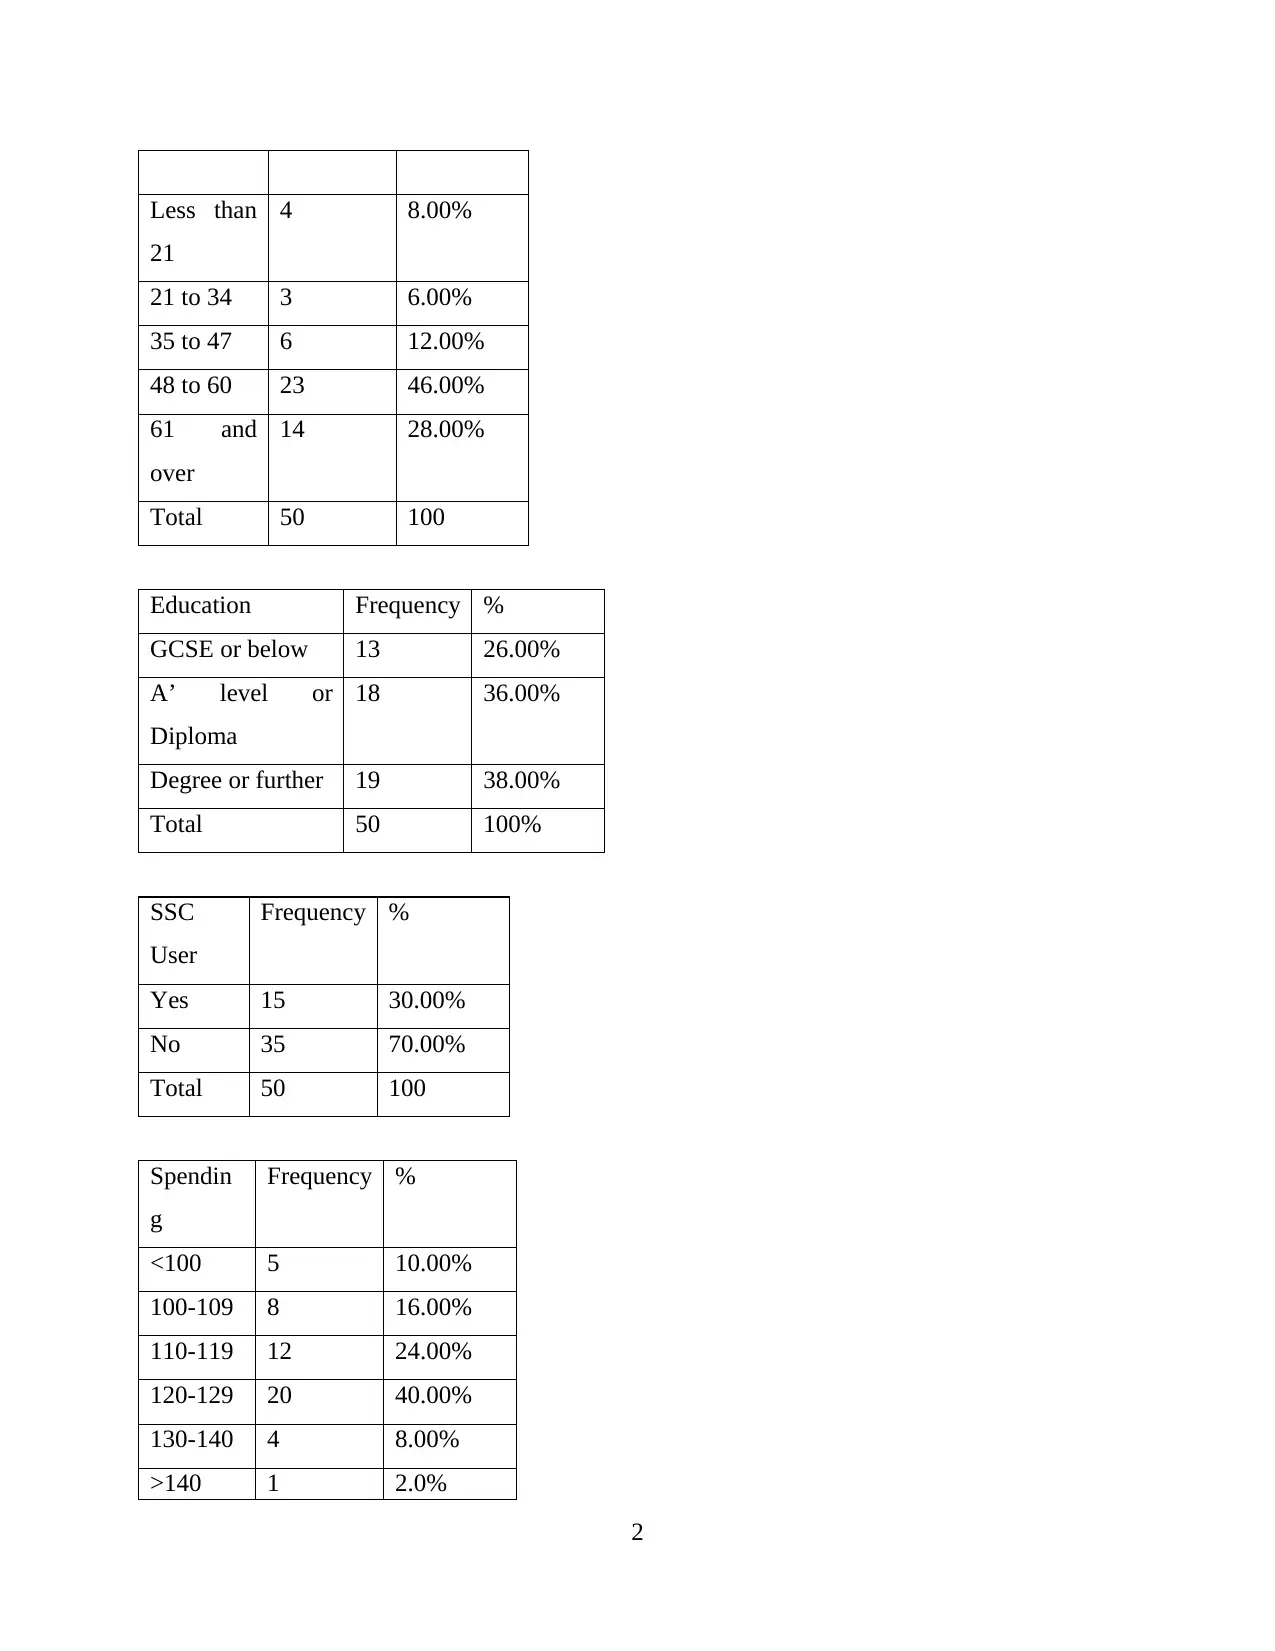
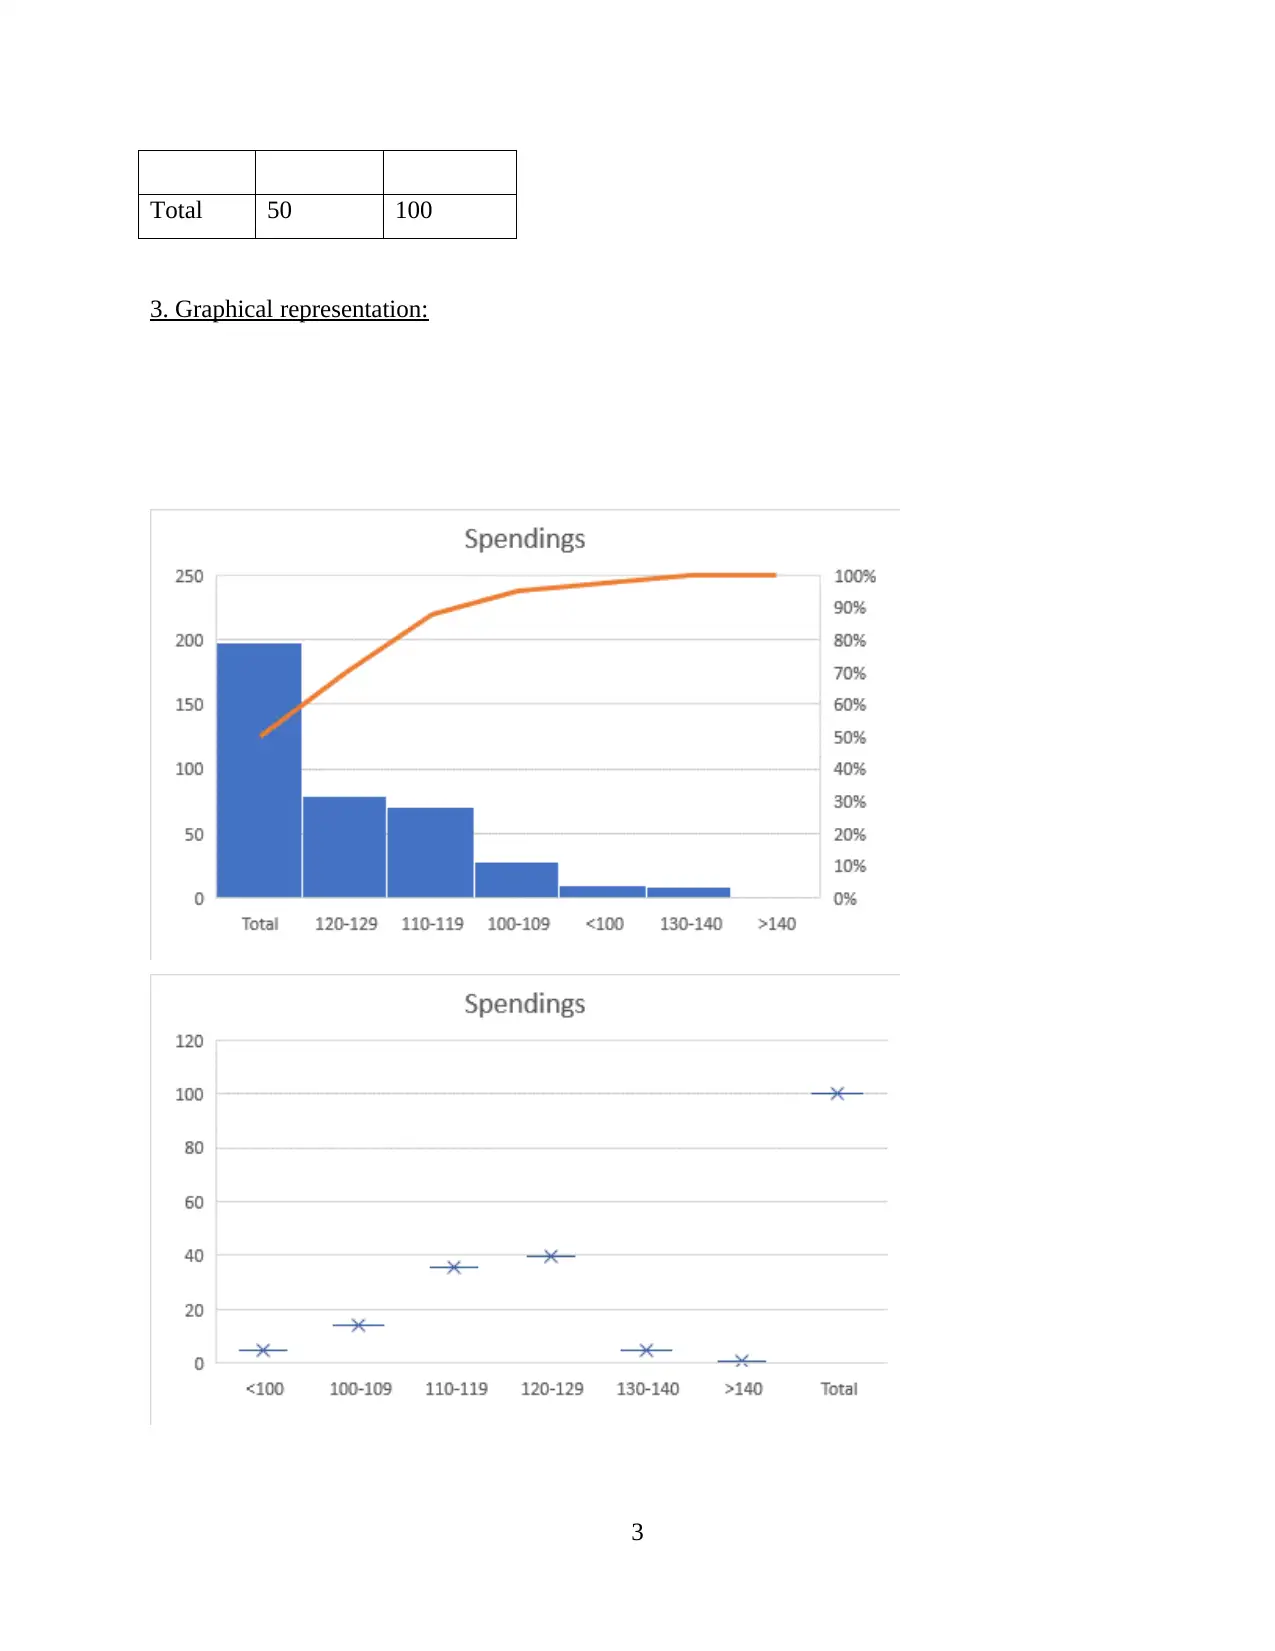
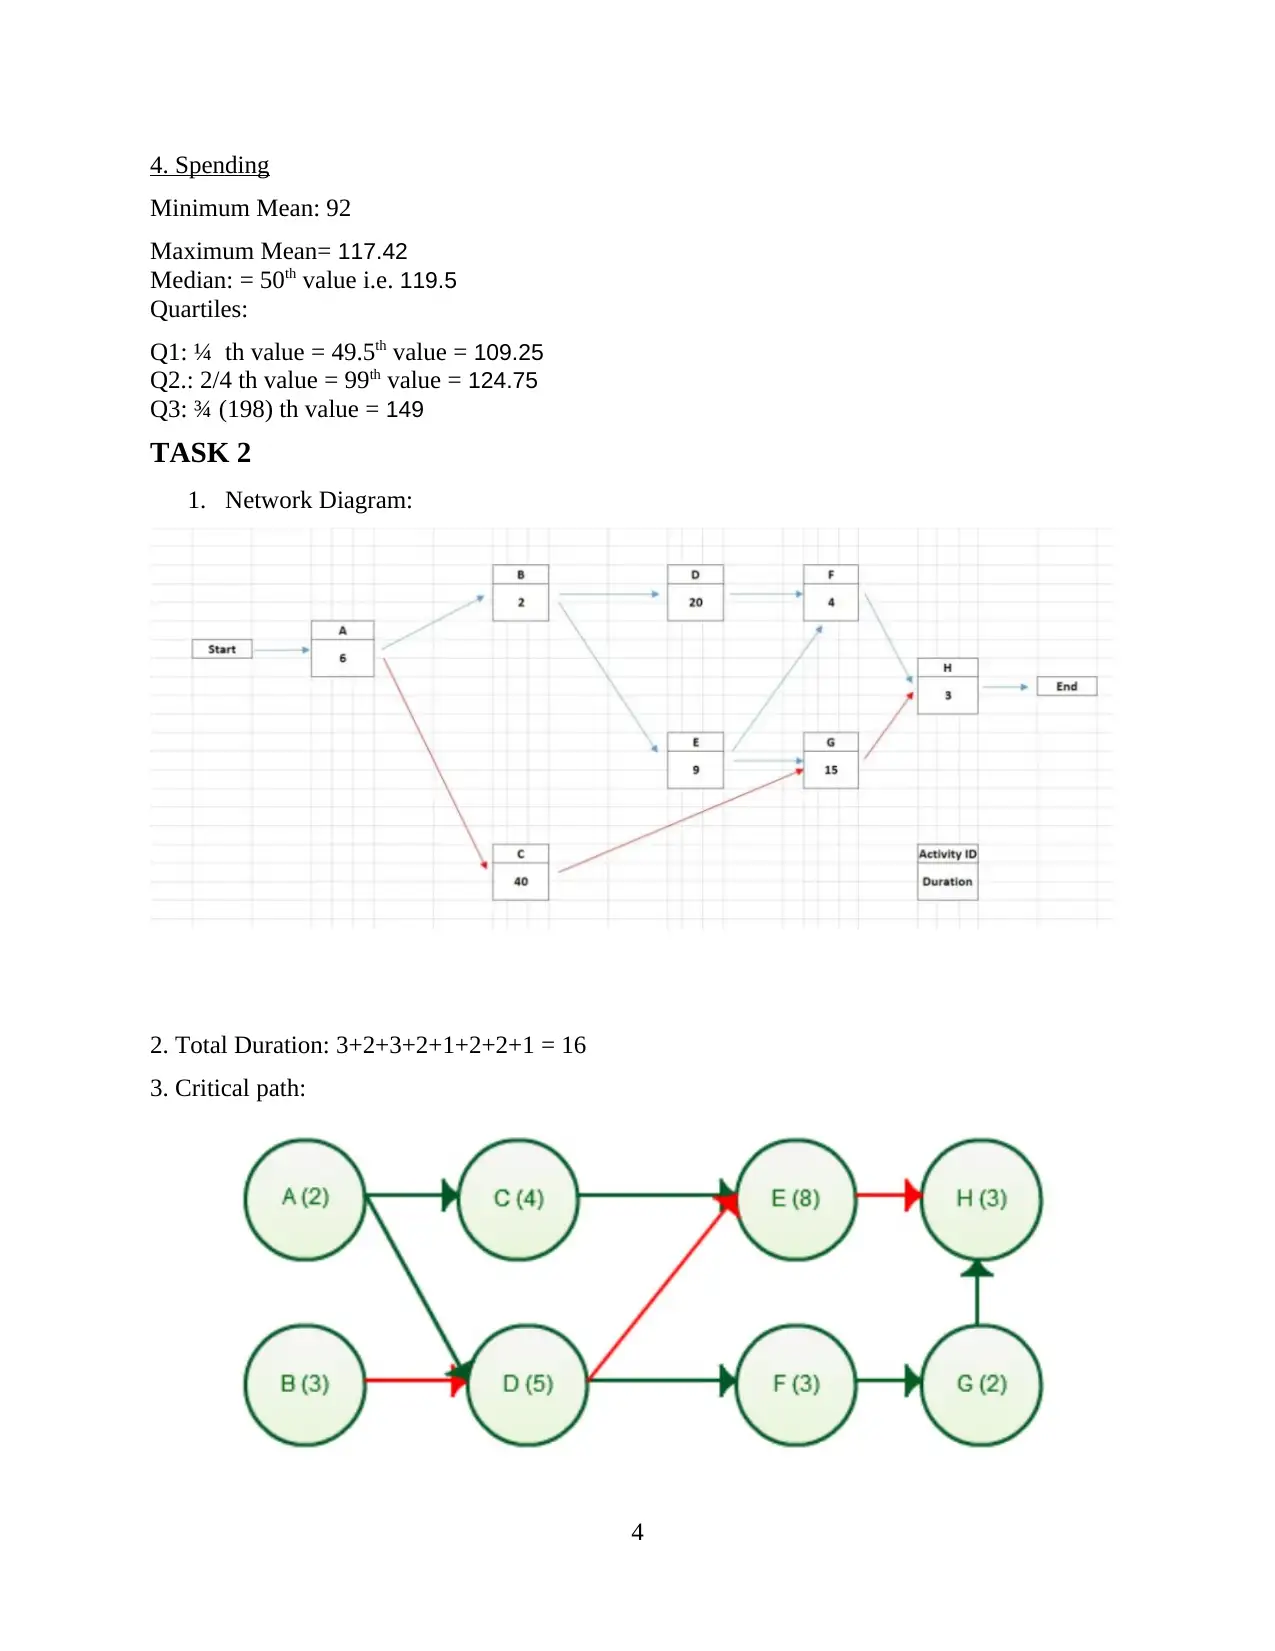
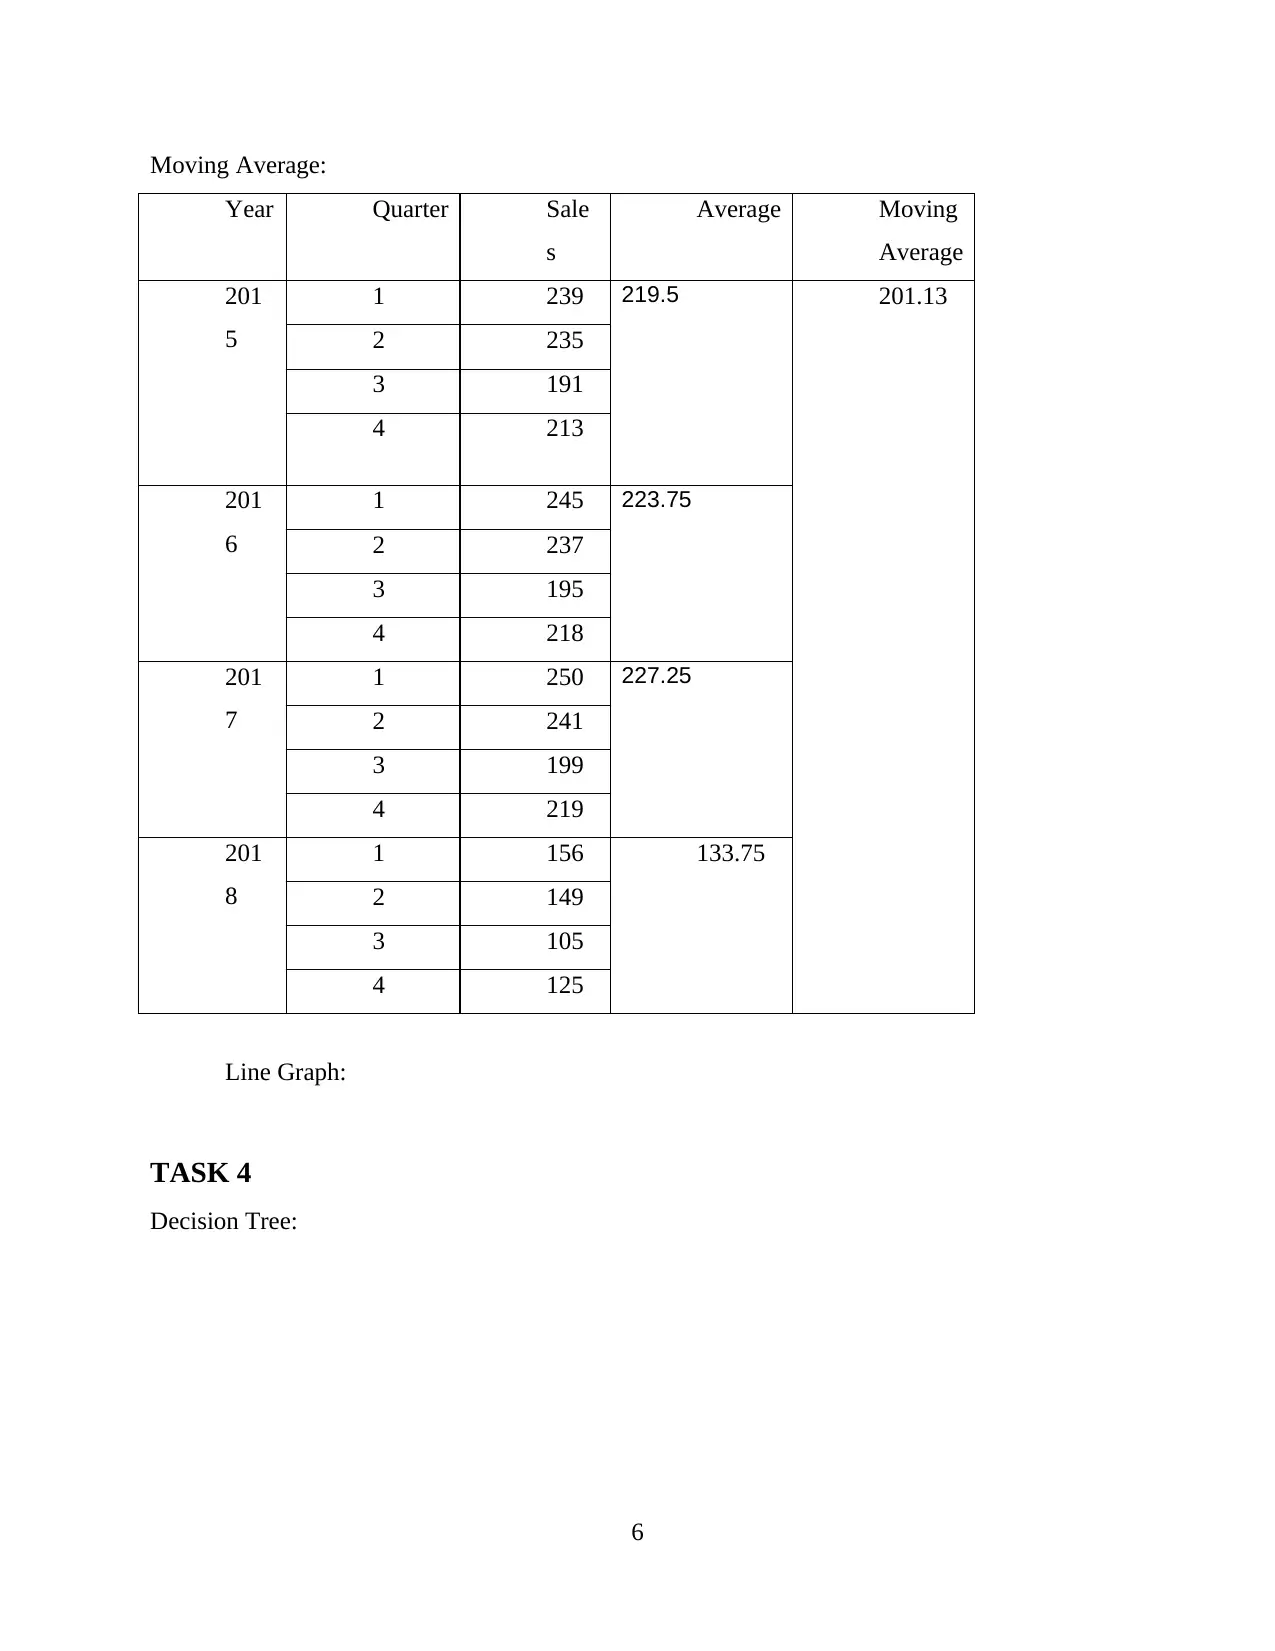
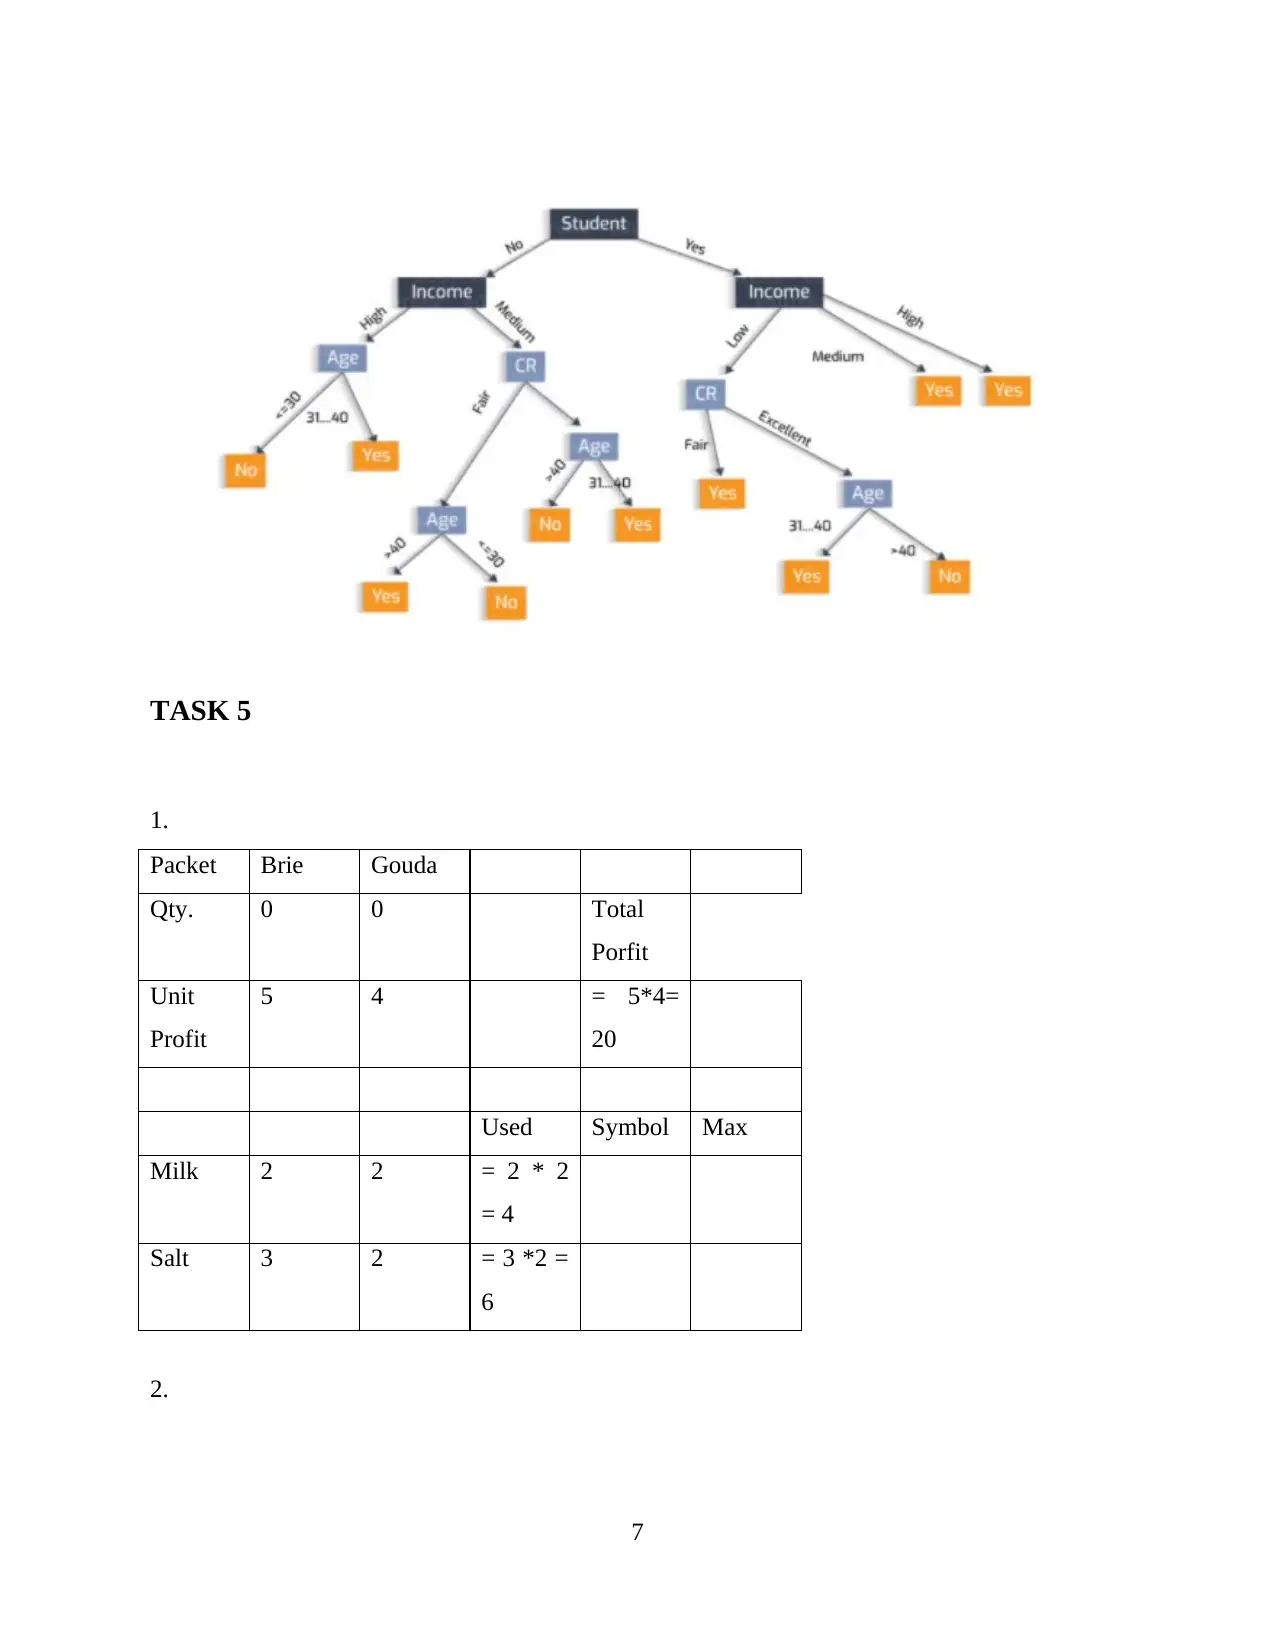
This assignment solution delves into various aspects of data analysis and management. Task 1 focuses on labeling data categories, creating frequency tables, and generating graphical representations to visualize the data. It also includes calculations related to spending patterns. Task 2 involves constructing a network diagram, determining the total duration, and identifying the critical path. Task 3 presents a line graph and calculates moving averages. Task 4 utilizes a decision tree for analysis. Finally, Task 5 explores profit calculations based on provided data. The solution covers a range of data analysis techniques, from basic descriptive statistics to more advanced visualization and network analysis methods.
tabler-icon-diamond-filled.svg

Contribute Materials

Your contribution can guide someone’s learning journey. Share your documents today.
Document Page
Using And
Managing Data
And Information
tabler-icon-diamond-filled.svg

Secure Best Marks with AI Grader

Need help grading? Try our AI Grader for instant feedback on your assignments.
Document Page
Table of Contents
INTRODUCTION...........................................................................................................................1
TASK 1...........................................................................................................................................1
1. Label the codes for categories:................................................................................................1
2. Frequ.and % Frequ.tables:.......................................................................................................1
3. Graphical representation:.........................................................................................................2
4. Spending..................................................................................................................................3
TASK 2............................................................................................................................................4
TASK 3............................................................................................................................................4
TASK 4............................................................................................................................................5
TASK 5............................................................................................................................................6
Document Page
Document Page
INTRODUCTION
TASK 1
1. Label the codes for categories:
Gender:
1. Male?
2. Female?
3. Prefer not to say
Age:
1. Less than 21
2. 2. 21 to 34
3. 3. 35 to 47
4. 4. 48 to 60
5. 5. 61 and over
Education:
1. GCSE or below
2. 2. A’ level or Diploma
3. 3. Degree or further
Are you a regular user of self-checkout user?:
1. Yes
2. No
2. Frequ.and % Frequ.tables:
Gender
Frequency %
Male 20 40.00%
Female 29 58.00%
Prefer not to
say
1 2.00%
Total 50 100%
Age Frequency %
1
tabler-icon-diamond-filled.svg

Secure Best Marks with AI Grader

Need help grading? Try our AI Grader for instant feedback on your assignments.
Document Page
Less than
21
4 8.00%
21 to 34 3 6.00%
35 to 47 6 12.00%
48 to 60 23 46.00%
61 and
over
14 28.00%
Total 50 100
Education Frequency %
GCSE or below 13 26.00%
A’ level or
Diploma
18 36.00%
Degree or further 19 38.00%
Total 50 100%
SSC
User
Frequency %
Yes 15 30.00%
No 35 70.00%
Total 50 100
Spendin
g
Frequency %
<100 5 10.00%
100-109 8 16.00%
110-119 12 24.00%
120-129 20 40.00%
130-140 4 8.00%
>140 1 2.0%
2
Document Page
Total 50 100
3. Graphical representation:
3
Document Page
4. Spending
Minimum Mean: 92
Maximum Mean= 117.42
Median: = 50th value i.e. 119.5
Quartiles:
Q1: ¼ th value = 49.5th value = 109.25
Q2.: 2/4 th value = 99th value = 124.75
Q3: ¾ (198) th value = 149
TASK 2
1. Network Diagram:
2. Total Duration: 3+2+3+2+1+2+2+1 = 16
3. Critical path:
4
tabler-icon-diamond-filled.svg

Paraphrase This Document

Need a fresh take? Get an instant paraphrase of this document with our AI Paraphraser
Document Page
TASK 3
1. Line Graph:
5
Document Page
Moving Average:
Year Quarter Sale
s
Average Moving
Average
201
5
1 239 219.5 201.13
2 235
3 191
4 213
201
6
1 245 223.75
2 237
3 195
4 218
201
7
1 250 227.25
2 241
3 199
4 219
201
8
1 156 133.75
2 149
3 105
4 125
Line Graph:
TASK 4
Decision Tree:
6
Document Page
TASK 5
1.
Packet Brie Gouda
Qty. 0 0 Total
Porfit
Unit
Profit
5 4 = 5*4=
20
Used Symbol Max
Milk 2 2 = 2 * 2
= 4
Salt 3 2 = 3 *2 =
6
2.
7
tabler-icon-diamond-filled.svg

Secure Best Marks with AI Grader

Need help grading? Try our AI Grader for instant feedback on your assignments.
Document Page
8
chevron_up_icon
1 out of 11
circle_padding
hide_on_mobile
zoom_out_icon
logo.png

Your All-in-One AI-Powered Toolkit for Academic Success.

Available 24*7 on WhatsApp / Email

[object Object]