BA3020QA - Data and Information Management Assignment Solution

Verified

Added on  2022/12/22

|15
|435
|56
Homework Assignment
AI Summary
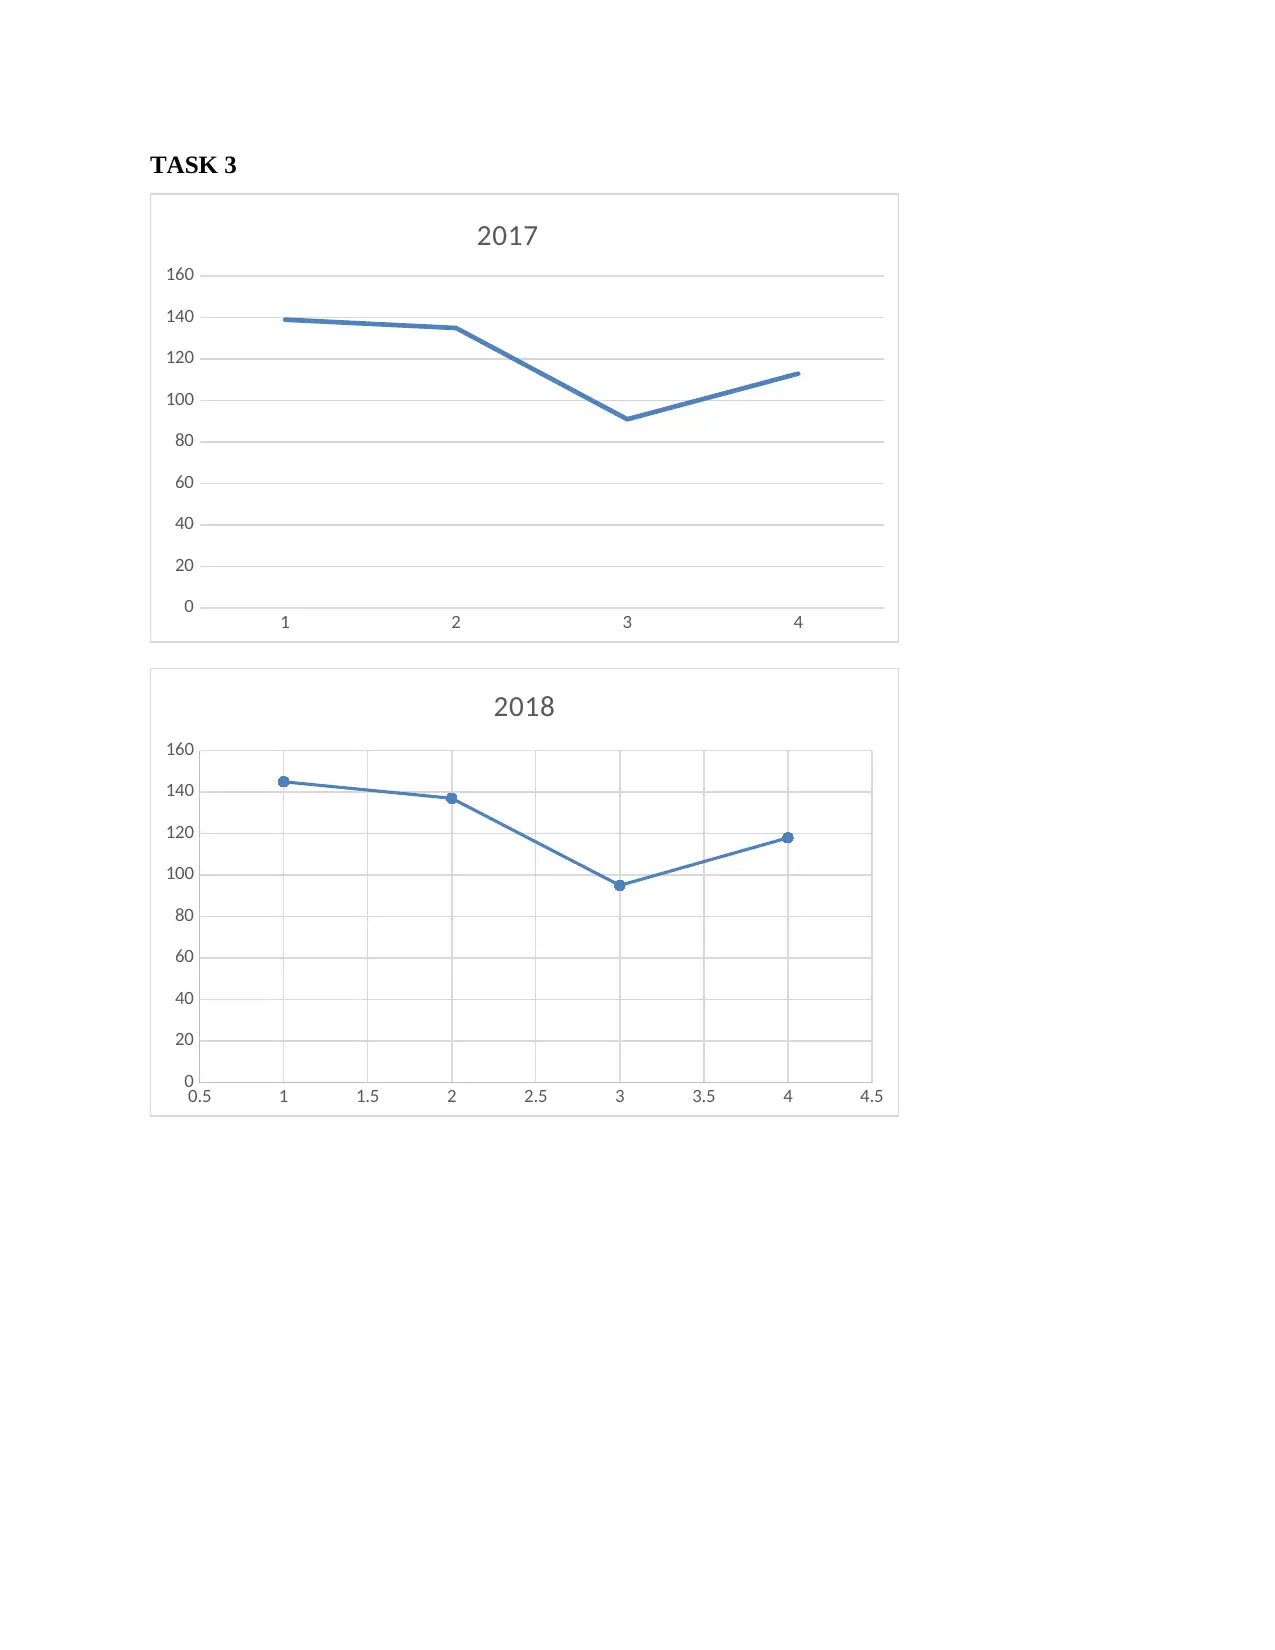
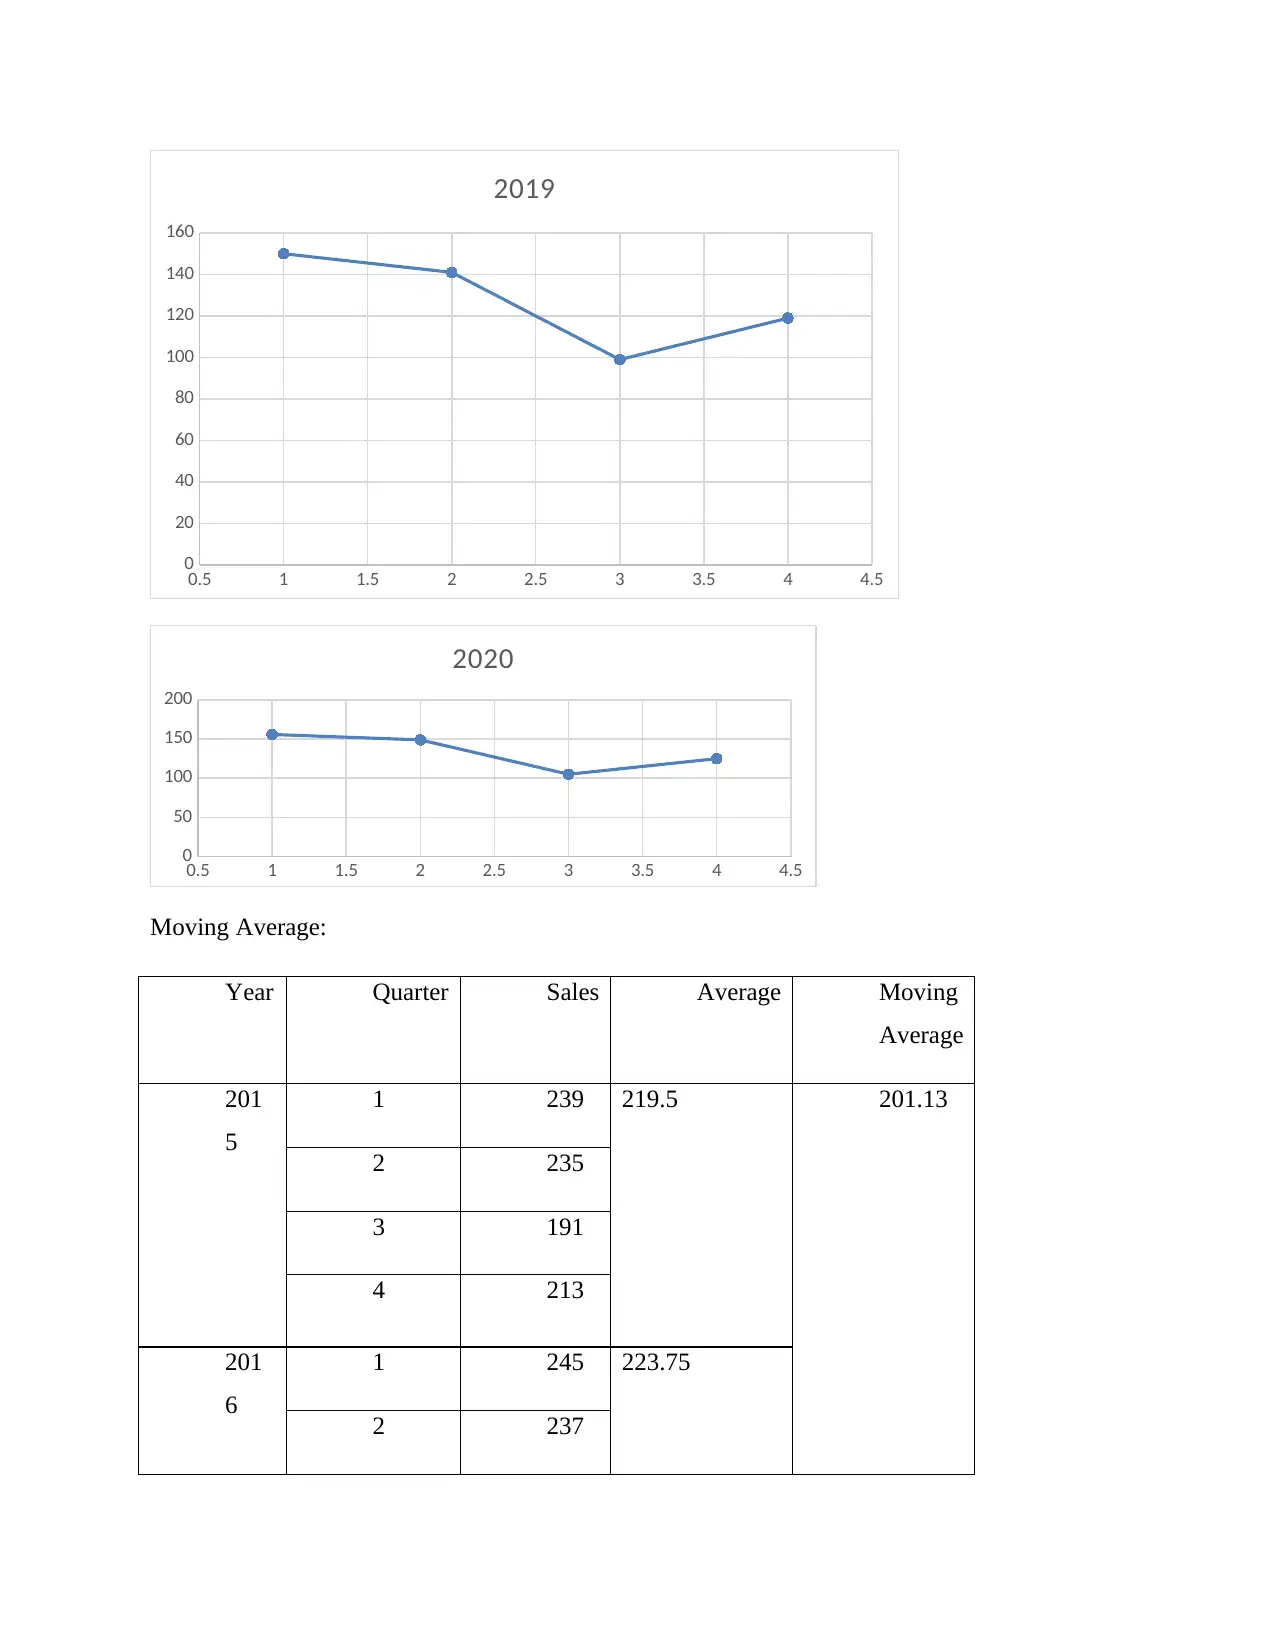
This document presents a comprehensive solution to a data and information management assignment (BA3020QA). The assignment includes five tasks: labeling codes for categories, creating frequency and percentage frequency tables, graphical representations, calculating a moving average, and constructing a decision tree. The solution covers data analysis, critical path analysis, and project management. Task 1 involves analyzing a supermarket survey on self-checkout usage, while Task 2 focuses on critical path analysis. Task 3 requires data visualization, and Task 4 involves creating a decision tree. Task 5 analyzes profit calculations. The solution provides detailed steps, calculations, and visual representations to address each task effectively. This solution is designed to help students understand and solve data management problems.
Document Page
tabler-icon-diamond-filled.svg

Paraphrase This Document

Need a fresh take? Get an instant paraphrase of this document with our AI Paraphraser
Document Page
Using and Managing Data and Information
Document Page
Contents
TASK 1..........................................................................................................................................................4
TASK 2........................................................................................................................................................10
TASK 3........................................................................................................................................................11
TASK 4........................................................................................................................................................13
TASK 5........................................................................................................................................................14
Document Page
TASK 1
1. Label the codes for categories:
Gender:
1. Male? 2. Female? 3. Prefer not to say
Age:
1. Less than 21 2. 21 to 34 3. 35 to 47 4. 48 to 60 5. 61 and over
Education:
1. GCSE or below 2. A’ level or Diploma 3. Degree or further
Are you a regular user of self-checkout user?
1. Yes 2. No
2. Frequency and percentage frequency tables:
tabler-icon-diamond-filled.svg

Paraphrase This Document

Need a fresh take? Get an instant paraphrase of this document with our AI Paraphraser
Document Page
Document Page
Document Page
3. Graphical representation:
Gender
Male Female Prefer not to say Total
tabler-icon-diamond-filled.svg

Paraphrase This Document

Need a fresh take? Get an instant paraphrase of this document with our AI Paraphraser
Document Page
Less than 21
21 to 34
35 to 47
48 to 60
61 and over
Total
0 20 40 60 80 100 120
Age
Document Page
4. Spending
Document Page
TASK 2
2. Total Duration: 3+2+3+2+1+2+2+1 = 16
3. Critical path:
tabler-icon-diamond-filled.svg

Paraphrase This Document

Need a fresh take? Get an instant paraphrase of this document with our AI Paraphraser
Document Page
TASK 3
1 2 3 4
0
20
40
60
80
100
120
140
160
2017
0.5 1 1.5 2 2.5 3 3.5 4 4.5
0
20
40
60
80
100
120
140
160
2018
Document Page
0.5 1 1.5 2 2.5 3 3.5 4 4.5
0
20
40
60
80
100
120
140
160
2019
0.5 1 1.5 2 2.5 3 3.5 4 4.5
0
50
100
150
200
2020
Moving Average:
Year Quarter Sales Average Moving
Average
201
5
1 239 219.5 201.13
2 235
3 191
4 213
201
6
1 245 223.75
2 237
chevron_up_icon
1 out of 15
circle_padding
hide_on_mobile
zoom_out_icon
[object Object]