Data and Information Management: Project and Analysis Report

Verified

Added on  2022/12/16

|15
|1388
|83
Homework Assignment
AI Summary
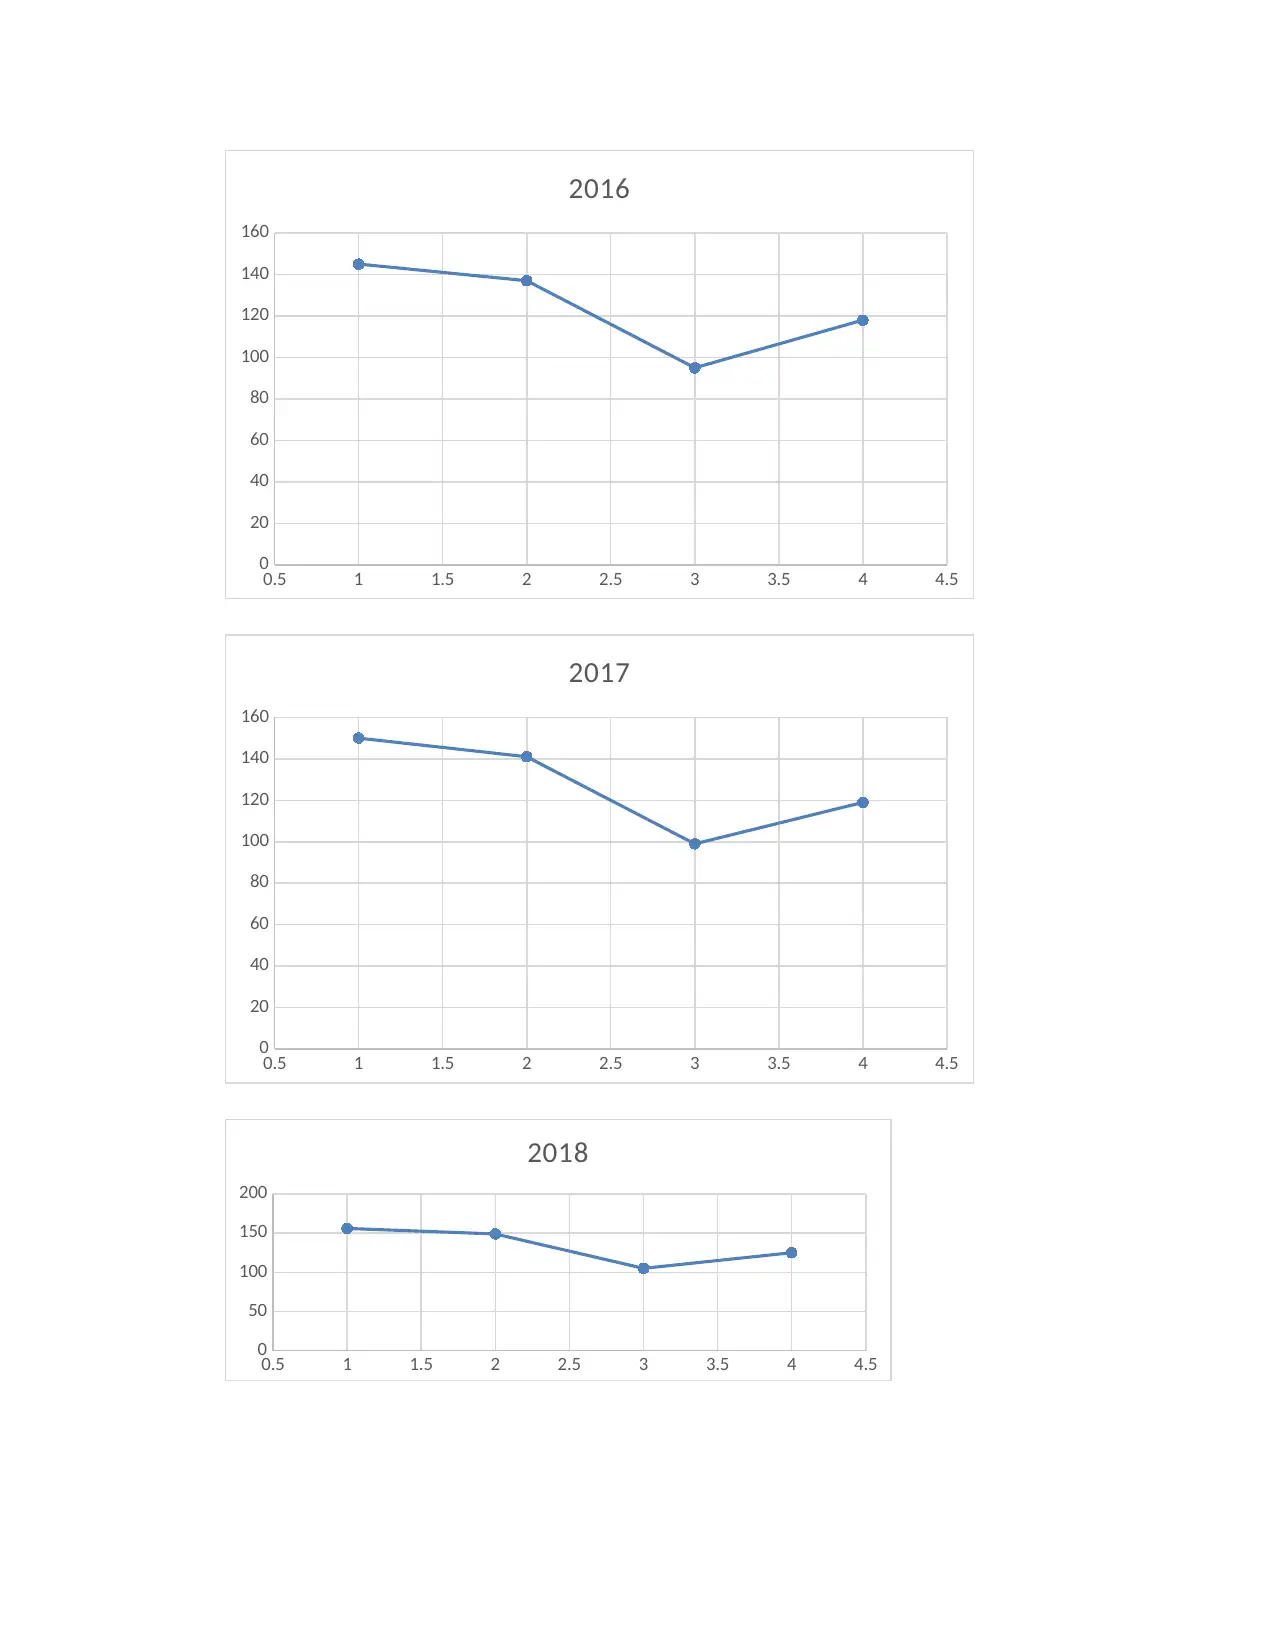
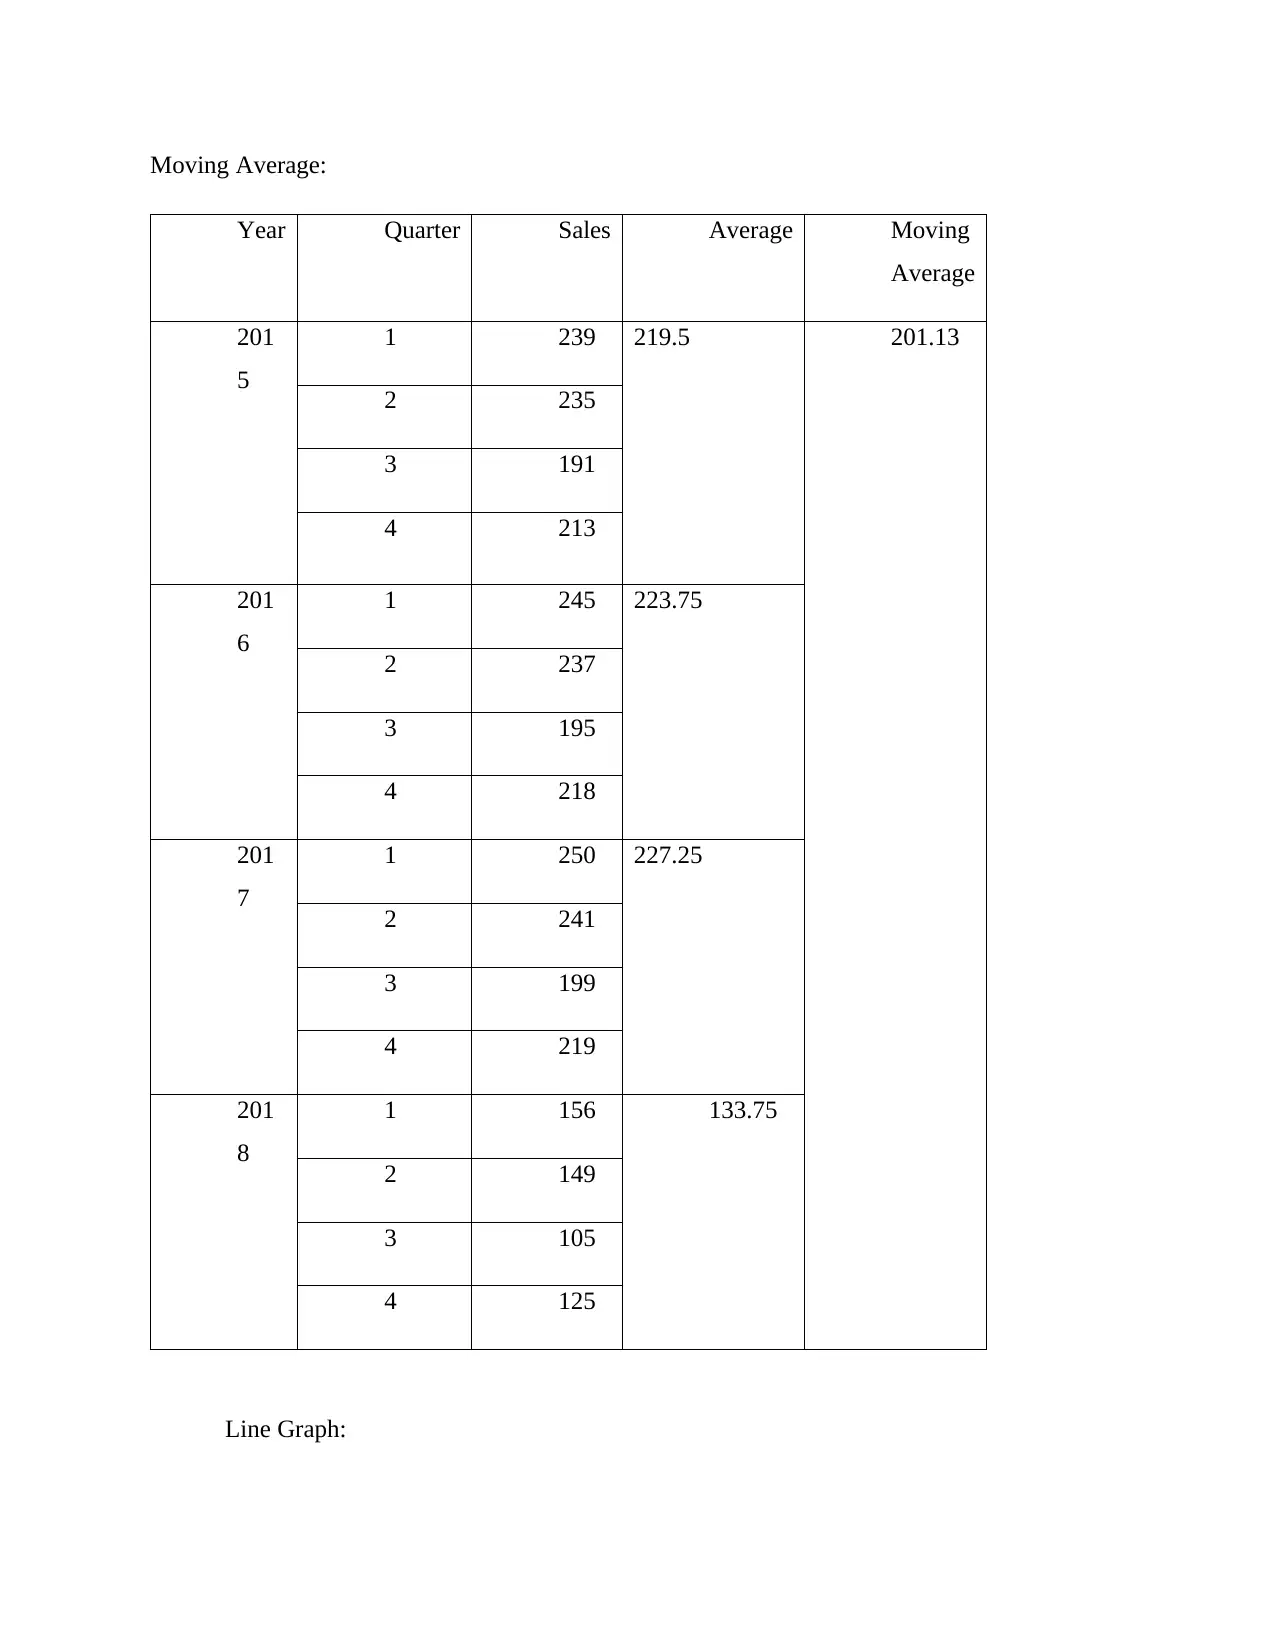
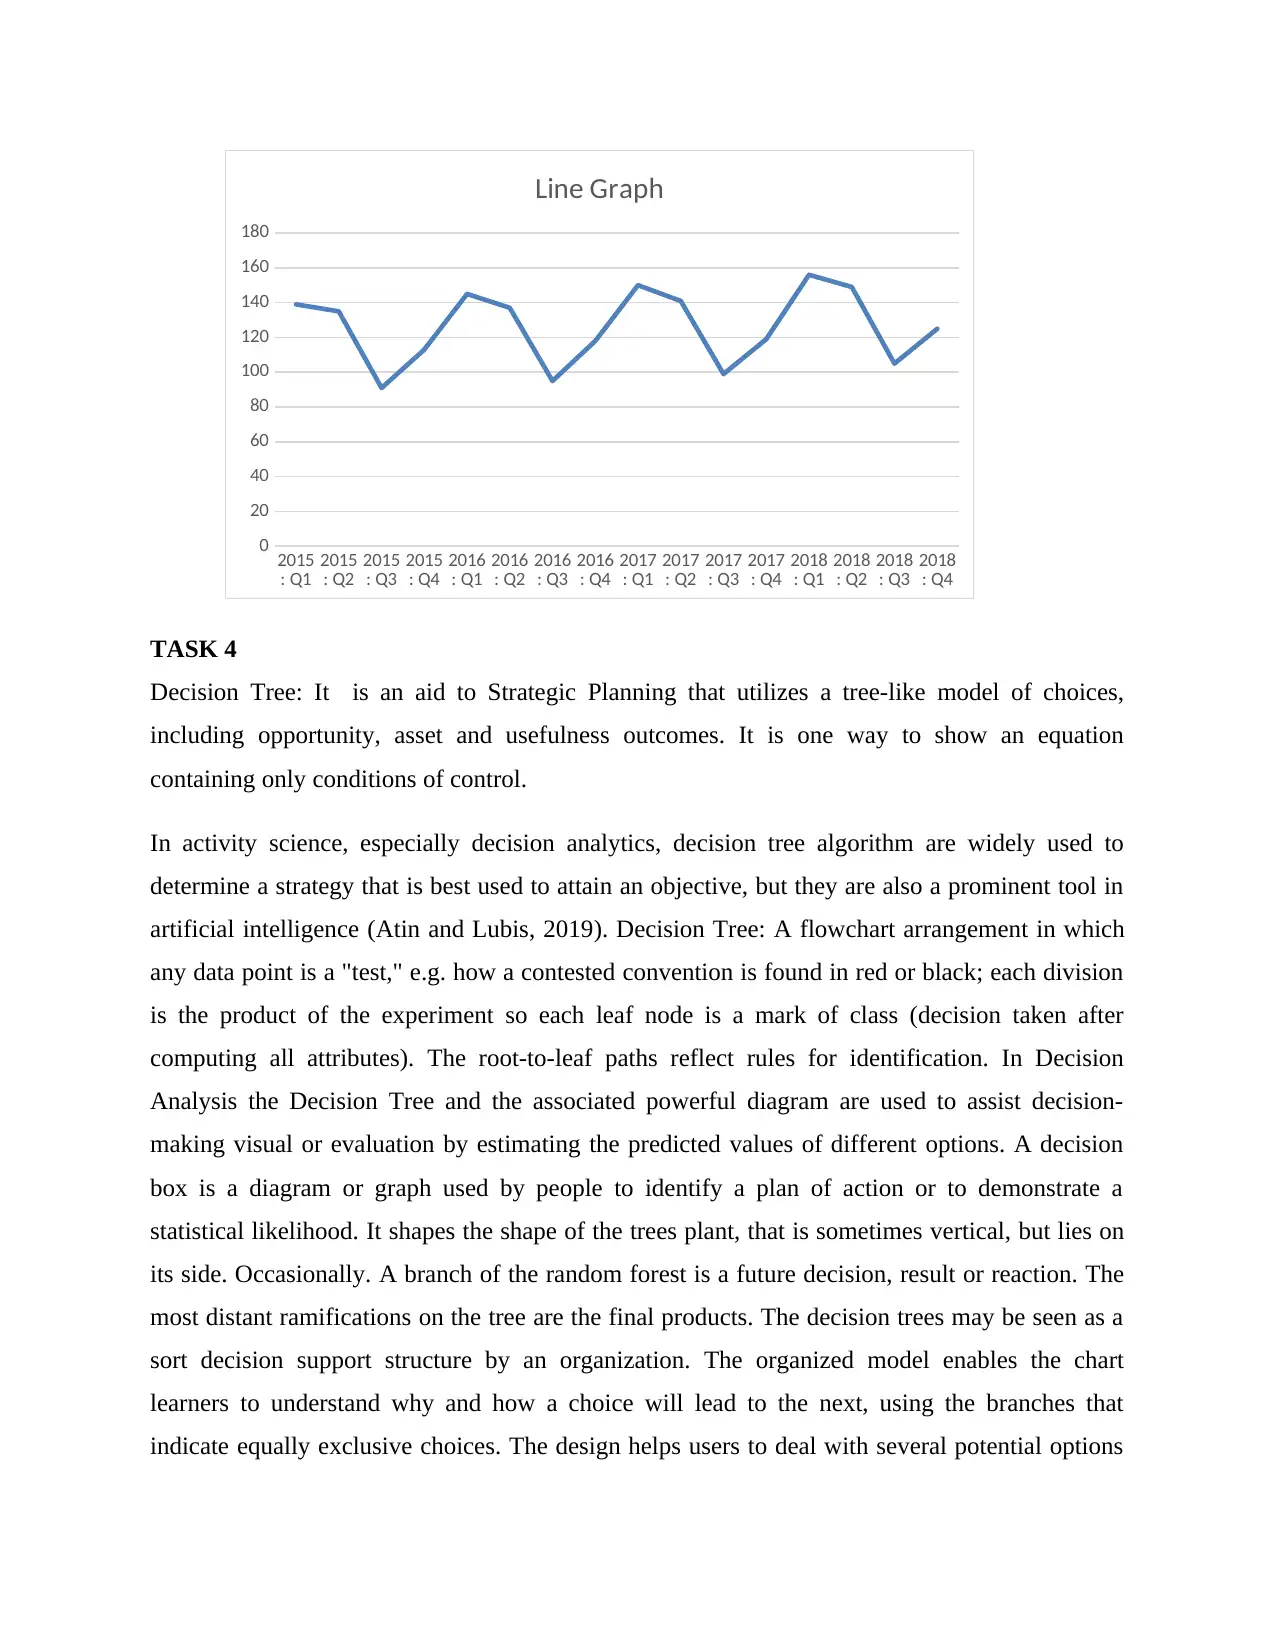
This document presents a comprehensive solution to a data and information management assignment. It begins with data labeling and frequency tables for categorical data, followed by graphical representations. Task 2 focuses on project management, including network diagrams, critical path analysis, and total duration calculations. Task 3 delves into data visualization using line graphs and moving averages. Task 4 introduces decision trees as a strategic planning tool. Finally, Task 5 concludes with a brief analysis and conclusion, supported by cited references. The assignment covers a range of data analysis and project management techniques, demonstrating practical application of these concepts.
Document Page
Using and Managing Data and Information
tabler-icon-diamond-filled.svg

Paraphrase This Document

Need a fresh take? Get an instant paraphrase of this document with our AI Paraphraser
Document Page
Contents
TASK 1..........................................................................................................................................................3
TASK 2..........................................................................................................................................................7
TASK 3..........................................................................................................................................................9
TASK 4........................................................................................................................................................13
TASK 5........................................................................................................................................................14
REFERENCES..............................................................................................................................................16
Document Page
TASK 1
1. Label the codes for categories:
ï‚· Gender:
1. Male? 2. Female? 3. Prefer not to say
ï‚· Age:
1. Less than 21 2. 21 to 34 3. 35 to 47 4. 48 to 60 5. 61 and over
ï‚· Education:
1. GCSE or below 2. A’ level or Diploma 3. Degree or further
ï‚· Are you a regular user of self-checkout user?
1. Yes 2. No
2. Frequency and percentage frequency tables:
Document Page
tabler-icon-diamond-filled.svg

Paraphrase This Document

Need a fresh take? Get an instant paraphrase of this document with our AI Paraphraser
Document Page
3. Graphical representation:
Gender
Male Female Prefer not to say Total
Document Page
Less than 21
21 to 34
35 to 47
48 to 60
61 and over
Total
0 20 40 60 80 100 120
Age
Document Page
4. Spending
TASK 2
1. Network Diagram: The sequential and logically linked functions in a project environment
are shown in a project network plan diagram. The representation is based on the simple
chronological description of activities and events (Zareei, 2018).
A project communication plan with a variety of columns and links is often seen as a map.
Used to diagram the timetable, mission statement and chart success for the project at each
point – up to and including implementation. As it covers the major activities to be done
tabler-icon-diamond-filled.svg

Paraphrase This Document

Need a fresh take? Get an instant paraphrase of this document with our AI Paraphraser
Document Page
over the course of the project, a graphical representation is often helpful to demonstrate
the complexity of the project.
A project manager can monitor any aspect of a project and communicate its status easily
with those with a project network. Such advantages include:
 Progress for investor’s graphic display
ï‚· Setting workflows for projects
ï‚· Connections and possible bottlenecks monitoring
2. Total Duration: 3+2+3+2+1+2+2+1 = 16
3. Critical path: An equation for the preparation of a series of project tasks lays in the critical
path. It is widely used along with the assessment and PERT. A CPM is calculated by determining
the longest area of dependent tasks and the time necessary for completing them from the
beginning to the end (Hu and Liu, 2018). Using this value, CPM measures the longer distance to
logical end stages or project ends of the scheduled operations and, at the outset and earliest, each
task will start and end before extending the project. This method decides which actions (i.e. the
longer route) are "important" and which have "absolute float". The series of project network
operations that amount to the longest total period, regardless of whether the longest duration has
floated, constitutes a key course in managing projects. This decides how quickly the job will be
completed.
Document Page
TASK 3
Line Graph: A line diagram is a particular diagram widely used in analytics. It is the change in
quantity in contrast with another quantity (Pankaj Kumar and Agarwal, 2020). For starters, the
price of different flavors, as can be seen with this chart, differs. This difference is normally
presented in the XY plane in two dimensions. If it can be represented using a direct line in a
graph, with two steps, certain charts are called linear graphs (linear diagrams). The line graph is
also often referred to as a linear graph. Here we explain the form of the line chart, the method of
drawing a line chart and detailed illustrations.
1 2 3 4
0
20
40
60
80
100
120
140
160
2015
Document Page
0.5 1 1.5 2 2.5 3 3.5 4 4.5
0
20
40
60
80
100
120
140
160
2016
0.5 1 1.5 2 2.5 3 3.5 4 4.5
0
20
40
60
80
100
120
140
160
2017
0.5 1 1.5 2 2.5 3 3.5 4 4.5
0
50
100
150
200
2018
tabler-icon-diamond-filled.svg

Paraphrase This Document

Need a fresh take? Get an instant paraphrase of this document with our AI Paraphraser
Document Page
Moving Average:
Year Quarter Sales Average Moving
Average
201
5
1 239 219.5 201.13
2 235
3 191
4 213
201
6
1 245 223.75
2 237
3 195
4 218
201
7
1 250 227.25
2 241
3 199
4 219
201
8
1 156 133.75
2 149
3 105
4 125
Line Graph:
Document Page
2015
: Q1
2015
: Q2
2015
: Q3
2015
: Q4
2016
: Q1
2016
: Q2
2016
: Q3
2016
: Q4
2017
: Q1
2017
: Q2
2017
: Q3
2017
: Q4
2018
: Q1
2018
: Q2
2018
: Q3
2018
: Q4
0
20
40
60
80
100
120
140
160
180
Line Graph
TASK 4
Decision Tree: It is an aid to Strategic Planning that utilizes a tree-like model of choices,
including opportunity, asset and usefulness outcomes. It is one way to show an equation
containing only conditions of control.
In activity science, especially decision analytics, decision tree algorithm are widely used to
determine a strategy that is best used to attain an objective, but they are also a prominent tool in
artificial intelligence (Atin and Lubis, 2019). Decision Tree: A flowchart arrangement in which
any data point is a "test," e.g. how a contested convention is found in red or black; each division
is the product of the experiment so each leaf node is a mark of class (decision taken after
computing all attributes). The root-to-leaf paths reflect rules for identification. In Decision
Analysis the Decision Tree and the associated powerful diagram are used to assist decision-
making visual or evaluation by estimating the predicted values of different options. A decision
box is a diagram or graph used by people to identify a plan of action or to demonstrate a
statistical likelihood. It shapes the shape of the trees plant, that is sometimes vertical, but lies on
its side. Occasionally. A branch of the random forest is a future decision, result or reaction. The
most distant ramifications on the tree are the final products. The decision trees may be seen as a
sort decision support structure by an organization. The organized model enables the chart
learners to understand why and how a choice will lead to the next, using the branches that
indicate equally exclusive choices. The design helps users to deal with several potential options
chevron_up_icon
1 out of 15
circle_padding
hide_on_mobile
zoom_out_icon
[object Object]