Data and Information Management: Detailed Analysis and Application

Verified

Added on  2023/06/18

|12
|847
|475
Homework Assignment
AI Summary
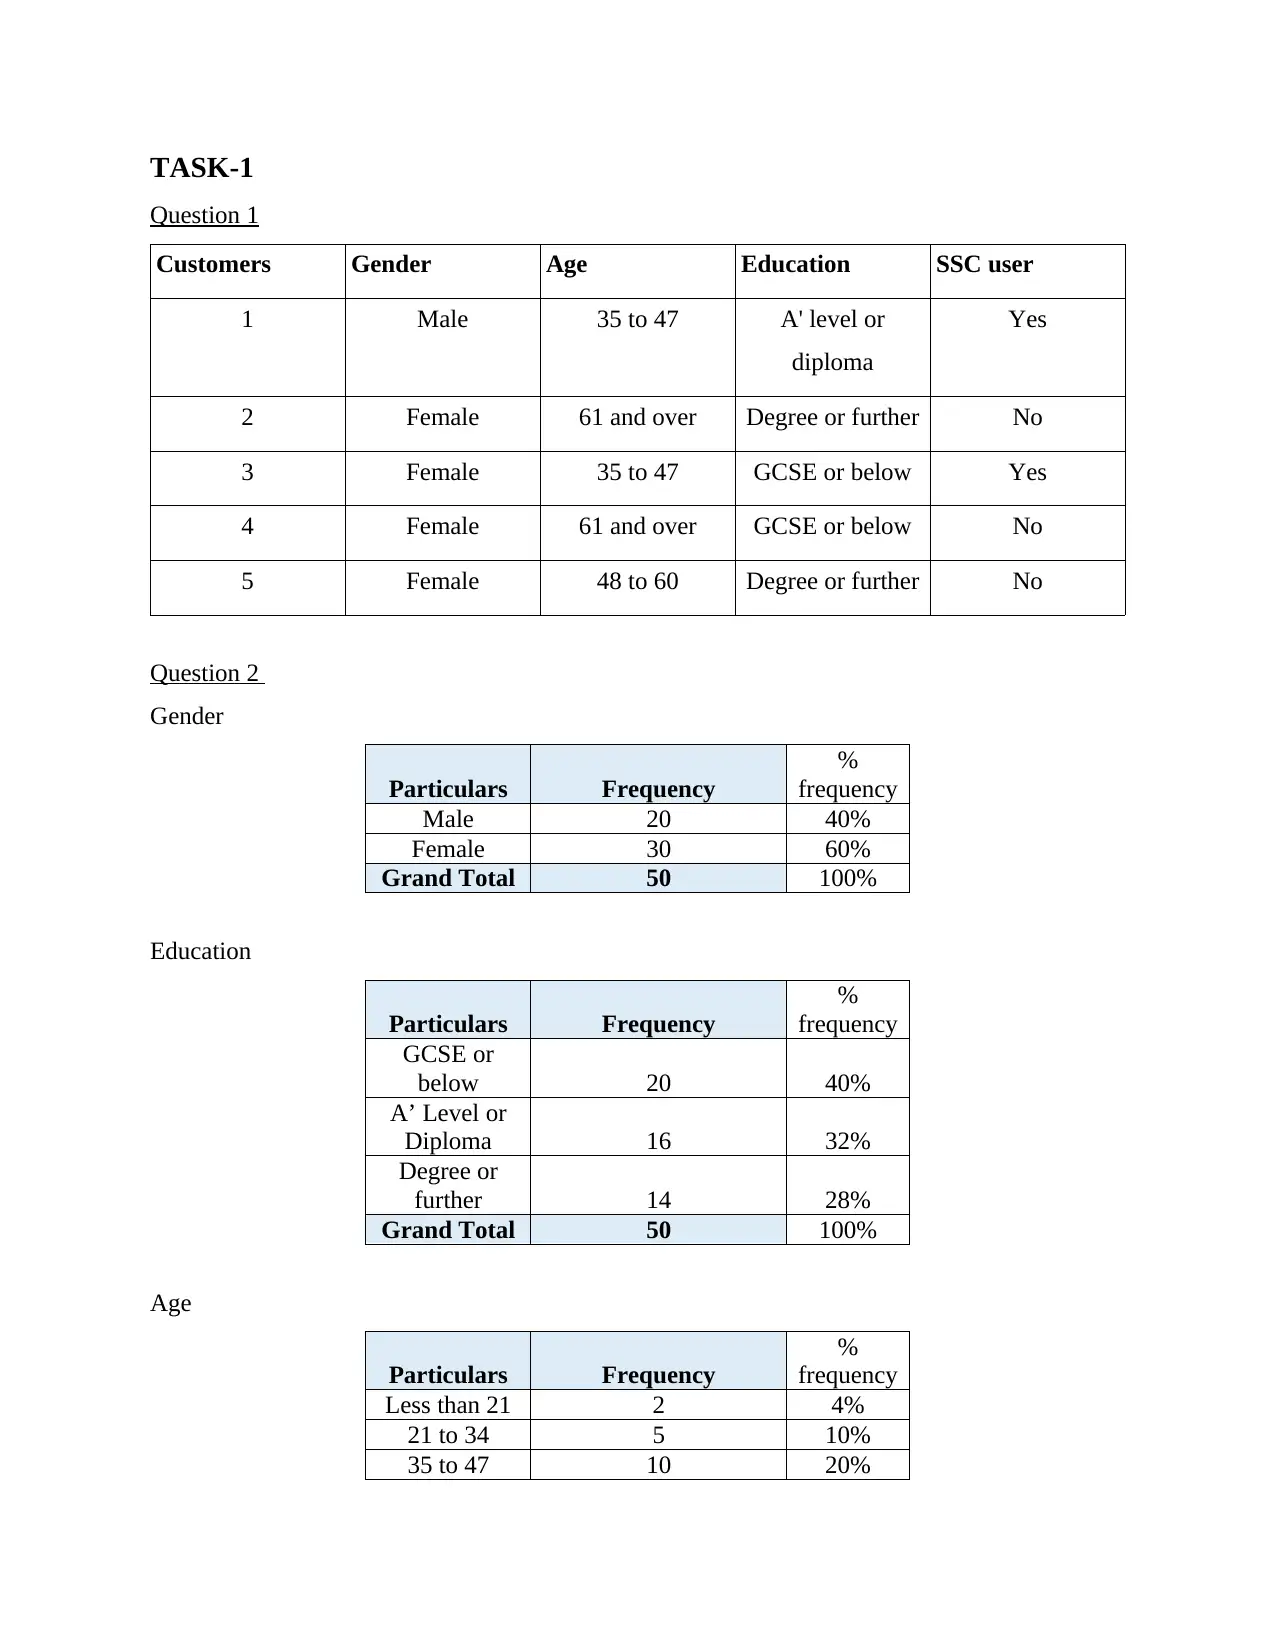
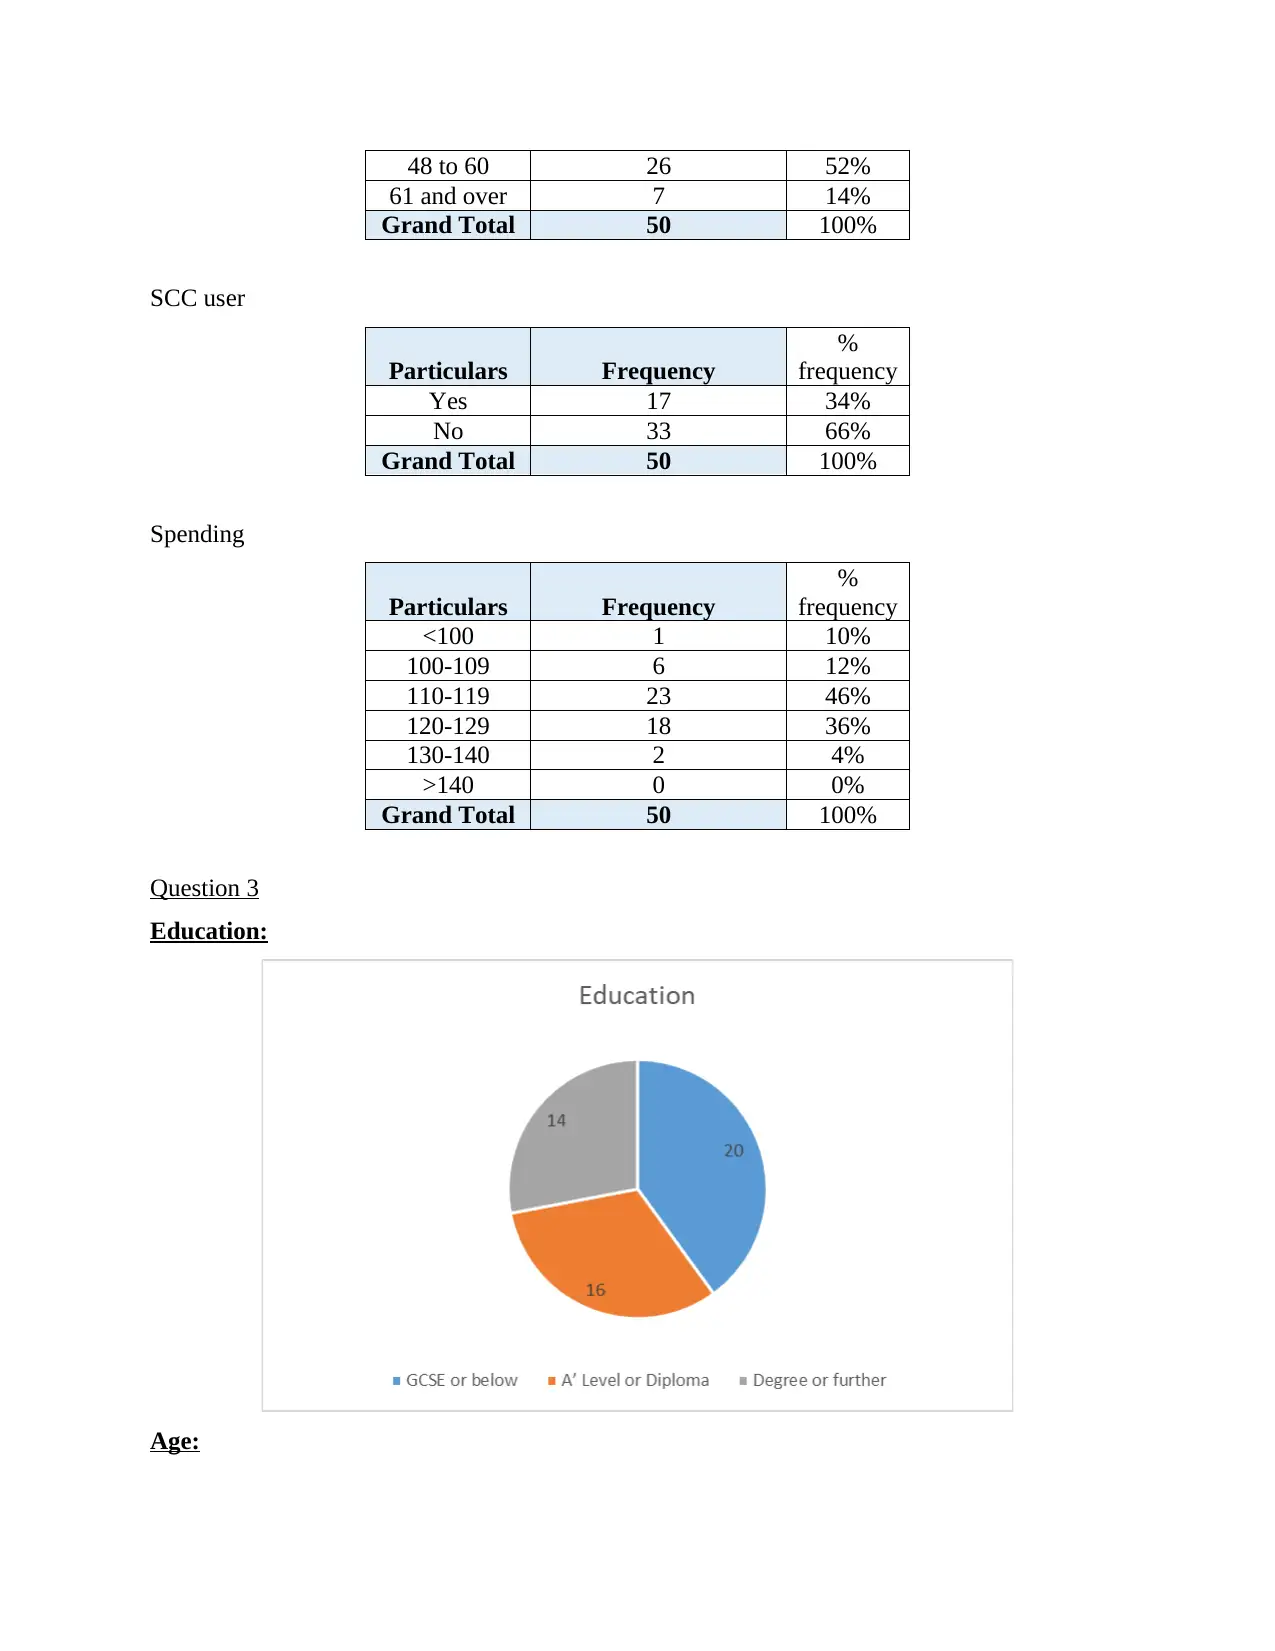
This assignment solution covers various aspects of using and managing data and information. It includes tasks such as analyzing customer data based on gender, age, education, and spending habits, calculating frequency distributions, and determining mean, median, and quartiles for spending. The solution also addresses critical path analysis, moving average calculations for sales data, and probability calculations for salesperson selection. Additionally, it includes a task on optimizing production quantities using solver options, demonstrating a comprehensive understanding of data analysis and information management principles. Desklib provides students with access to this and other solved assignments and past papers to support their studies.
Document Page
USING AND MANAGING
DATA AND INFORMATION
tabler-icon-diamond-filled.svg

Secure Best Marks with AI Grader

Need help grading? Try our AI Grader for instant feedback on your assignments.
Document Page
Table of Contents
TASK-1............................................................................................................................................3
Question 1....................................................................................................................................3
Question 2....................................................................................................................................3
Question 3....................................................................................................................................4
Question 4....................................................................................................................................5
TASK-2............................................................................................................................................6
Question 1....................................................................................................................................6
Question 2....................................................................................................................................6
Question 3....................................................................................................................................6
TASK-3............................................................................................................................................7
Question 1....................................................................................................................................7
Question 2....................................................................................................................................7
Question 3....................................................................................................................................8
Question 4....................................................................................................................................8
TASK-4............................................................................................................................................9
TASK-5..........................................................................................................................................10
Document Page
TASK-1
Question 1
Customers Gender Age Education SSC user
1 Male 35 to 47 A' level or
diploma
Yes
2 Female 61 and over Degree or further No
3 Female 35 to 47 GCSE or below Yes
4 Female 61 and over GCSE or below No
5 Female 48 to 60 Degree or further No
Question 2
Gender
Particulars Frequency
%
frequency
Male 20 40%
Female 30 60%
Grand Total 50 100%
Education
Particulars Frequency
%
frequency
GCSE or
below 20 40%
A’ Level or
Diploma 16 32%
Degree or
further 14 28%
Grand Total 50 100%
Age
Particulars Frequency
%
frequency
Less than 21 2 4%
21 to 34 5 10%
35 to 47 10 20%
Document Page
48 to 60 26 52%
61 and over 7 14%
Grand Total 50 100%
SCC user
Particulars Frequency
%
frequency
Yes 17 34%
No 33 66%
Grand Total 50 100%
Spending
Particulars Frequency
%
frequency
<100 1 10%
100-109 6 12%
110-119 23 46%
120-129 18 36%
130-140 2 4%
>140 0 0%
Grand Total 50 100%
Question 3
Education:
Age:
tabler-icon-diamond-filled.svg

Secure Best Marks with AI Grader

Need help grading? Try our AI Grader for instant feedback on your assignments.
Document Page
Spending:
Question 4
Particulars Spending (£)
Mean 117.5
Median 118.5
Minimum 92
Maximum 131
Document Page
Quartile 1 112
Quartile 2 118.5
Quartile 3 122.25
TASK-2
Question 1
Question 2
By taking forward path the time required would be 5 days in case of path BE, while it would be 9
days in case of ACE path.
Question 3
Under backward move critical path would be 2-5 means BE. While non critical path would be 1-
3-5 which means A,C,E.
Document Page
TASK-3
Question 1
Question 2
Moving average
Year Quarter Sales
Moving
average
2017 1 139
2 135
3 91 121.6666667
4 113 113
2018 1 145 116.3333333
2 137 131.6666667
3 85 122.3333333
4 118 113.3333333
2019 1 150 117.6666667
2 141 136.3333333
3 89 126.6666667
4 119 116.3333333
2020 1 156 121.3333333
2 149 141.3333333
3 105 136.6666667
4 125 126.3333333
tabler-icon-diamond-filled.svg

Paraphrase This Document

Need a fresh take? Get an instant paraphrase of this document with our AI Paraphraser
Document Page
Question 3
Quarter Centre
moving
2017
1
2 118.5
3 110
4 127
2018
1 128
2 119.25
3 109.5
4 131.75
2019
1 132.5
2 122.5
3 113.25
4 135.75
2020
1 141.5
2 132
3 83.75
4 62.5
Question 4
Document Page
TASK-4
Let us assume that X = Toni
And Y = Joe
The probability of Toni to be chosen as salesperson = P(X) = 0.5
The probability of Joe to be chosen as salesperson = P(X) = 0.4
P (Salesperson chosen by both) = P (X and Y) = 0 (Because only one manager will work
in a day)
P (X OR Y) = P (X) + P (Y) – P (X and Y)
= 0.5 + 0.4 – 0 = 0.8
Hence, it can be analysed that the probability of salesperson selected by either manager Toni
and Joe would be 0.8
Sales person
Tony Joy
P(S) P(NS) P(S) P(NS)
0.6*
0.5
days
=0.3
0.5*
0.6
days
= 0.3
0.4*
0.4
days
=
0.16
0.4*
0.6
days
=
0.24
0.55 0.5 0.4 0.6
Document Page
0.3 + 0.24 = 0.54, this means that probability of not selecting the employee is 54%
0.3 + 0.16 = 0.46, this means that probability of selecting the employee is 46%
0.3 + 0.3 + 0.16 + 0.24 = 1
TASK-5
Decision
variables
Objective
functions
LHS
constrains
Brie Goude
Total
Profit
Production
quantity 12 0
Unit profits 4.5 3 54
Constraints
Production
Requirements/
Unit Used Available
Milk 1.8 1.2 21.6 120
Salt 100 150 1200 1200
Solver
Options
Max Time Unlimited, Iterations Unlimited, Precision
0.000001
Max Subproblems Unlimited, Max Integer Sols Unlimited, Integer Tolerance 1%,
Assume NonNegative
Objective Cell (Max)
Cell Name
Original
Value
Final
Value
$E$
4
Unit profits Total
Profit 54 54
Variable Cells
tabler-icon-diamond-filled.svg

Secure Best Marks with AI Grader

Need help grading? Try our AI Grader for instant feedback on your assignments.
Document Page
Cell Name
Original
Value
Final
Value Integer
$C$3 Production quantity Brie 12 12 Contin
$D$3
Production quantity
Goude 0 0 Contin
Constraints
Cell Name
Cell
Value Formula Status Slack
$E$7
Milk
Used 21.6 $E$7<=$F$7
Not
Binding 98.4
$E$8
Salt
Used 1200 $E$8<=$F$8 Binding 0
Document Page
1
chevron_up_icon
1 out of 12
circle_padding
hide_on_mobile
zoom_out_icon
logo.png

Your All-in-One AI-Powered Toolkit for Academic Success.

Available 24*7 on WhatsApp / Email

[object Object]