Data Insights for Business: Research, Analysis, and Applications

Verified

Added on  2022/11/29

|11
|1136
|86
Report
AI Summary
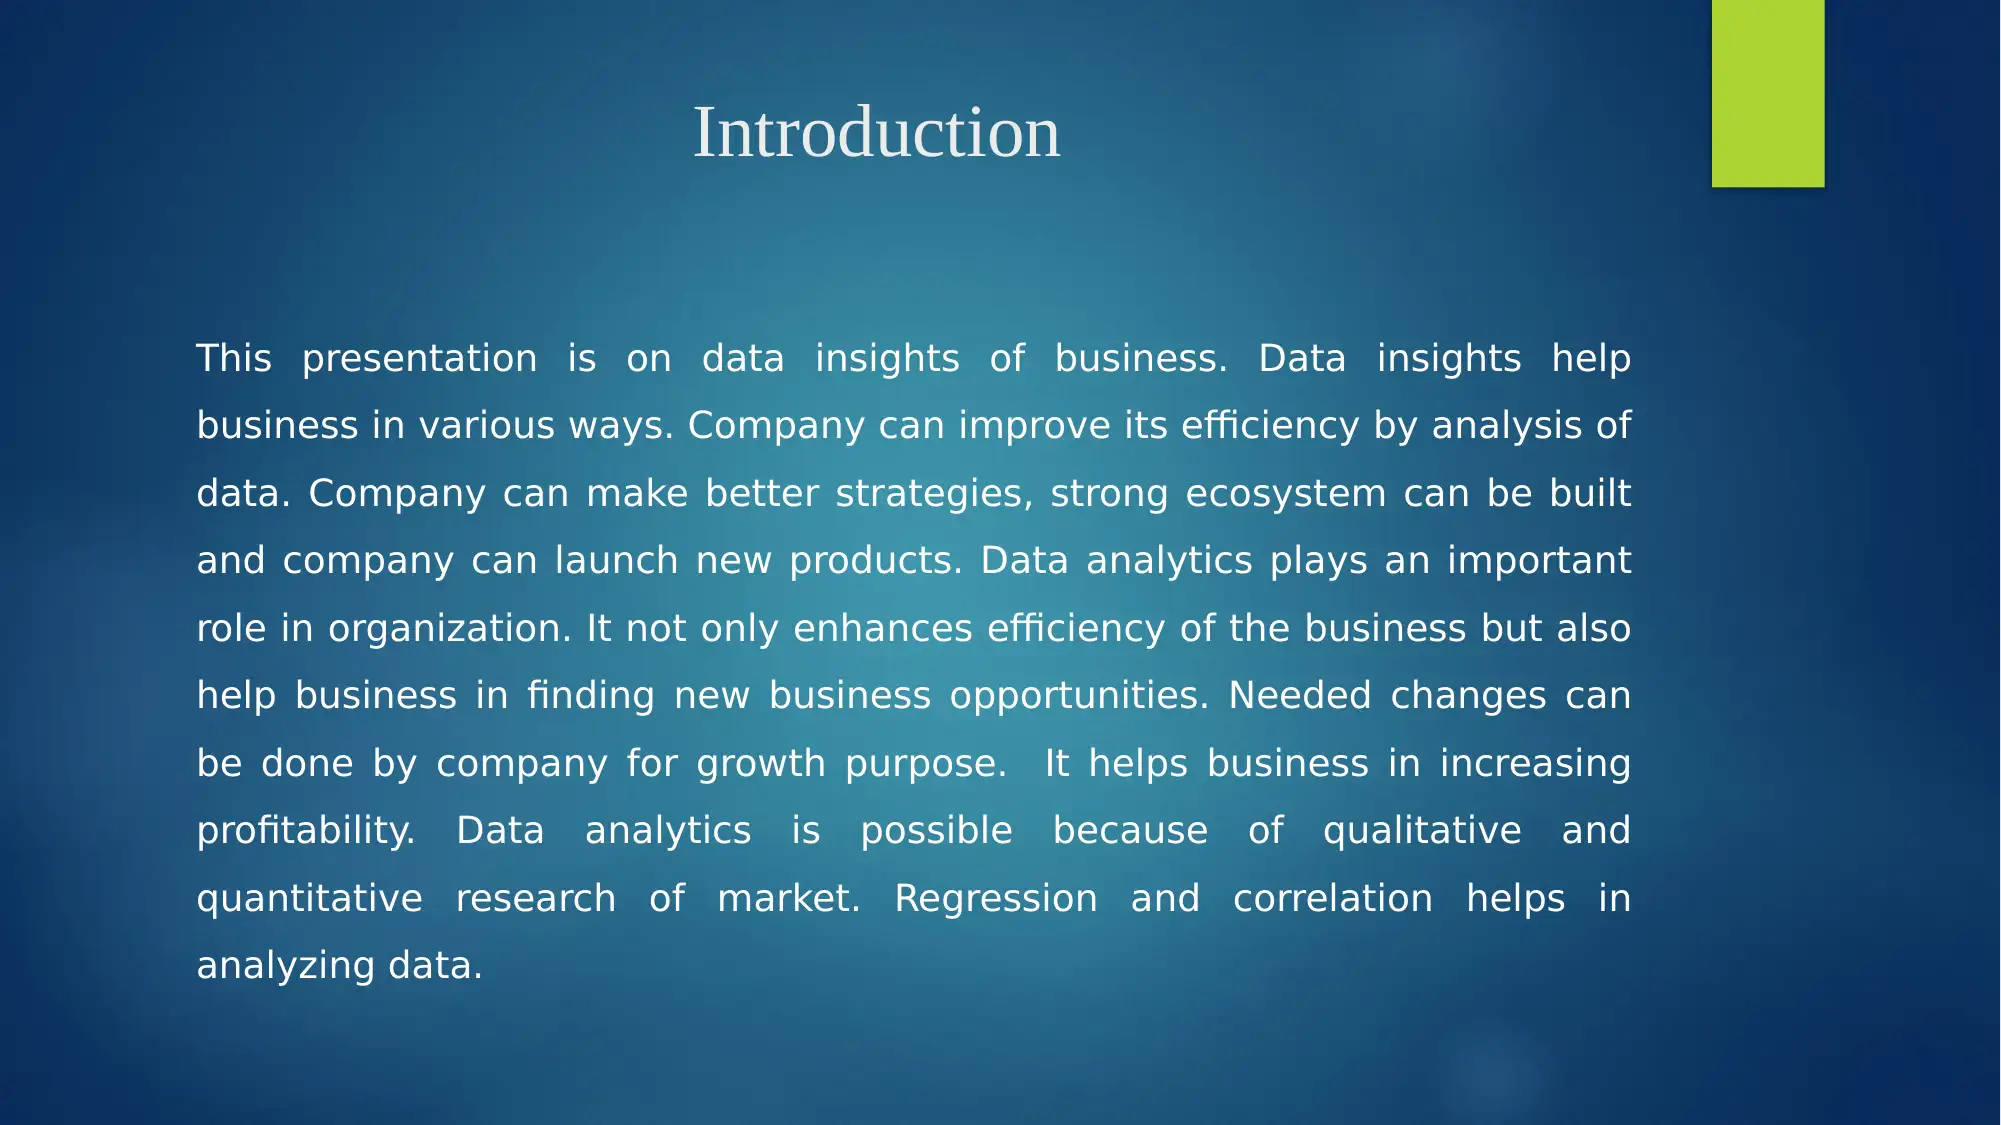
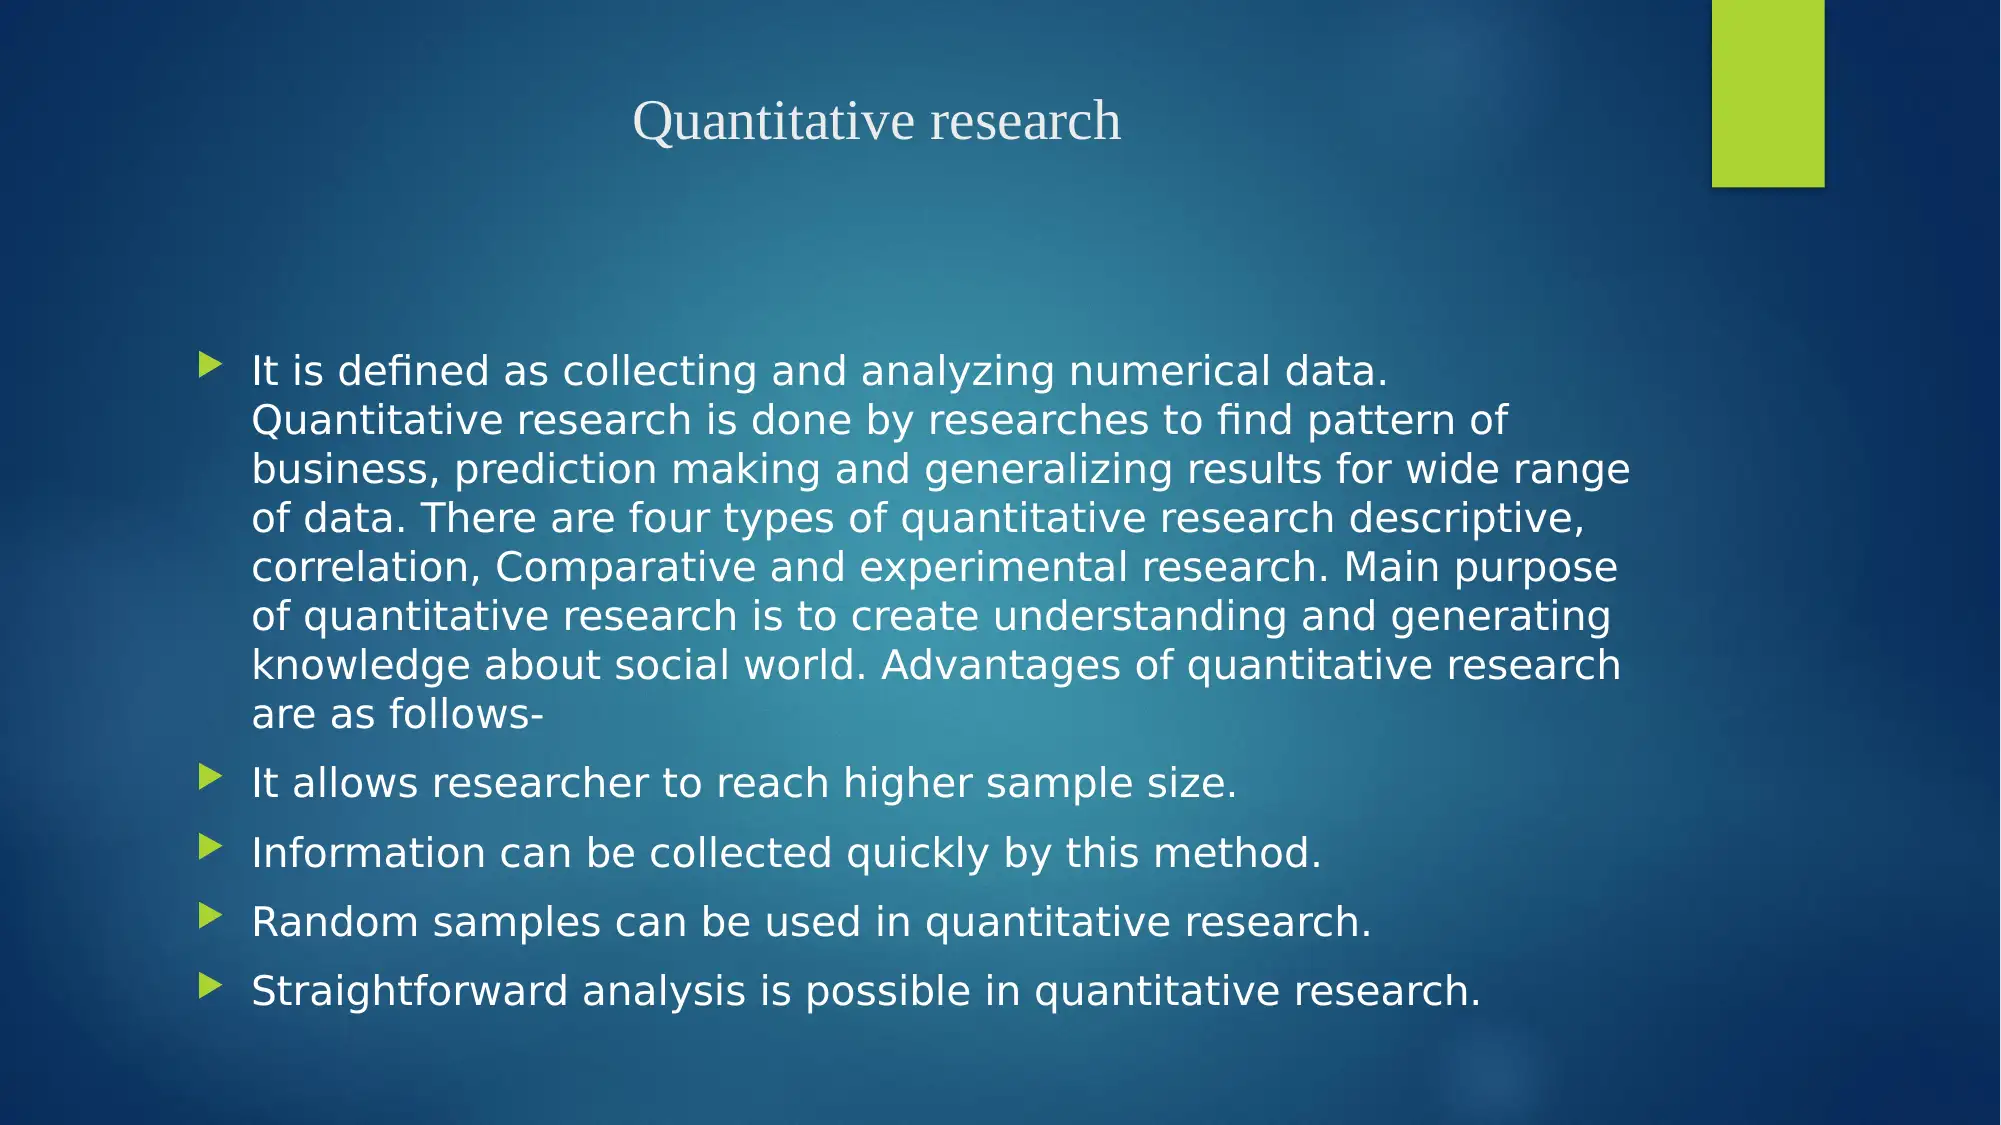
This report provides a comprehensive overview of data insights for business, exploring the significance of data analytics in enhancing efficiency, formulating strategies, and identifying new opportunities. It delves into qualitative and quantitative research methodologies, detailing their advantages and applications. The report examines correlation and regression techniques for understanding variable relationships, along with time series analysis for tracking trends and forecasting. It addresses the challenges of data handling, emphasizing the importance of managing large datasets and addressing issues related to data dimensions, computation costs, and heterogeneity. The conclusion underscores the importance of data analysis in business decision-making, highlighting the application of various techniques such as correlation, regression, and time series models, as well as the use of software like SPSS for data analysis. The report emphasizes the role of data analysis in driving informed decisions and enhancing business performance, including forecasting sales, profit, and turnover.
Document Page
Data insights for
business
tabler-icon-diamond-filled.svg

Secure Best Marks with AI Grader

Need help grading? Try our AI Grader for instant feedback on your assignments.
Document Page
Page of Contents
Introduction
Qualitative research
Quantitative research
Correlation and regression
Time series
Data handling
Conclusion
References
Document Page
Introduction
This presentation is on data insights of business. Data insights help
business in various ways. Company can improve its efficiency by analysis of
data. Company can make better strategies, strong ecosystem can be built
and company can launch new products. Data analytics plays an important
role in organization. It not only enhances efficiency of the business but also
help business in finding new business opportunities. Needed changes can
be done by company for growth purpose. It helps business in increasing
profitability. Data analytics is possible because of qualitative and
quantitative research of market. Regression and correlation helps in
analyzing data.
Document Page
Quantitative research
It is defined as collecting and analyzing numerical data.
Quantitative research is done by researches to find pattern of
business, prediction making and generalizing results for wide range
of data. There are four types of quantitative research descriptive,
correlation, Comparative and experimental research. Main purpose
of quantitative research is to create understanding and generating
knowledge about social world. Advantages of quantitative research
are as follows-
It allows researcher to reach higher sample size.
Information can be collected quickly by this method.
Random samples can be used in quantitative research.
Straightforward analysis is possible in quantitative research.
tabler-icon-diamond-filled.svg

Secure Best Marks with AI Grader

Need help grading? Try our AI Grader for instant feedback on your assignments.
Document Page
Qualitative research
It is market research method which focuses on obtaining data by using
open ended and conversational communication. This method not only
focuses on what people thing but also focuses on the reason behind why
people think so. Advantages of qualitative research are-
It helps in saving time.
Attitude of people can be understood by using qualitative research.
It provides insights which are specific to industry.
It is an open ended process.
It incorporates human experience
Document Page
Correlation and regression
Correlation and regression are the techniques to know the relationship
between two variables. Correlation provides information about the linear
relationship between two variables and regression helps in knowing the
relationship between variables in terms of equation. It can also be said
that correlation is used to know the relationship between two variables
on the other hand regression is used to see how one variable affects
another.
In research, it is important to know that how variables are related to
each other and how one variable is affecting another. This thing can be
identified by correlation and regression. For example if college students
are taking English and math test then correlation is used to know if
student is good at math tend to be good at English and regression
determines that marks of English can be predicted with the help of
marks of math.
Document Page
Time series
It is statistical methodology. When a research has single subject or
research units are measured at regular interval time. It is appropriate for
single research design. It tracks the movements of data points such as
price of securities.
It is important to track the trend in business. Time series helps business
to see how given assets or security changes with the change in time.
Future trends can be estimated on the basis of historical data. These
trends can be studied and their effects can be reduced.Comparative
study is also possible with the help of time series.
tabler-icon-diamond-filled.svg

Paraphrase This Document

Need a fresh take? Get an instant paraphrase of this document with our AI Paraphraser
Document Page
Data handling-
Handling large set of data is not an easy task. This task is very
crucial for company.It is important to drop some of variables
which are not useable. There are three major challenges in data
analysis-
If data has various dimensions then it creates miscommunication
due to noise and correlation would be spurious.
Computation cost would be high and it is going to create
instability related to algorithm.
Big data always collected from various resources by using
different technologies it creates problems of heterogeneity.
Document Page
Uses of data analysis-
Data analytics plays crucial role in organization. Data scientist uses many
techniques in the research which is useful for the organization. It helps
organization to understand the though process of the customers with the
help of it forecasting can be done and forecasting can be compared with
historical data. It provides meaningful decision to their decision makers
which help in enhancing the performance of company. Forecasting of sales,
profit and turnover is possible with the help of analysis of data. It can be
compared with past records to measure the performance.
Document Page
CONCLUSION
From the presentation, it is analyzed that data analysis is very important in
making business decisions. There are various methods are discussed to analyze
the data. Correlation, regression and time series model are most important for
data analytics. There are various important decisions can be made with the help
of analysis of data. Quantitative and qualitative research can be conducted in
order to know the what are the changes that are needed to be made within
organization. After analyzing data needed changes can be done and compared
with past performance. SPSS is the mostly used software in data analysis. With
the help of this software large data set can be analyzed with the help of various
tests such as regression, correlation, chi-square and anova. Thus, it can be
interpreted that data analysis is very important in decision making.
tabler-icon-diamond-filled.svg

Secure Best Marks with AI Grader

Need help grading? Try our AI Grader for instant feedback on your assignments.
Document Page
References
Books and journals-
Chong, J., Wishart, D.S. and Xia, J., 2019. Using MetaboAnalyst 4.0 for
comprehensive and integrative metabolomics data analysis. Current protocols
in bioinformatics, 68(1), p.e86.
Almeida, O.G. and De Martinis, E.C., 2019. Bioinformatics tools to assess
metagenomic data for applied microbiology. Applied microbiology and
biotechnology, 103(1), pp.69-82.
Zhang, Y., Zmasek, C., Sun, G., Larsen, C.N. and Scheuermann, R.H., 2019.
Hepatitis C virus database and Bioinformatics analysis tools in the virus
Pathogen Resource (ViPR). In Hepatitis C Virus Protocols (pp. 47-69). Humana
Press, New York, NY.
Bortolomeazzi, M., Gaffo, E. and Bortoluzzi, S., 2019. A survey of software
tools for microRNA discovery and characterization using RNA-seq. Briefings in
bioinformatics, 20(3), pp.918-930.
chevron_up_icon
1 out of 11
circle_padding
hide_on_mobile
zoom_out_icon
logo.png

Your All-in-One AI-Powered Toolkit for Academic Success.

Available 24*7 on WhatsApp / Email

[object Object]