Business Intelligence Report: Excel, Weka, and Data Mining Analysis
VerifiedAdded on 2023/01/11
|17
|3795
|21
Report
AI Summary
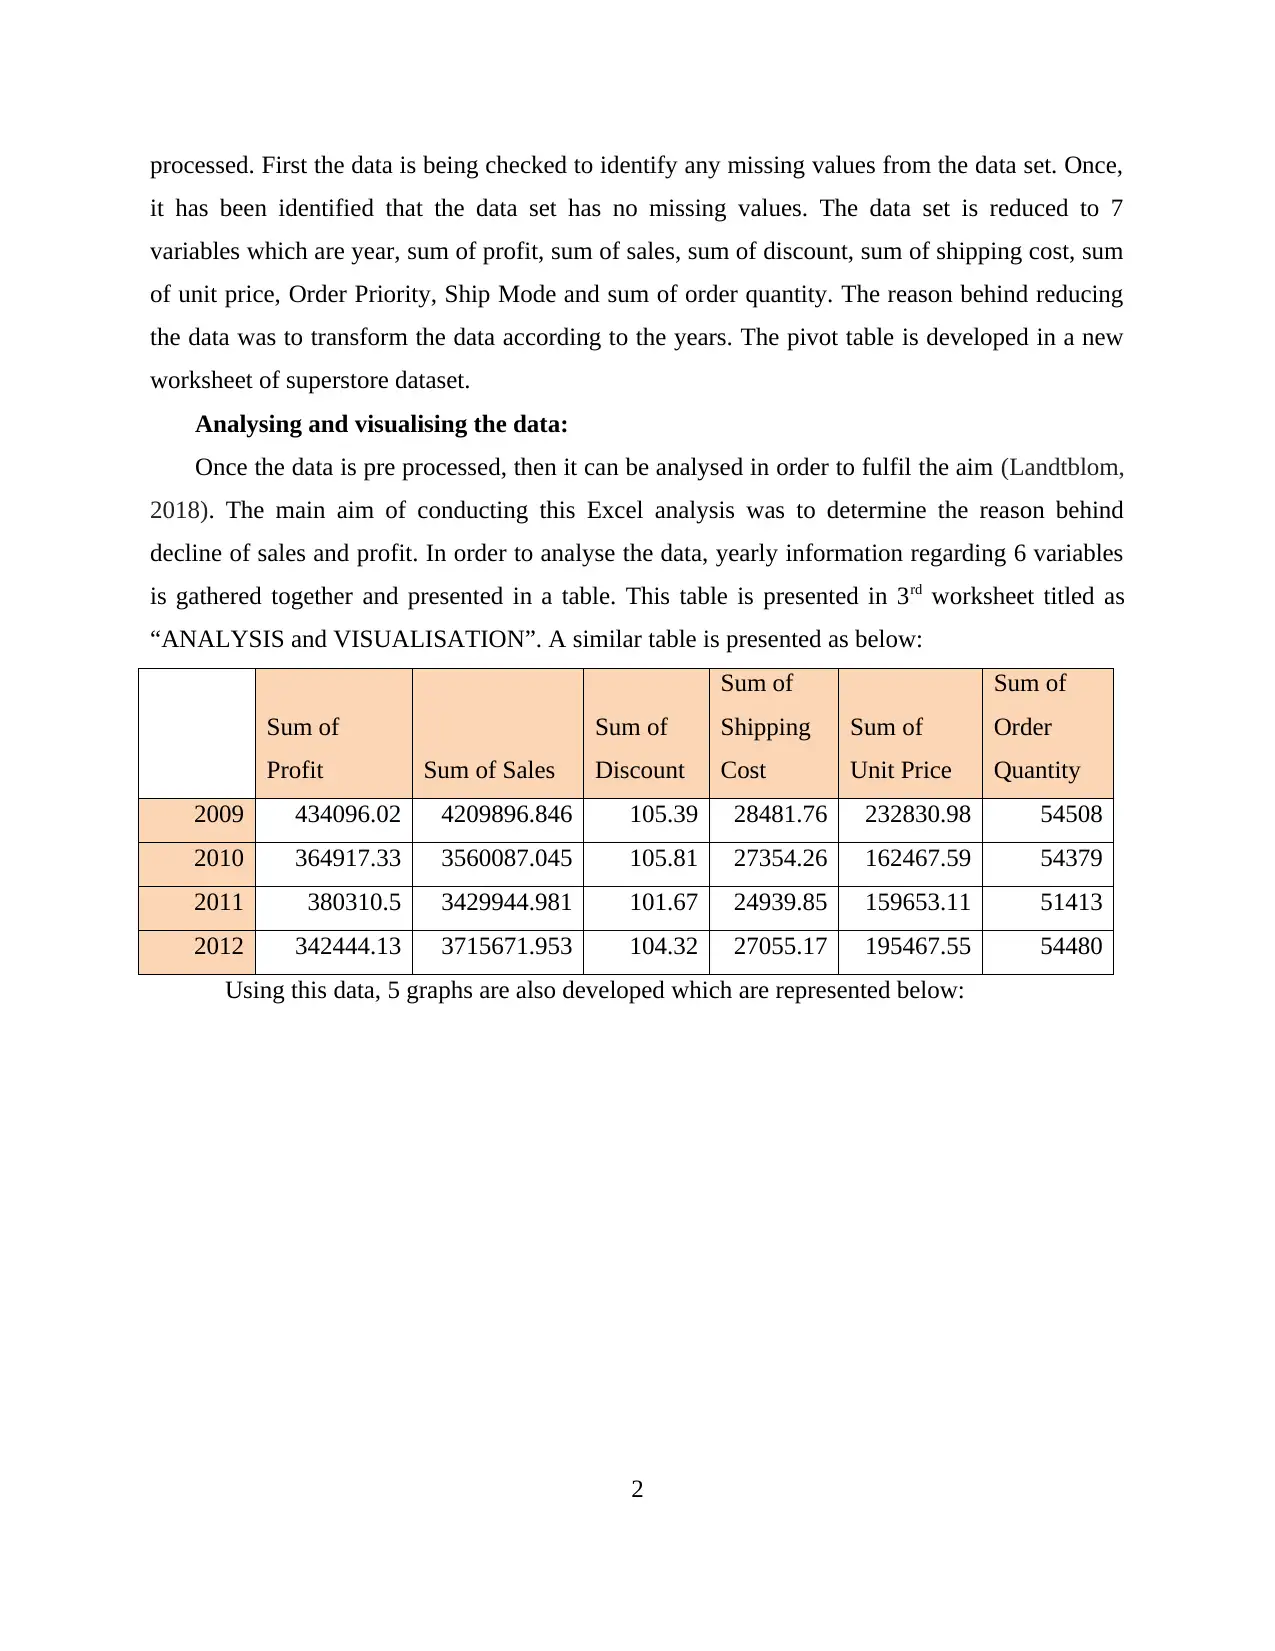
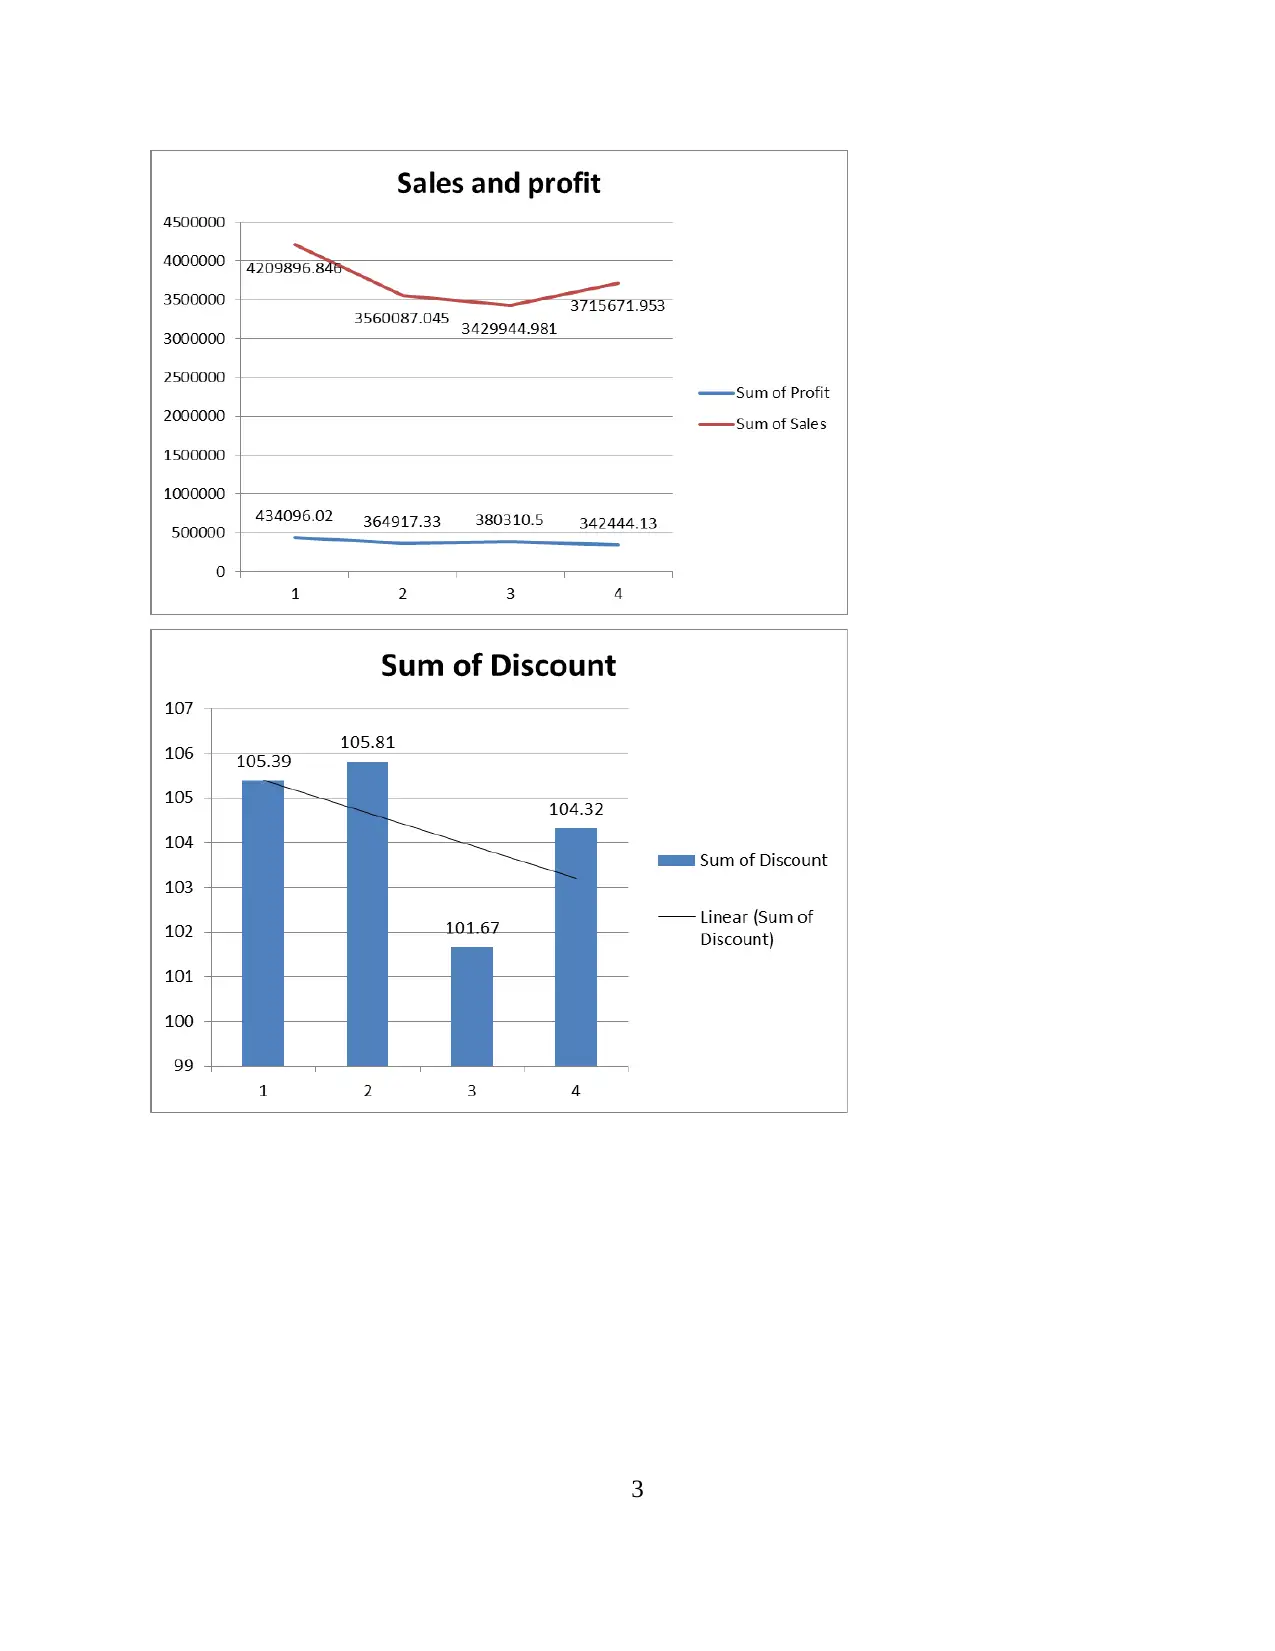
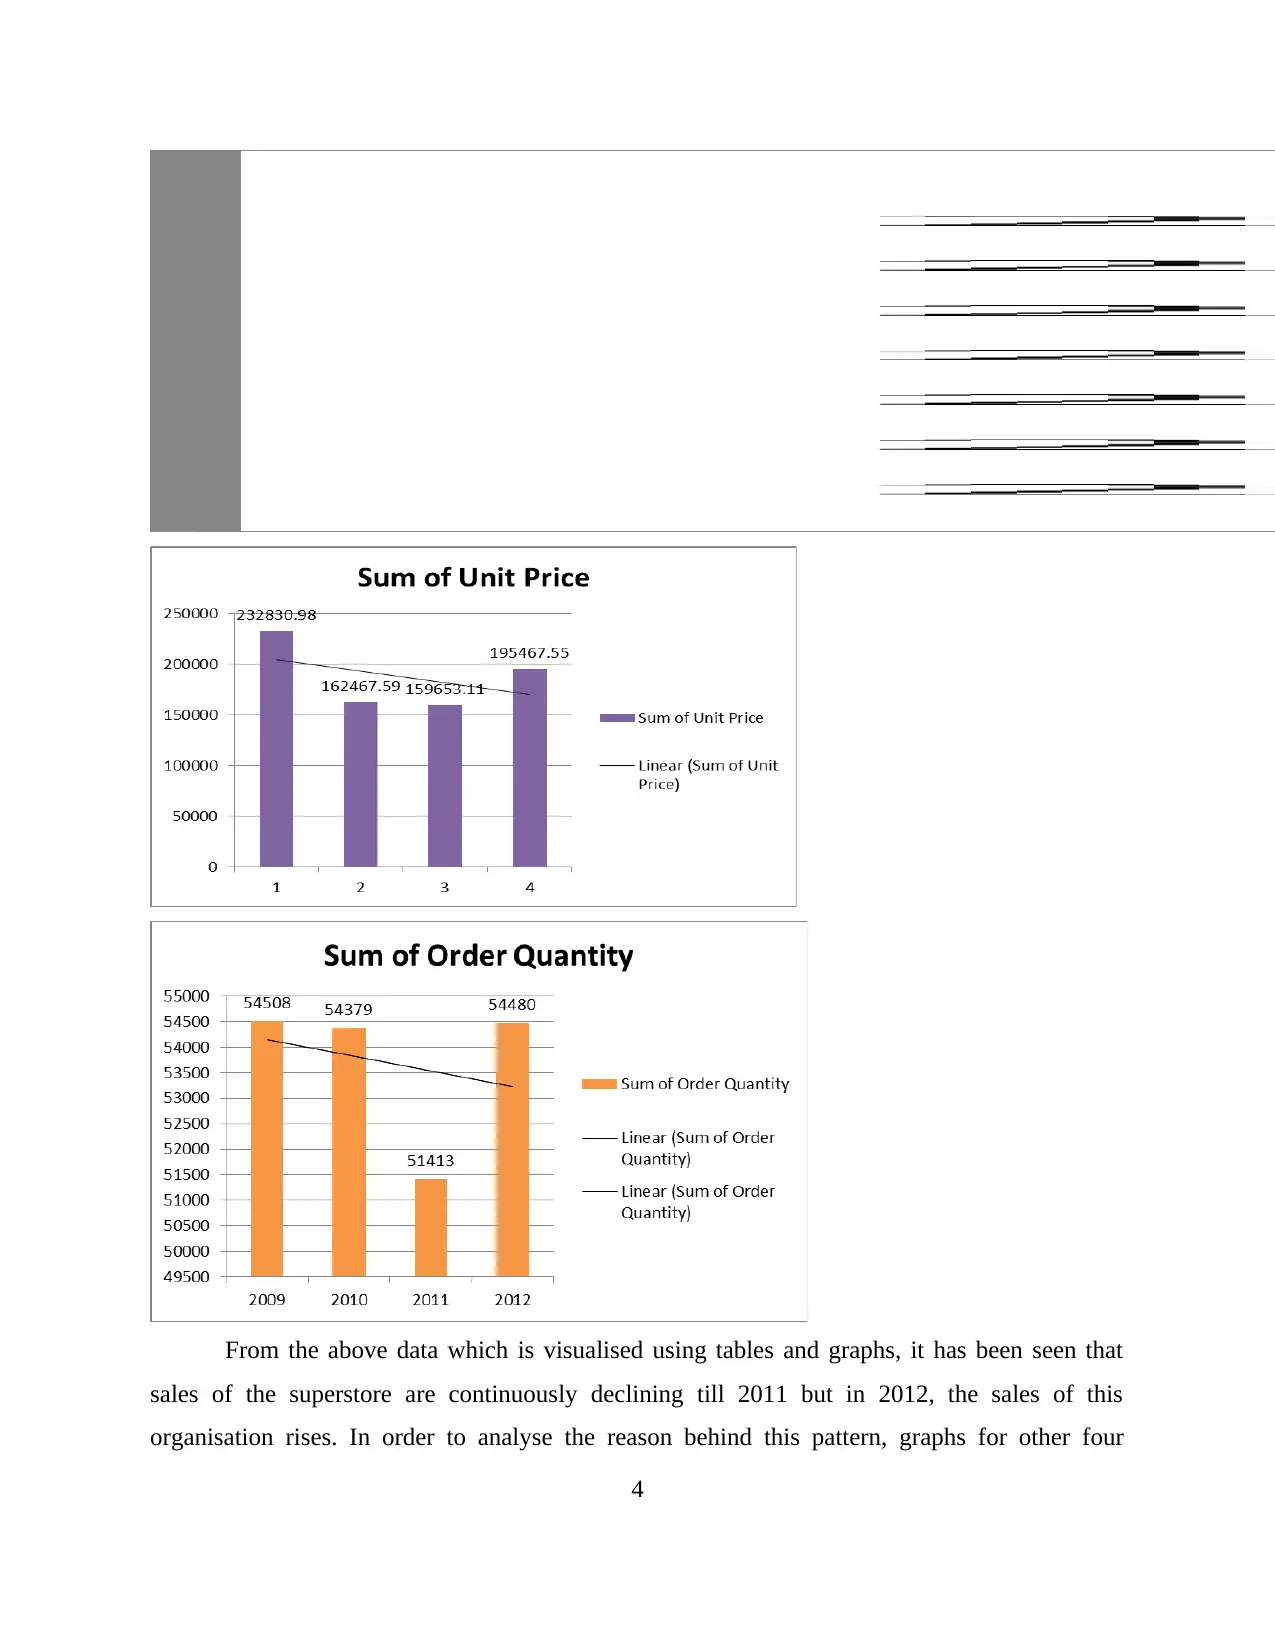
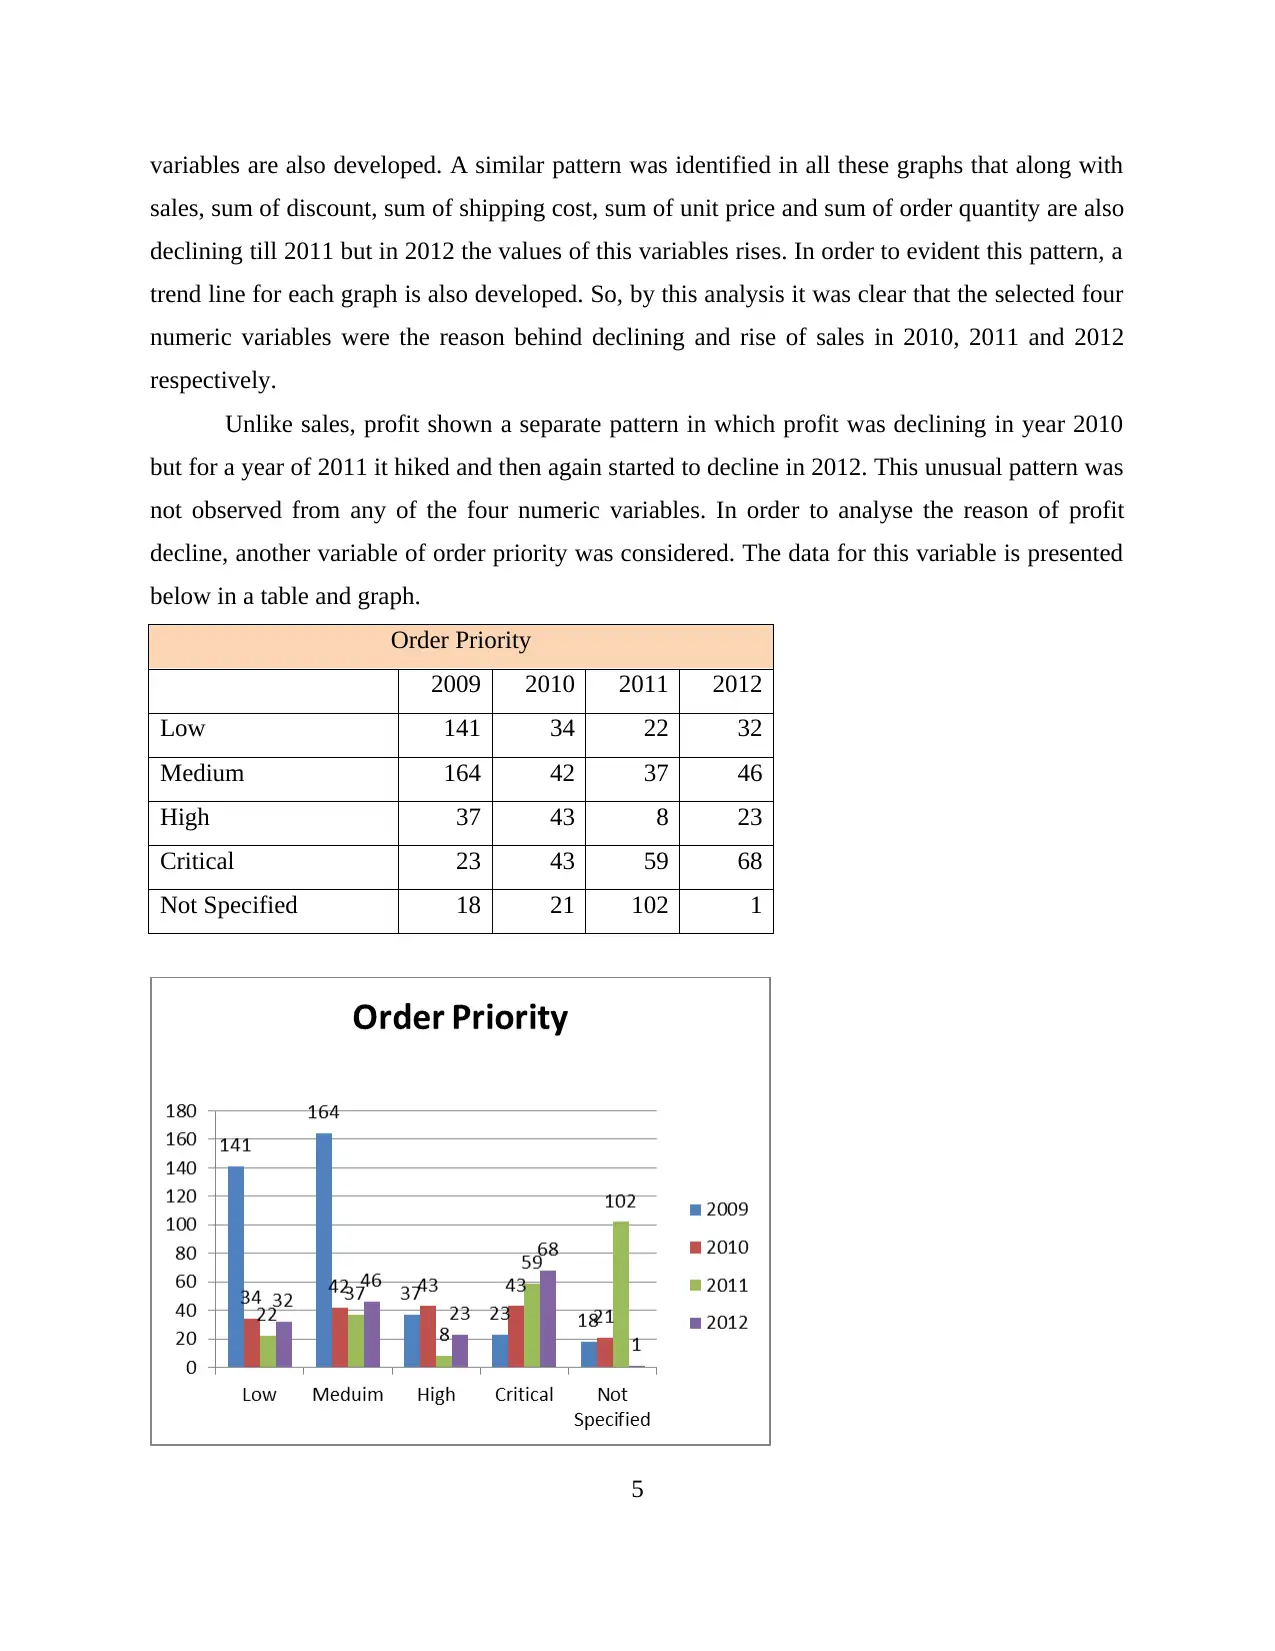
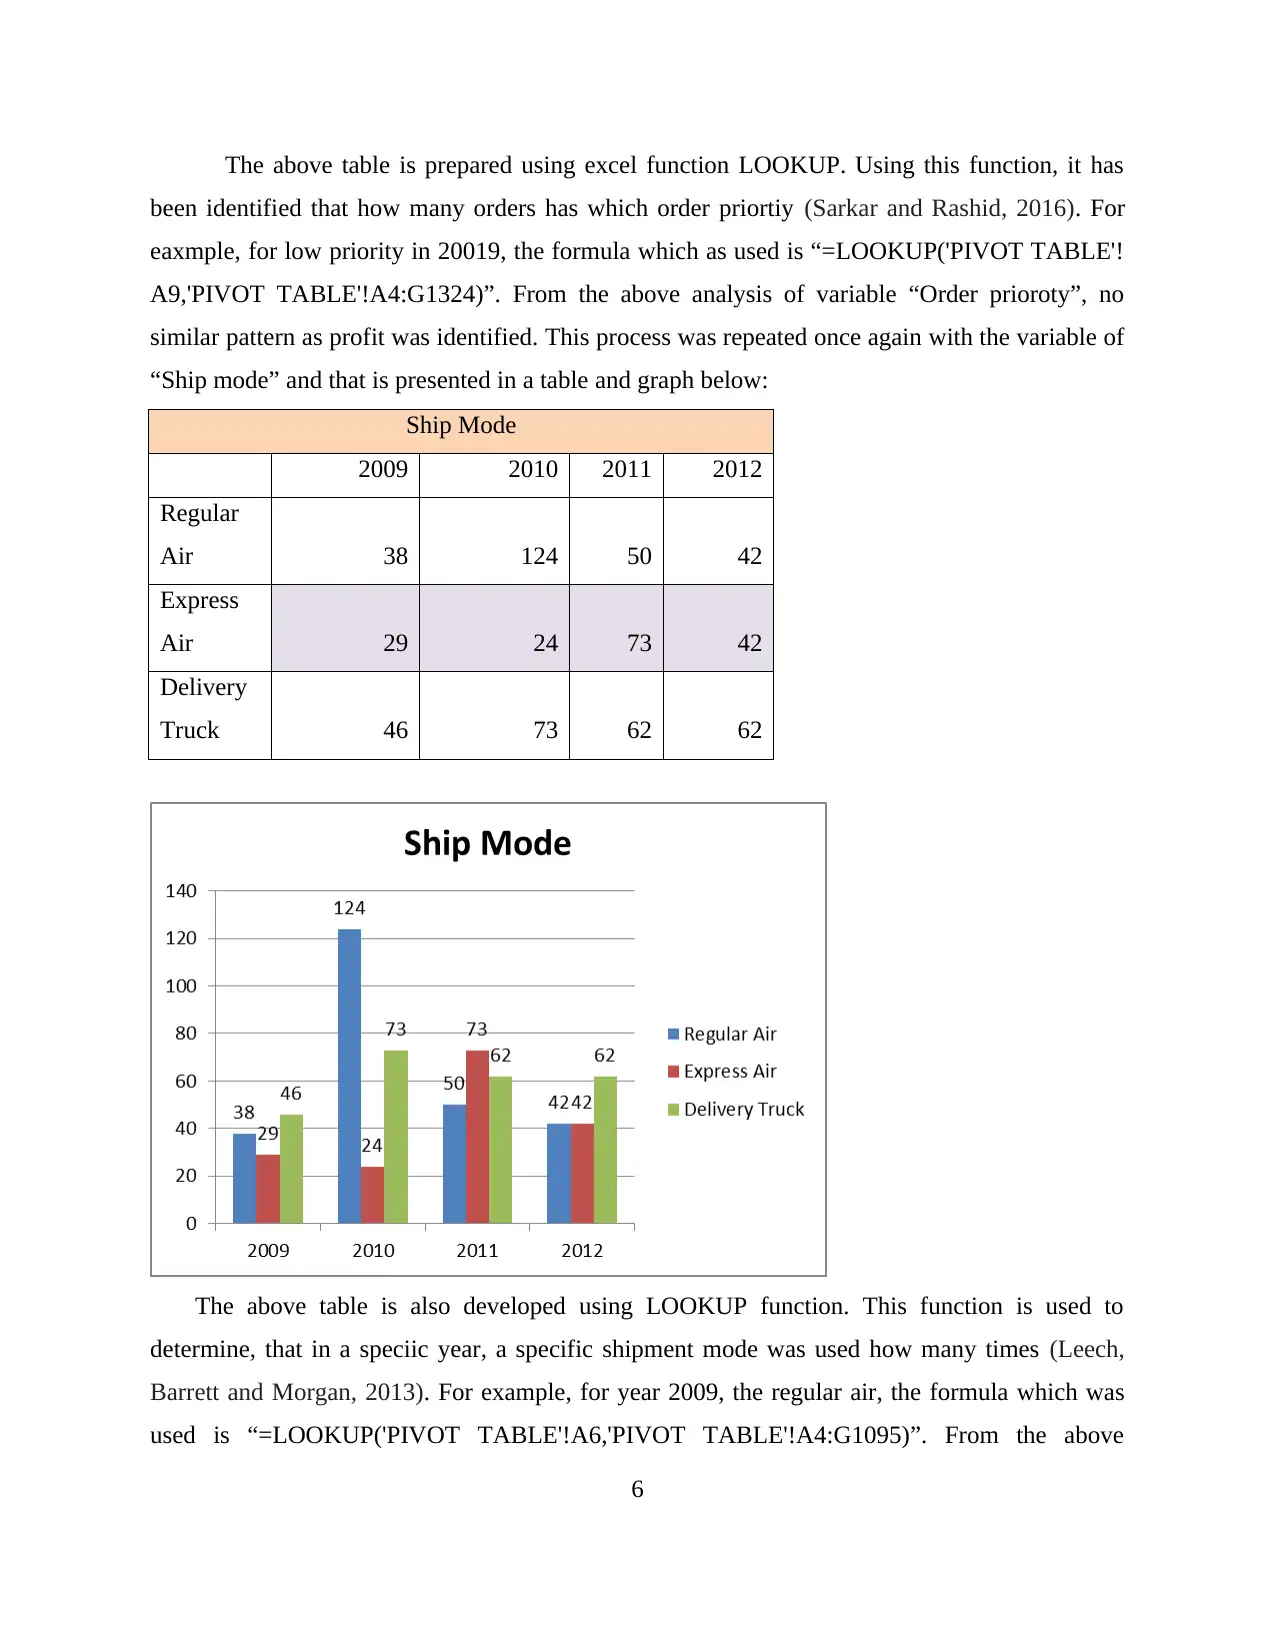
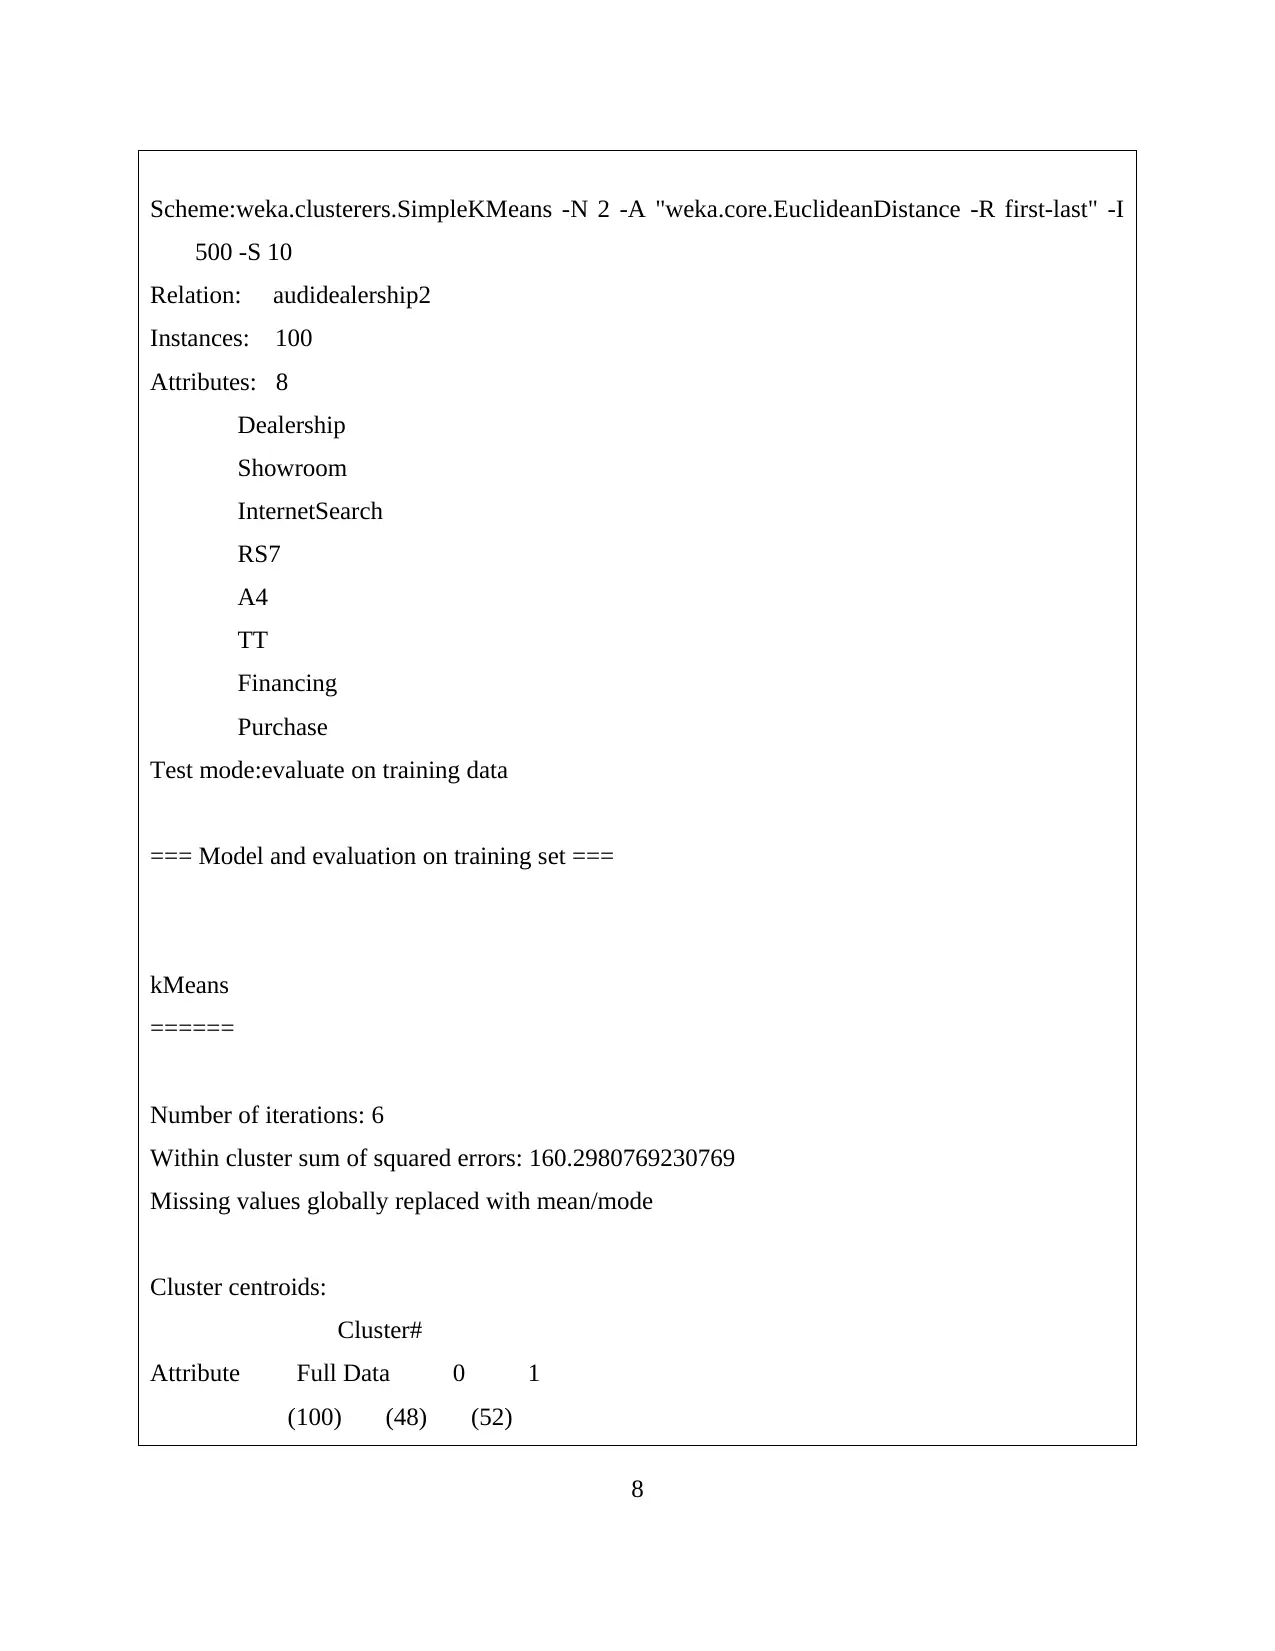
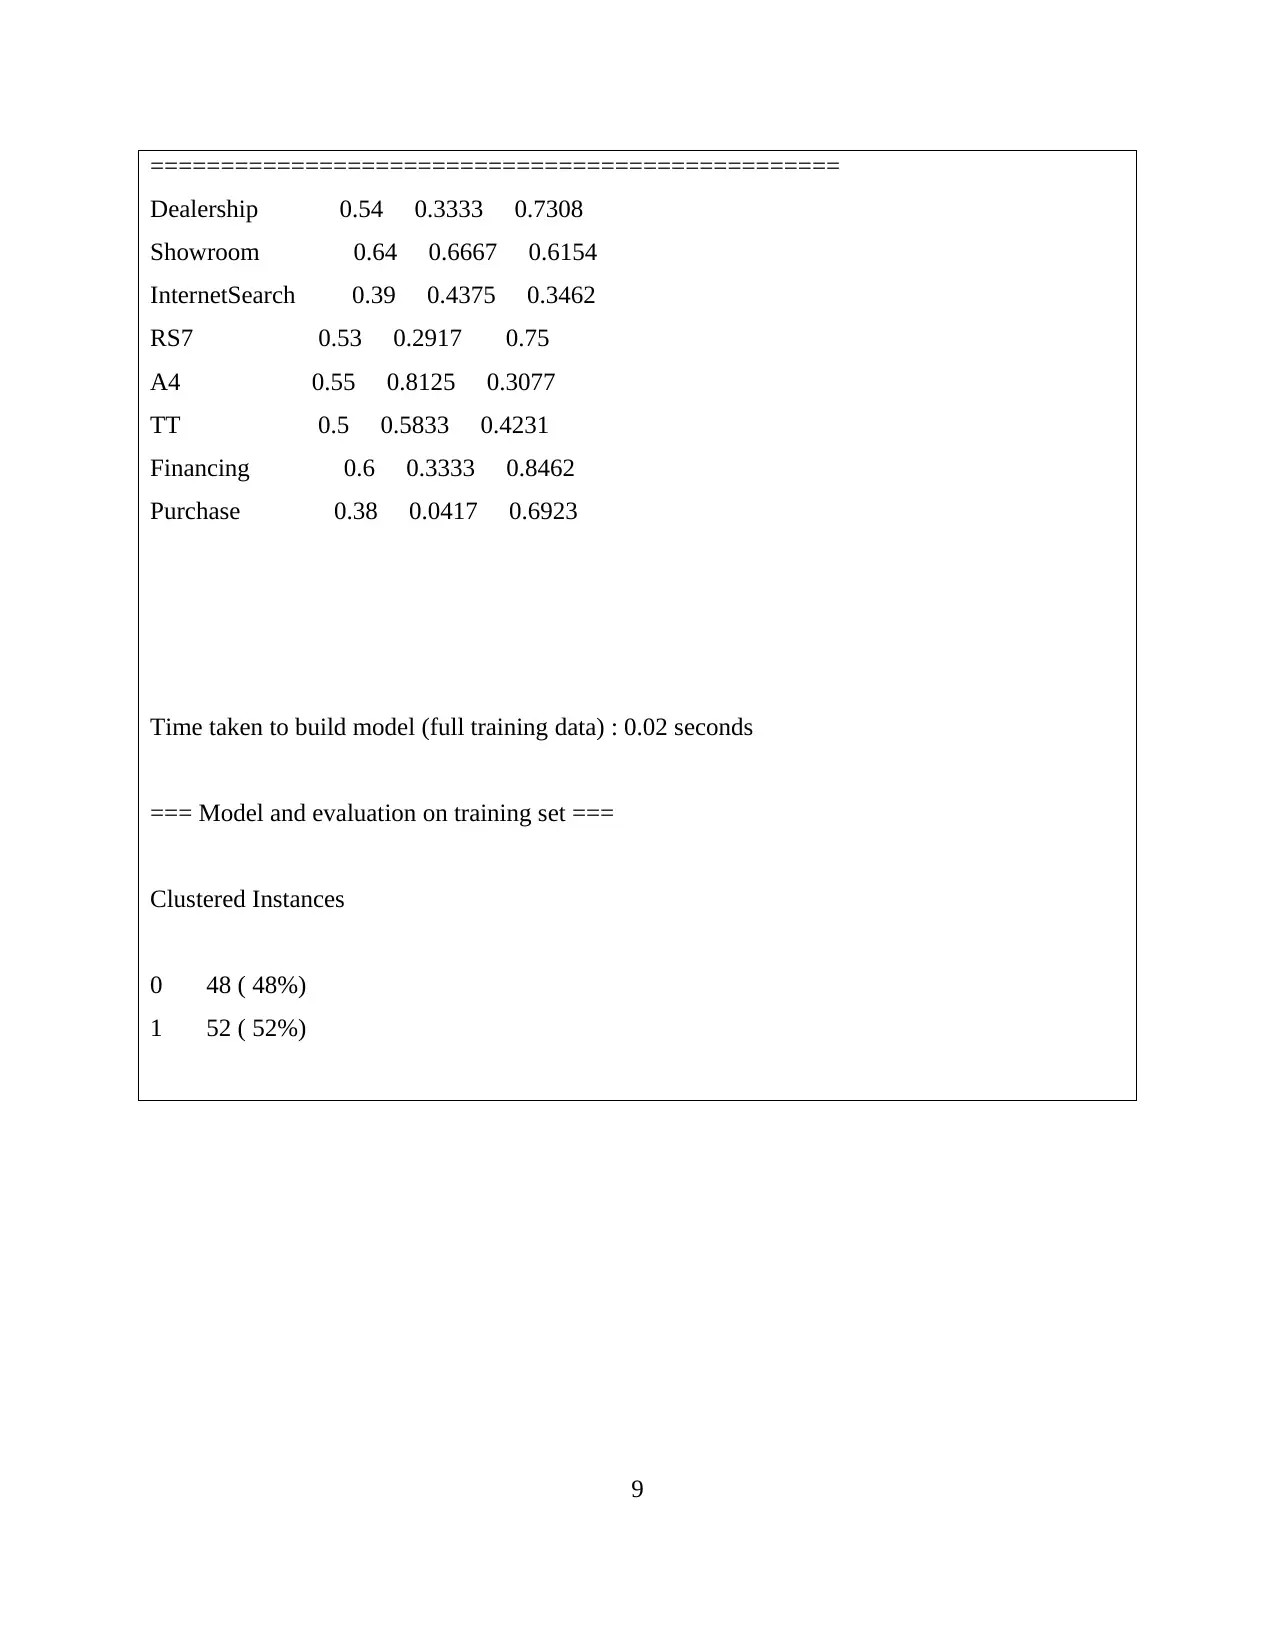
This report explores data handling and business intelligence, focusing on the analysis of sales and profit decline using Microsoft Excel and Weka. The first part utilizes Excel to preprocess, analyze, and visualize Superstore data, identifying factors contributing to sales and profit trends. The analysis reveals declining sales until 2011, with a subsequent rise in 2012, attributed to changes in discounts, shipping costs, unit prices, and order quantities. Profit decline is linked to the reduced use of Express Air shipment mode. The second part employs Weka for clustering the "audidealership" dataset using the k-means method, providing insights into customer behavior. The report also discusses common data mining methods like tracking patterns and classification that can be used in business, along with the advantages and disadvantages of Weka over Excel, offering a comprehensive overview of data analysis techniques.
Contribute Materials
Your contribution can guide someone’s learning journey. Share your
documents today.

DATA HANDLING AND
BUSINESS INTELLIGENCE
Secure Best Marks with AI Grader
Need help grading? Try our AI Grader for instant feedback on your assignments.

Contents
INTRODUCTION...........................................................................................................................1
Determining the decline in sales/profits over the years, and evaluating the use of Excel for pre-
processing the data, analysing the data and visualising the data.................................................1
PART 2............................................................................................................................................7
2.1 Weka workings......................................................................................................................7
2.2 Explaining the most common data mining methods that can be used in business..............10
2.3 Discussing the advantages/disadvantages of Weka over Excel...........................................12
CONCLUSION..............................................................................................................................13
REFERENCES..............................................................................................................................14


INTRODUCTION
Data handling is the procedure of storing and securing the data which is collected through
research (Beyer, 2019). This process is based upon the concept of business intelligence for which
data acts as an asset. The term business intelligence refers to the technologies which helps a
business to effectively operate and attain competitive advantage. The main aim of this report is to
build an understanding regarding the data warehousing and the tools by which data can be
handled and mined.
This report is divided into two parts. In the first part, the software application of Microsoft
Excel is used to pre process, analyse and visualise the data using Superstore data along with
current trends in data warehousing, business intelligence and data mining are also analysed. In
the second part of this report, the software application of Weka is used to present the clustering
using “audidealership” data. In this part, most common data mining methods are also analysed
which a business organisation can use in their operations. Along with which, benefits and
limitations of Weka over Excel are also discussed.
PART 1
Determining the decline in sales/profits over the years, and evaluating the use of Excel for pre-
processing the data, analysing the data and visualising the data
Microsoft excel is a software programmed which allows users to develop spread sheets and
then analyse it with various tools such as data analysis and graphical tools (Cao, Ewing and
Thompson, 2012). This software application is used for the data of Superstore. This data set has
21 variables including Row ID, Order Date, Order Priority, Order Quantity, Sales, Discount
, Ship Mode and many more. This data has information of total 8399 orders. By using
Excel formulas and tools, this data of Superstore is pre processed, analysed and visualised.
Pre processing the data:
The procedure of pre processing the data is quite complex and has various techniques to do
it. A standard procedure of pre processing of data involves five stages which are data cleaning,
data integration, data transformation, data reduction and lastly data discretisation (Jolliffe and
Stephenson, 2012). For this process, the tool of Microsoft Excel which is used is Pivot table.
Pivot table is a tool of summarising, classifying and processing the data so that it can be
further used for evaluation and analysis. Using this tool, the data set of Superstore is pre
1
Secure Best Marks with AI Grader
Need help grading? Try our AI Grader for instant feedback on your assignments.

processed. First the data is being checked to identify any missing values from the data set. Once,
it has been identified that the data set has no missing values. The data set is reduced to 7
variables which are year, sum of profit, sum of sales, sum of discount, sum of shipping cost, sum
of unit price, Order Priority, Ship Mode and sum of order quantity. The reason behind reducing
the data was to transform the data according to the years. The pivot table is developed in a new
worksheet of superstore dataset.
Analysing and visualising the data:
Once the data is pre processed, then it can be analysed in order to fulfil the aim (Landtblom,
2018). The main aim of conducting this Excel analysis was to determine the reason behind
decline of sales and profit. In order to analyse the data, yearly information regarding 6 variables
is gathered together and presented in a table. This table is presented in 3rd worksheet titled as
“ANALYSIS and VISUALISATION”. A similar table is presented as below:
Sum of
Profit Sum of Sales
Sum of
Discount
Sum of
Shipping
Cost
Sum of
Unit Price
Sum of
Order
Quantity
2009 434096.02 4209896.846 105.39 28481.76 232830.98 54508
2010 364917.33 3560087.045 105.81 27354.26 162467.59 54379
2011 380310.5 3429944.981 101.67 24939.85 159653.11 51413
2012 342444.13 3715671.953 104.32 27055.17 195467.55 54480
Using this data, 5 graphs are also developed which are represented below:
2

3

From the above data which is visualised using tables and graphs, it has been seen that
sales of the superstore are continuously declining till 2011 but in 2012, the sales of this
organisation rises. In order to analyse the reason behind this pattern, graphs for other four
4
sales of the superstore are continuously declining till 2011 but in 2012, the sales of this
organisation rises. In order to analyse the reason behind this pattern, graphs for other four
4
Paraphrase This Document
Need a fresh take? Get an instant paraphrase of this document with our AI Paraphraser

variables are also developed. A similar pattern was identified in all these graphs that along with
sales, sum of discount, sum of shipping cost, sum of unit price and sum of order quantity are also
declining till 2011 but in 2012 the values of this variables rises. In order to evident this pattern, a
trend line for each graph is also developed. So, by this analysis it was clear that the selected four
numeric variables were the reason behind declining and rise of sales in 2010, 2011 and 2012
respectively.
Unlike sales, profit shown a separate pattern in which profit was declining in year 2010
but for a year of 2011 it hiked and then again started to decline in 2012. This unusual pattern was
not observed from any of the four numeric variables. In order to analyse the reason of profit
decline, another variable of order priority was considered. The data for this variable is presented
below in a table and graph.
Order Priority
2009 2010 2011 2012
Low 141 34 22 32
Medium 164 42 37 46
High 37 43 8 23
Critical 23 43 59 68
Not Specified 18 21 102 1
5

The above table is prepared using excel function LOOKUP. Using this function, it has
been identified that how many orders has which order priortiy (Sarkar and Rashid, 2016). For
eaxmple, for low priority in 20019, the formula which as used is “=LOOKUP('PIVOT TABLE'!
A9,'PIVOT TABLE'!A4:G1324)”. From the above analysis of variable “Order prioroty”, no
similar pattern as profit was identified. This process was repeated once again with the variable of
“Ship mode” and that is presented in a table and graph below:
Ship Mode
2009 2010 2011 2012
Regular
Air 38 124 50 42
Express
Air 29 24 73 42
Delivery
Truck 46 73 62 62
The above table is also developed using LOOKUP function. This function is used to
determine, that in a speciic year, a specific shipment mode was used how many times (Leech,
Barrett and Morgan, 2013). For example, for year 2009, the regular air, the formula which was
used is “=LOOKUP('PIVOT TABLE'!A6,'PIVOT TABLE'!A4:G1095)”. From the above
6

analysis of variable “ship mode”, a similar pattern to profit was identified in Express Air
shipment mode. This implies like profit the usgae of Express air shipment mode was reduced in
2010, hicked in 2011 and then continous to decline in 2012. This leads to the analysis that due to
variation in shipment of mode of Express Air, the profit of superstore was declining.
Reasons behind decline in sales/profits over the years:
After the pre processing, analysing and visualising the data, certain conclusions are
developed which has helped in determining the reasons behind the sales and profit of superstore
over the year. For decline in sales, for reasons are identified which are decline in allowed
discount to customers, decline in shipping cost due to reduced number of shipped products,
decline in unit price at which each product is sold and decline in overall order quantity of
product over the years.
For decline in profit, only one reason has identified which is decline in the usage of
shipment mode of Express Air. This type of shipment mode is most effective and people rely
upon this mode and due to reduction in the usage of this mode by super store the profit of this
company started to decline.
PART 2
2.1 Weka workings
Weka (Waikato Environment for Knowledge Analysis) is statistical software used for
running algorithms. This software is majorly used for the process of data mining. This software
includes certain tools by which a user can pre process the data, classy, cluster and visualise the
data (Gulia, 2020). Using the Weka application, the data set of audidealership is used to perform
data mining using clustering. Data mining is a procedure of examining a data so that new and
advanced information can be generated from that data. Clustering is a method by which an
investigator can divide the large data set into groups according to their similar attributes.
Weka provides various options of clustering from which k means clustering is used. This
method allows divide the data into non overlapping sub groups. This method involves integration
and classifying. The data set of “audidealership” is clustered and the result which is gained is
presented below along with visualization graphs.
=== Run information ===
7
Secure Best Marks with AI Grader
Need help grading? Try our AI Grader for instant feedback on your assignments.

Scheme:weka.clusterers.SimpleKMeans -N 2 -A "weka.core.EuclideanDistance -R first-last" -I
500 -S 10
Relation: audidealership2
Instances: 100
Attributes: 8
Dealership
Showroom
InternetSearch
RS7
A4
TT
Financing
Purchase
Test mode:evaluate on training data
=== Model and evaluation on training set ===
kMeans
======
Number of iterations: 6
Within cluster sum of squared errors: 160.2980769230769
Missing values globally replaced with mean/mode
Cluster centroids:
Cluster#
Attribute Full Data 0 1
(100) (48) (52)
8

=================================================
Dealership 0.54 0.3333 0.7308
Showroom 0.64 0.6667 0.6154
InternetSearch 0.39 0.4375 0.3462
RS7 0.53 0.2917 0.75
A4 0.55 0.8125 0.3077
TT 0.5 0.5833 0.4231
Financing 0.6 0.3333 0.8462
Purchase 0.38 0.0417 0.6923
Time taken to build model (full training data) : 0.02 seconds
=== Model and evaluation on training set ===
Clustered Instances
0 48 ( 48%)
1 52 ( 52%)
9

The data set of “audidealership” has 7 variables which are Dealership Showroom,
InternetSearch, RS7, A4, TT, financing and purchase. These variables are recorded in such a way
that it keep track of every person who walk through dealership to showroom. This data contains
information for 100 people which are recorded as 100 rows. A cell having value of 1 means the
person made that specific step and a cell value having 0 mean that person have not made it to
that step. Considering this data, Weka clustering is conducted above. The above results show that
there are two clusters in the data set which are “cluster 0” and “cluster 1”.
The first variable is dealership, the cluster 1 results of this variable are 0.7308 which
implies this much people has walked through dealership and rest has not even made to this point.
The people who have walked through dealership have next stage of walking through showroom.
Out of 0.7308 only 0.6154 people have walked through showroom. This process continuous till
the variable of purchase. From the total of 100, 52 people are in cluster 1 and 48 are in cluster 0.
The graphs attached after the cluster result shows the results in a presentable form.
2.2 Explaining the most common data mining methods that can be used in business
The method of data mining is to search large database databases for new information. In a
company manager may intuitively assume that "mining" of data involves processing of new
information (Begum, 2013). These strategies are particularly valuable as they also help to
evaluate the challenges and find practical solutions that can not only improve the company's
10
Paraphrase This Document
Need a fresh take? Get an instant paraphrase of this document with our AI Paraphraser

revenue but may also enhance customer loyalty and reduce unnecessary market and operational
costs. The most common data mining methods are:
Tracking patterns: Among the most important methods of data mining is really the
understanding of trends in the sets of data. It is typically an inconsistency in the data that
happens at frequent intervals, or where a specific parameter is rise and fall throughout time. For
example, manager of company might find certain sales start to increase right around the holidays
or they can also note that hot weather attracts more visitors to respective company homepage.
Classification: Classification will be a more complicated strategy in data mining that
requires manager to gather specific characteristics in discernible classes and then use them to
draw additional assumptions and functions. They will be able to identify information as small,
high or medium risk of credit if they, can analyse the financial record and transactions of
particular consumers. Such categories will also be used to understand more about the
clients. That is similar to the form of data being processed. For examples, multimedia, space
data, text data, time series, World Wide Web, etc. The ranking dependent on the type of
information collected or the features of data mining. For example, some structures appear to be
broad, with certain knowledge mining features in common: segregation, grouping, grouping,
cluster, characterization, etc.
Association: The correlation is connected to patterns of monitoring, but even more common
to variables based on them. This can also monitor for interesting events or characteristics which
are very much related to the next event or assign; for example, this will find that company buyers
sometimes buy a second similar object, as they purchase a single item as well. This is generally
used to fill in parts in online retailers that are users have bought (Singh and Saikia, 2020).
Outlier detection: In certain instances it is not possible to recognize the data collection
easily by merely recognizing the overall sequence. Manager of company do need deviations or
outliers to really be able to distinguish in the statistics. For example, manager will want to look
at the pickup and then see what brought it there, because the customers are almost entirely male.
But, there is a massive spike in women's customers over a strange week in July, and so you can
either duplicate that or you can know the demographic better.
Clustering: The category clustering is somewhat similar, thus grouping pieces of data in
line with the distinctions between them. For example, depending on how much discretionary
11

money they have and how frequently they frequently purchase in respective company business,
so they can be might divided different groups of company customer.
Regression: Regression, which is used mainly to assess a variable's probability in the
context of many other factors as a method of forecasting and modelling. Manager of company
can, take advantage of the variables of supply, customer demand and competitiveness to estimate
the same price. In fact, the key goal of regression is to enable you accurately determine
correlation between two (or more) variables within a single data set.
Prediction: Prediction is among the most useful methods in data mining, because it is used
to forecast the data forms they will see nearby time. For several cases it only suffices to know
and consider recent patterns to carry out a fairly reliable forecast of possible events. For
example, they could look at the financial records and past transactions of customers and see if
they are going to be a credit risk in the future (Madasamy and Tamilselvi, 2012).
Thus, it can be stated from the above discussion that if a business basically knows type of
business issue or problem which is to be solved with the application of data mining techniques.
The methods in data mining are used to evaluate data from various points of view. Today,
company can build their expertise to pick the right technologies for the processing of data in
order to compile the details and provide valuable information. It is really necessary for the
knowledge they create to be used to solve various business challenges using some of the
database processing techniques.
2.3 Discussing the advantages/disadvantages of Weka over Excel
Advantages of Weka over Excel:
Free availability – The software application of Weka has free availability and users can
install it under GNU General Public License (Hasan and Isa, 2016). Whereas, Excel is not freely
available and in order to use it user has to purchase whole Microsofy office package.
Portability – Weka is a software application which is based on Java programming
language due to which it runs on almost every operating platform such as Windows, Mac OS X
and Linux. On the other hand, Microsoft Excel only runs with Windows operating system.
Access to SQL databases – Weka software can process the result returned by a database
query which is not possible in Microsoft Excel.
12

Easy to use – Weka software application uses command line approach due to which it is
easy to use and does not require a special knowledge of coding and information technology. On
the other hand, Excel has ample features due to which, it is complex to use.
Disadvantages of Weka over Excel:
Memory bound – The most influential disadvantage of Weka is its restriction of memory.
Using Weka, a user can store a limited data having limited memory. Due to this disadvantage,
Weka is considered suitable for small organisations. On other hand, Excel is not memory bound
it can handle large data sets and is suitable for organisations having any size or scope (Singh and
Saikia, 2020).
Data mining – Weka is a data mining software but it is not compatible with multi relational
data mining. On the other hand, Excel has the add on feature of data analysis using which
mutltiple relational data can be mined effectively.
Clustering – Weka is application software which is considered as one of the best
applications for clustering. But this software has a demerit that it requires the number of clusters
in advance. On the other hand, Excel does not require cluster number in advance.
CONCLUSION
From the above report, it has been analysed that data handling is a complex procedure which
requires extensive skills and understanding of data mining software. It has been summarised that
there are various data mining methods, from which clustering is the most appropriate method as
it provides new information from the raw dataset. It has been also concluded that both Excel and
Weka are data analysis software but Weka is better than Microsoft Excel as it helps in immediate
results of exploring and experimentation of the dataset.
13
Secure Best Marks with AI Grader
Need help grading? Try our AI Grader for instant feedback on your assignments.

REFERENCES
Books and Journals
Beyer, W. H., 2019. Handbook of tables for probability and statistics. Crc Press.
Cao, Q., Ewing, B.T. and Thompson, M.A., 2012. Forecasting wind speed with recurrent neural
networks. European Journal of Operational Research. 221(1). pp.148-154.
Jolliffe, I.T. and Stephenson, D.B. eds., 2012. Forecast verification: a practitioner's guide in
atmospheric science. John Wiley & Sons.
Landtblom, K. K., 2018. Prospective Teachers’ Conceptions of the Concepts Mean, Median and
Mode. In Students' and Teachers' Values, Attitudes, Feelings and Beliefs in
Mathematics Classrooms (pp. 43-52). Springer, Cham.
Leech, N., Barrett, K. and Morgan, G. A., 2013. SPSS for intermediate statistics: Use and
interpretation. Routledge.
Sarkar, J. and Rashid, M., 2016. Visualizing mean, median, mean deviation, and standard
deviation of a set of numbers. The American Statistician. 70(3). pp.304-312.
Gulia, P., Comprehensive Study of Open-Source Big Data Mining Tools.
Begum, S.H., 2013. Data mining tools and trends–an overview. International journal of
Emergning Research in Management & Technology, pp.6-12.
Singh, S. and Saikia, L.P., 2020. A Comparative Analysis of Text Classification Algorithms for
Ambiguity Detection in Requirement Engineering Document Using WEKA. In ICT
Analysis and Applications (pp. 345-354). Springer, Singapore.
Madasamy, B. and Tamilselvi, J.J., 2012, August. Assesement of Freeware Data Mining Tools
over Some Wide-Range Characteristics. In International Conference on Information
Processing (pp. 529-535). Springer, Berlin, Heidelberg.
Singh, S. and Saikia, L.P., 2020. A Comparative Analysis of Text Classification Algorithms for
Ambiguity Detection in Requirement Engineering. ICT Analysis and Applications:
Proceedings of ICT4SD 2019, Volume 2, 2, p.345.
Hasan, A.B. and Isa, M.H.M., 2016, January. S&T converging trends in dealing with disaster: A
review on AI tools. In AIP Conference Proceedings (Vol. 1704, No. 1, p. 030001). AIP
Publishing LLC.
14
1 out of 17
Related Documents

Your All-in-One AI-Powered Toolkit for Academic Success.
+13062052269
info@desklib.com
Available 24*7 on WhatsApp / Email
Unlock your academic potential
© 2024 | Zucol Services PVT LTD | All rights reserved.