University Assignment: Numeracy, Data & IT Contents Analysis
VerifiedAdded on 2023/01/06
|19
|4162
|2
Homework Assignment
AI Summary
This document presents a comprehensive solution to an assignment focusing on numeracy, data analysis, and IT concepts. The assignment covers a range of topics, including understanding fractions, percentages, and significant figures. It delves into practical applications of these concepts through problem-solving exercises. The solution also explores data analysis techniques, such as interpreting data and utilizing Excel functions like ranking and conditional formatting to analyze data sets. The assignment is divided into multiple parts, each addressing specific questions and scenarios. The document provides detailed explanations, calculations, and step-by-step instructions to guide the reader through the problem-solving process, culminating in a complete and well-structured solution. The conclusion summarizes the key findings and reinforces the importance of numeracy, data analysis, and IT skills in various fields.
Using Numeracy, Data &
IT
IT
Paraphrase This Document
Need a fresh take? Get an instant paraphrase of this document with our AI Paraphraser

Contents
INTRODUCTION.......................................................................................................................................3
PART 1.......................................................................................................................................................3
Question 1...............................................................................................................................................3
Question 2...............................................................................................................................................3
Question 3...............................................................................................................................................4
Question 4...............................................................................................................................................4
Question 5...............................................................................................................................................4
Question 6...............................................................................................................................................5
Question 7...............................................................................................................................................5
Question 8...............................................................................................................................................5
Question 9...............................................................................................................................................6
Question 10.............................................................................................................................................6
PART 2.......................................................................................................................................................7
Question 11.............................................................................................................................................7
PART 3.......................................................................................................................................................9
Question 12.............................................................................................................................................9
Question 13.............................................................................................................................................9
Question 14...........................................................................................................................................12
Question 15...........................................................................................................................................13
Question 16...........................................................................................................................................14
CONCLUSION.........................................................................................................................................16
REFERENCES..........................................................................................................................................17
⊘ This is a preview!⊘
Do you want full access?
Subscribe today to unlock all pages.
Trusted by 1+ million students worldwide
INTRODUCTION
The capacity to rationale and to implement precise mathematical definitions is described
as numeracy. Simple abilities in numeracy comprise of understanding basic arithmetic such as
addition, subtraction, multiplication, and differentiation. In their growth and pathological
regression, numeracy skills have been thoroughly researched, but it is not well understood if they
alter healthy ageing. Similarly, it is still an unanswered question if either numerical ability can be
enhanced during ageing. Data analysis is a data inspection, cleaning, transformation and
modeling method aimed at finding valuable knowledge, reporting findings and facilitating
decision-making. Data analysis has numerous facets and methods, under a number of names,
involving various strategies, and is used in various fields of business, research, and social
science. Data analysis involves making more knowledge related in today’s business environment
and helping companies perform more effectively.
PART 1
Question 1
Numerator: The numerator is the amount on the upper part of the fraction that occurs. A
fraction is nothing other than a portion of all of it that said previously. The numerator thus
reflects the amount of equal portions of all of it that will be factored.
Denominator: The second element of the fraction is the denominator. Mostly on lower part of
the fraction, we constitute it. In addition, it refers to the number of two portions that we can split
the whole into. Take another example of the 1⁄2 fraction. Over here, 1⁄2 implies that two
equivalent portions of a specific image are factored.
The denominator reflects the amount of equal portions in a fraction, and the numerator
reflects however many sections are included in a fraction. As p / q is like p parts in a fraction,
which is really the numerator of an entire entity, which is separated into q sections of the same
dimension, which would be the denominator.
Paraphrase This Document
Need a fresh take? Get an instant paraphrase of this document with our AI Paraphraser
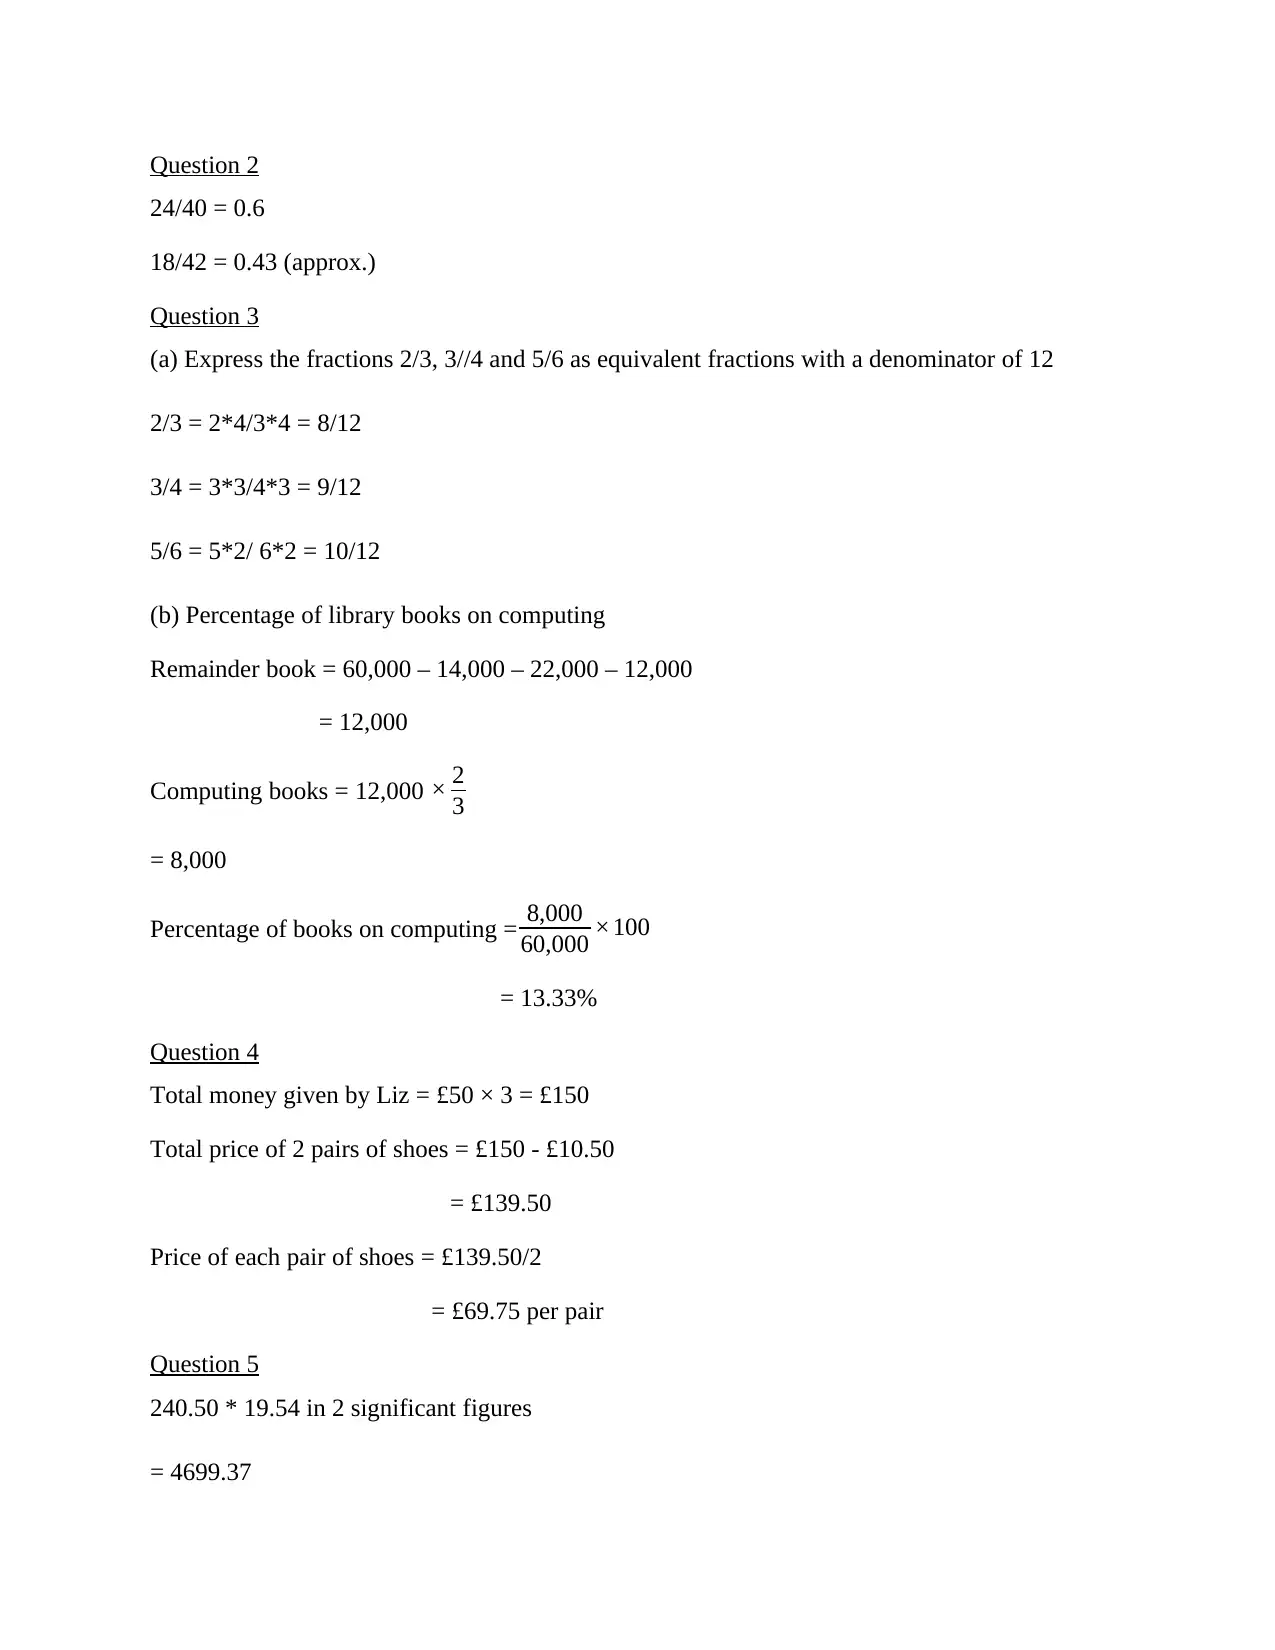
Question 2
24/40 = 0.6
18/42 = 0.43 (approx.)
Question 3
(a) Express the fractions 2/3, 3//4 and 5/6 as equivalent fractions with a denominator of 12
2/3 = 2*4/3*4 = 8/12
3/4 = 3*3/4*3 = 9/12
5/6 = 5*2/ 6*2 = 10/12
(b) Percentage of library books on computing
Remainder book = 60,000 – 14,000 – 22,000 – 12,000
= 12,000
Computing books = 12,000 × 2
3
= 8,000
Percentage of books on computing = 8,000
60,000 ×100
= 13.33%
Question 4
Total money given by Liz = £50 × 3 = £150
Total price of 2 pairs of shoes = £150 - £10.50
= £139.50
Price of each pair of shoes = £139.50/2
= £69.75 per pair
Question 5
240.50 * 19.54 in 2 significant figures
= 4699.37
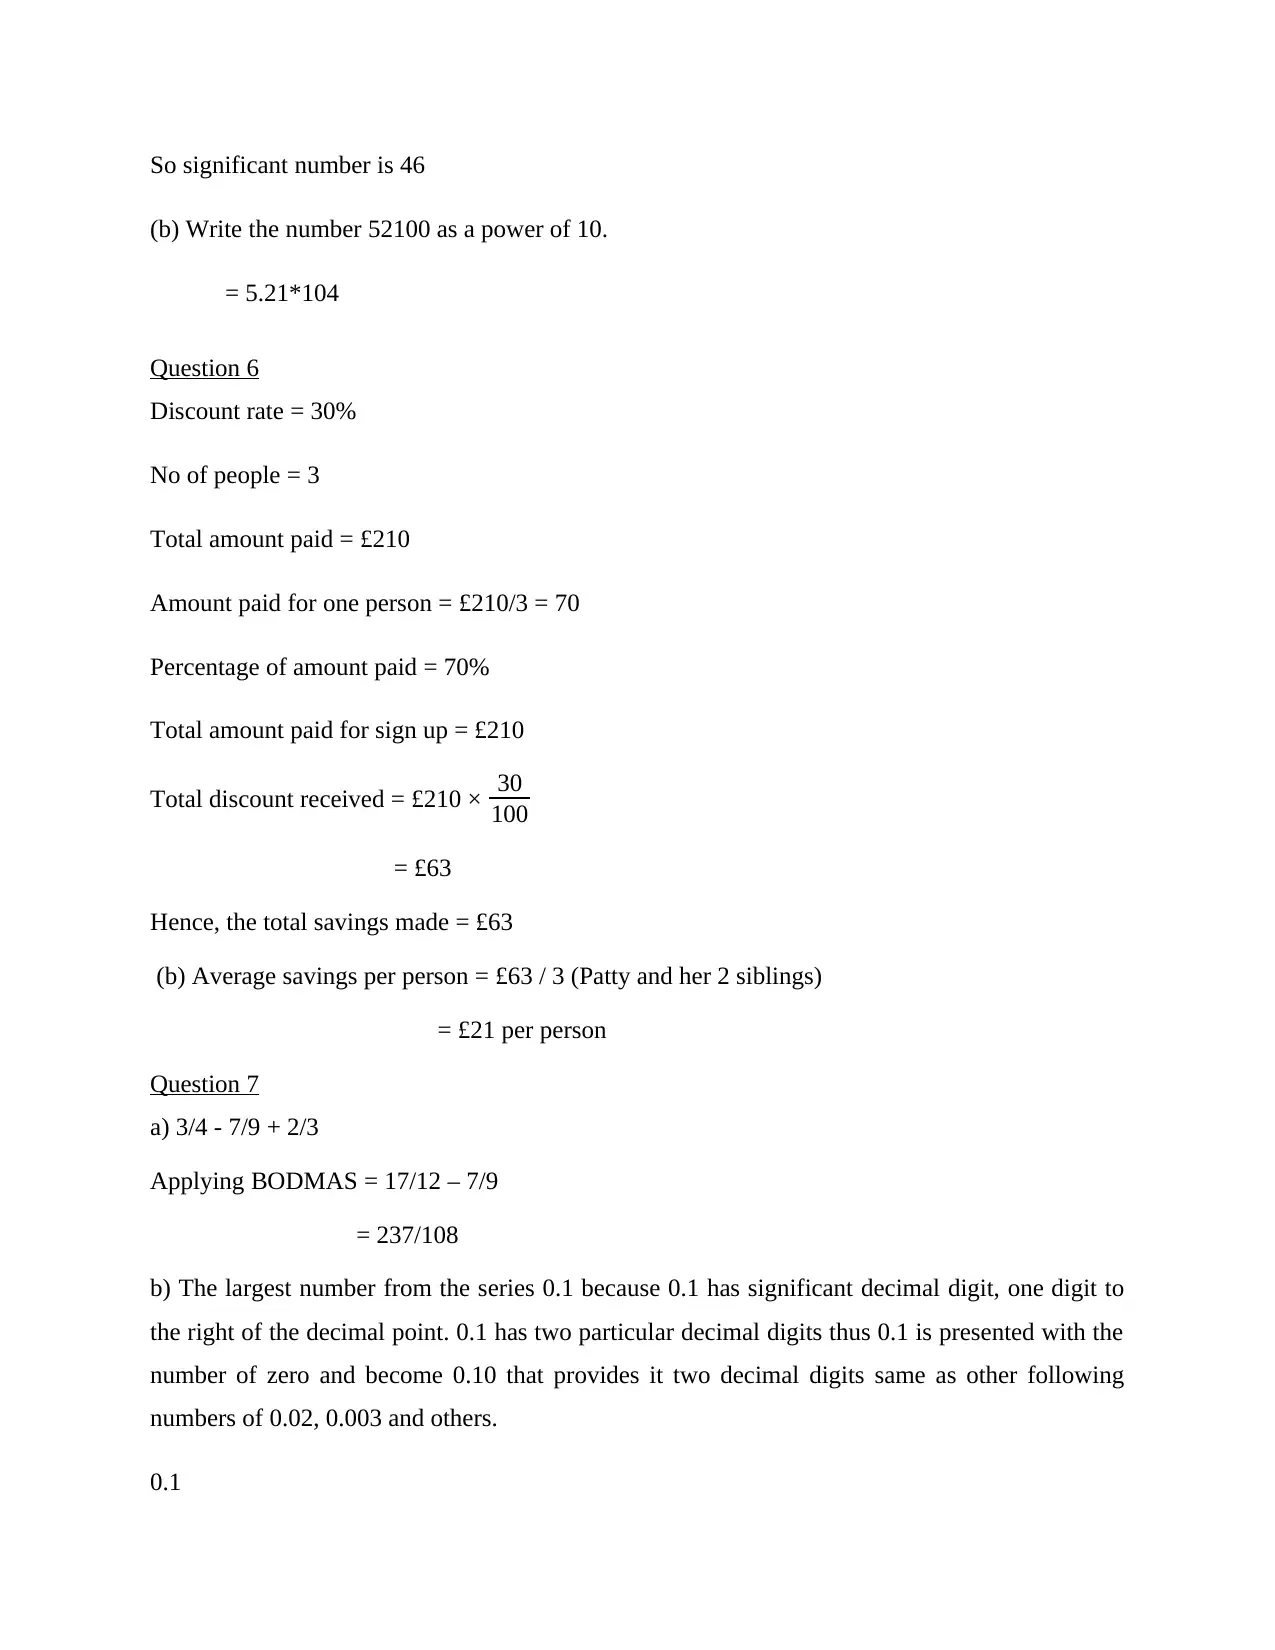
So significant number is 46
(b) Write the number 52100 as a power of 10.
= 5.21*104
Question 6
Discount rate = 30%
No of people = 3
Total amount paid = £210
Amount paid for one person = £210/3 = 70
Percentage of amount paid = 70%
Total amount paid for sign up = £210
Total discount received = £210 × 30
100
= £63
Hence, the total savings made = £63
(b) Average savings per person = £63 / 3 (Patty and her 2 siblings)
= £21 per person
Question 7
a) 3/4 - 7/9 + 2/3
Applying BODMAS = 17/12 – 7/9
= 237/108
b) The largest number from the series 0.1 because 0.1 has significant decimal digit, one digit to
the right of the decimal point. 0.1 has two particular decimal digits thus 0.1 is presented with the
number of zero and become 0.10 that provides it two decimal digits same as other following
numbers of 0.02, 0.003 and others.
0.1
⊘ This is a preview!⊘
Do you want full access?
Subscribe today to unlock all pages.
Trusted by 1+ million students worldwide
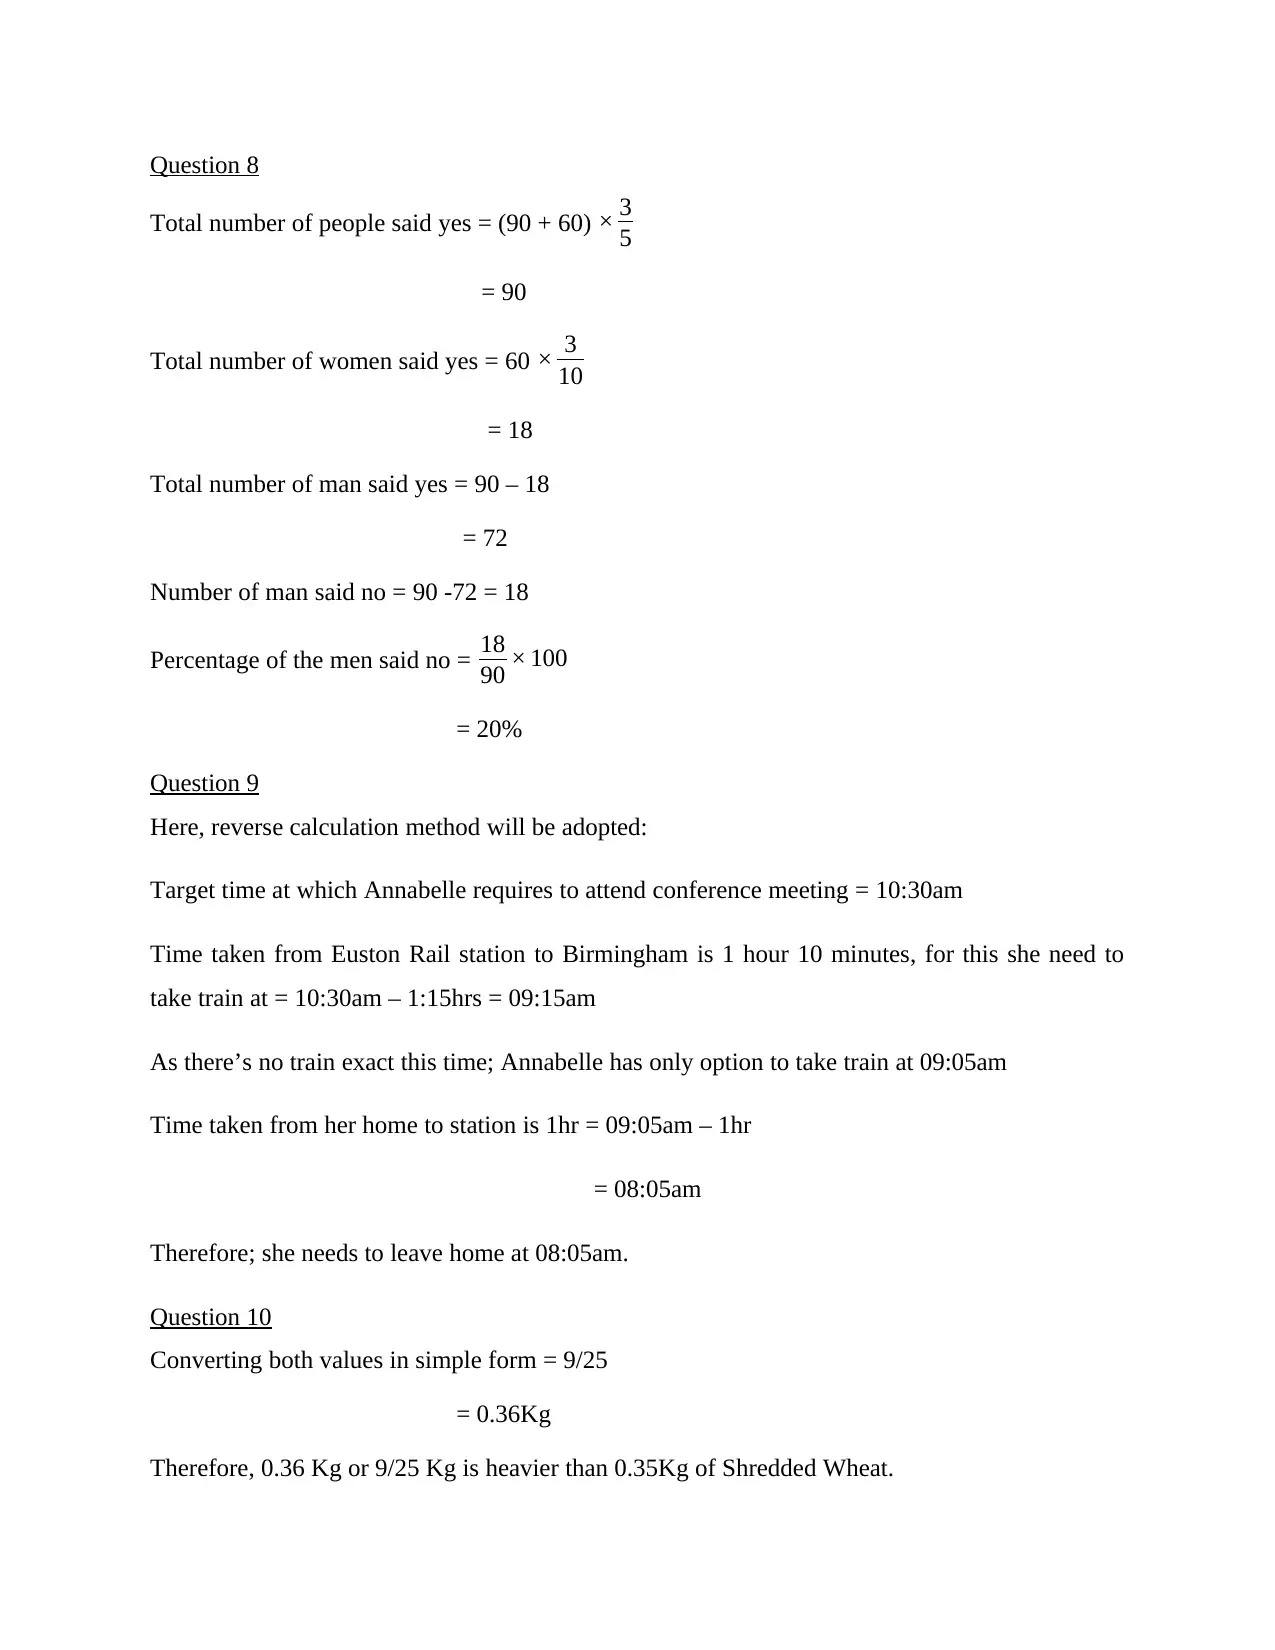
Question 8
Total number of people said yes = (90 + 60) × 3
5
= 90
Total number of women said yes = 60 × 3
10
= 18
Total number of man said yes = 90 – 18
= 72
Number of man said no = 90 -72 = 18
Percentage of the men said no = 18
90 × 100
= 20%
Question 9
Here, reverse calculation method will be adopted:
Target time at which Annabelle requires to attend conference meeting = 10:30am
Time taken from Euston Rail station to Birmingham is 1 hour 10 minutes, for this she need to
take train at = 10:30am – 1:15hrs = 09:15am
As there’s no train exact this time; Annabelle has only option to take train at 09:05am
Time taken from her home to station is 1hr = 09:05am – 1hr
= 08:05am
Therefore; she needs to leave home at 08:05am.
Question 10
Converting both values in simple form = 9/25
= 0.36Kg
Therefore, 0.36 Kg or 9/25 Kg is heavier than 0.35Kg of Shredded Wheat.
Paraphrase This Document
Need a fresh take? Get an instant paraphrase of this document with our AI Paraphraser
PART 2
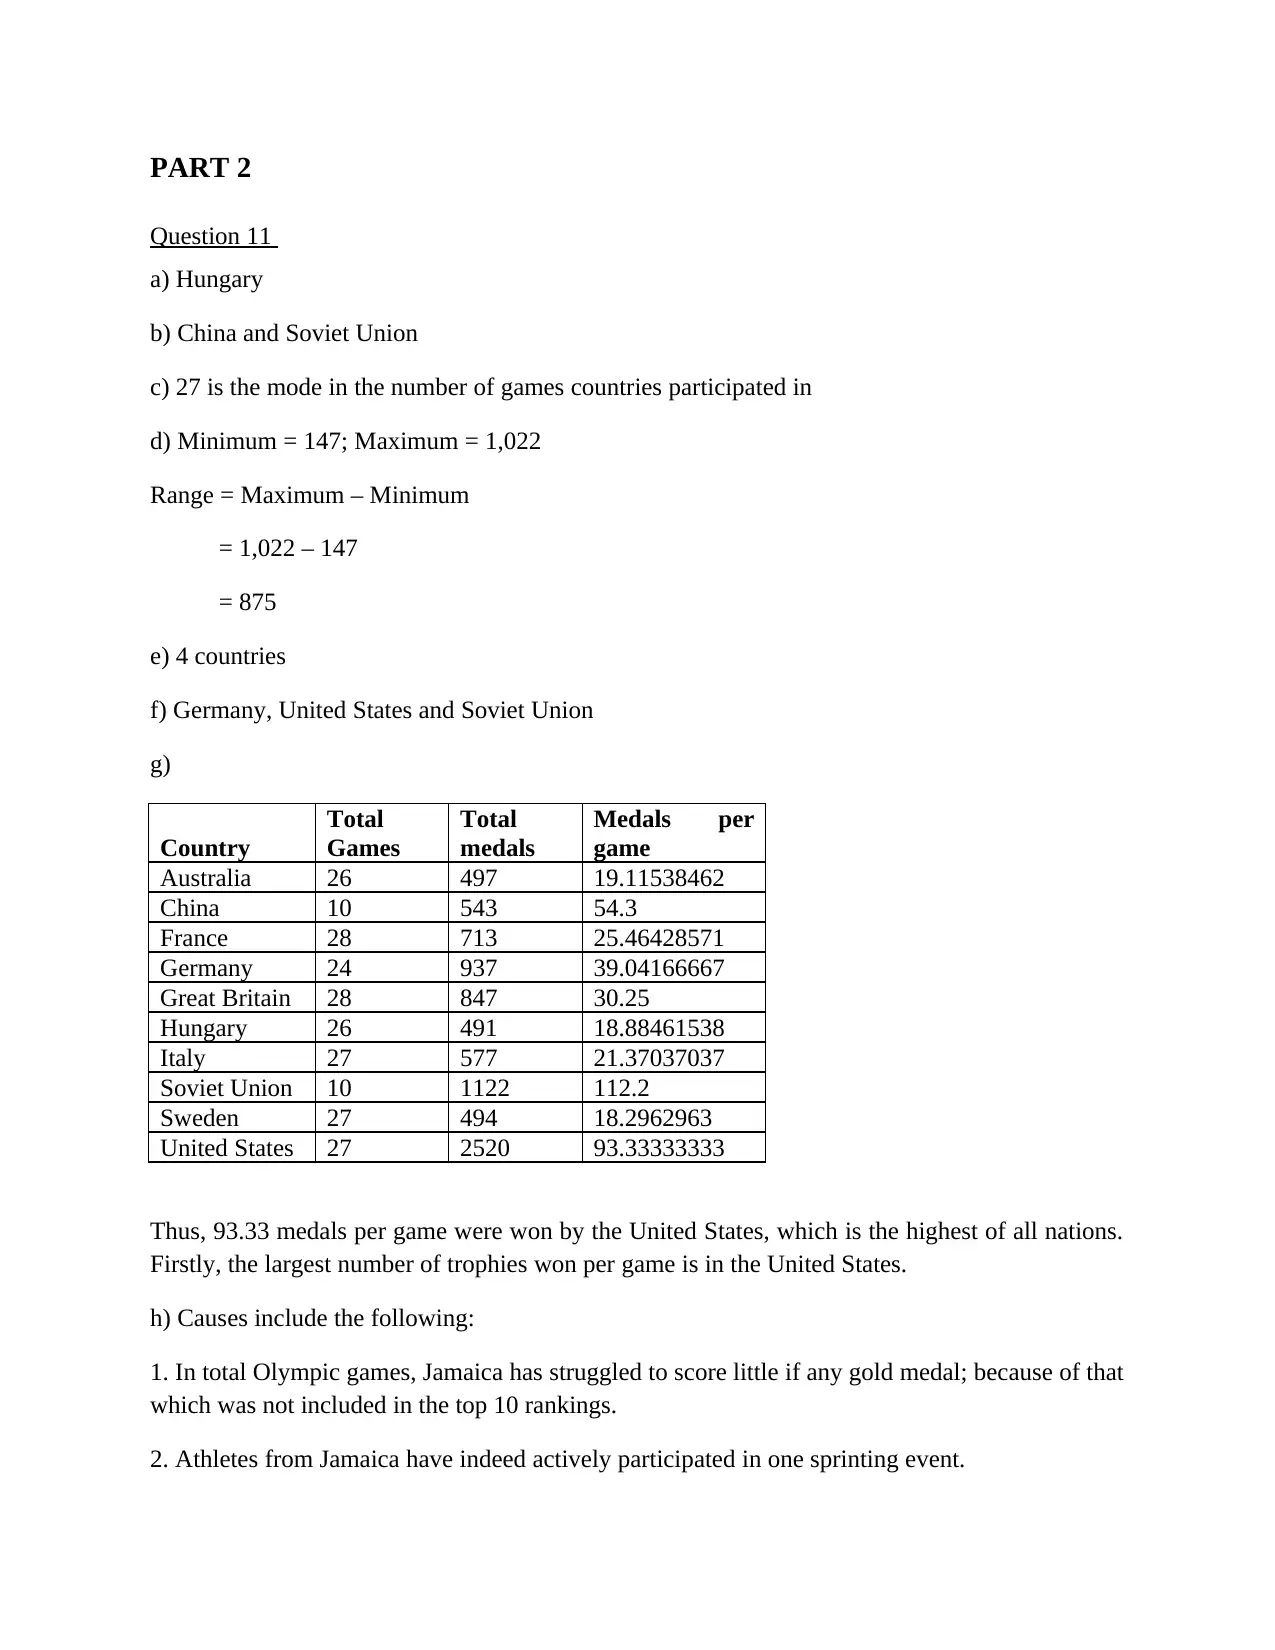
Question 11
a) Hungary
b) China and Soviet Union
c) 27 is the mode in the number of games countries participated in
d) Minimum = 147; Maximum = 1,022
Range = Maximum – Minimum
= 1,022 – 147
= 875
e) 4 countries
f) Germany, United States and Soviet Union
g)
Country
Total
Games
Total
medals
Medals per
game
Australia 26 497 19.11538462
China 10 543 54.3
France 28 713 25.46428571
Germany 24 937 39.04166667
Great Britain 28 847 30.25
Hungary 26 491 18.88461538
Italy 27 577 21.37037037
Soviet Union 10 1122 112.2
Sweden 27 494 18.2962963
United States 27 2520 93.33333333
Thus, 93.33 medals per game were won by the United States, which is the highest of all nations.
Firstly, the largest number of trophies won per game is in the United States.
h) Causes include the following:
1. In total Olympic games, Jamaica has struggled to score little if any gold medal; because of that
which was not included in the top 10 rankings.
2. Athletes from Jamaica have indeed actively participated in one sprinting event.
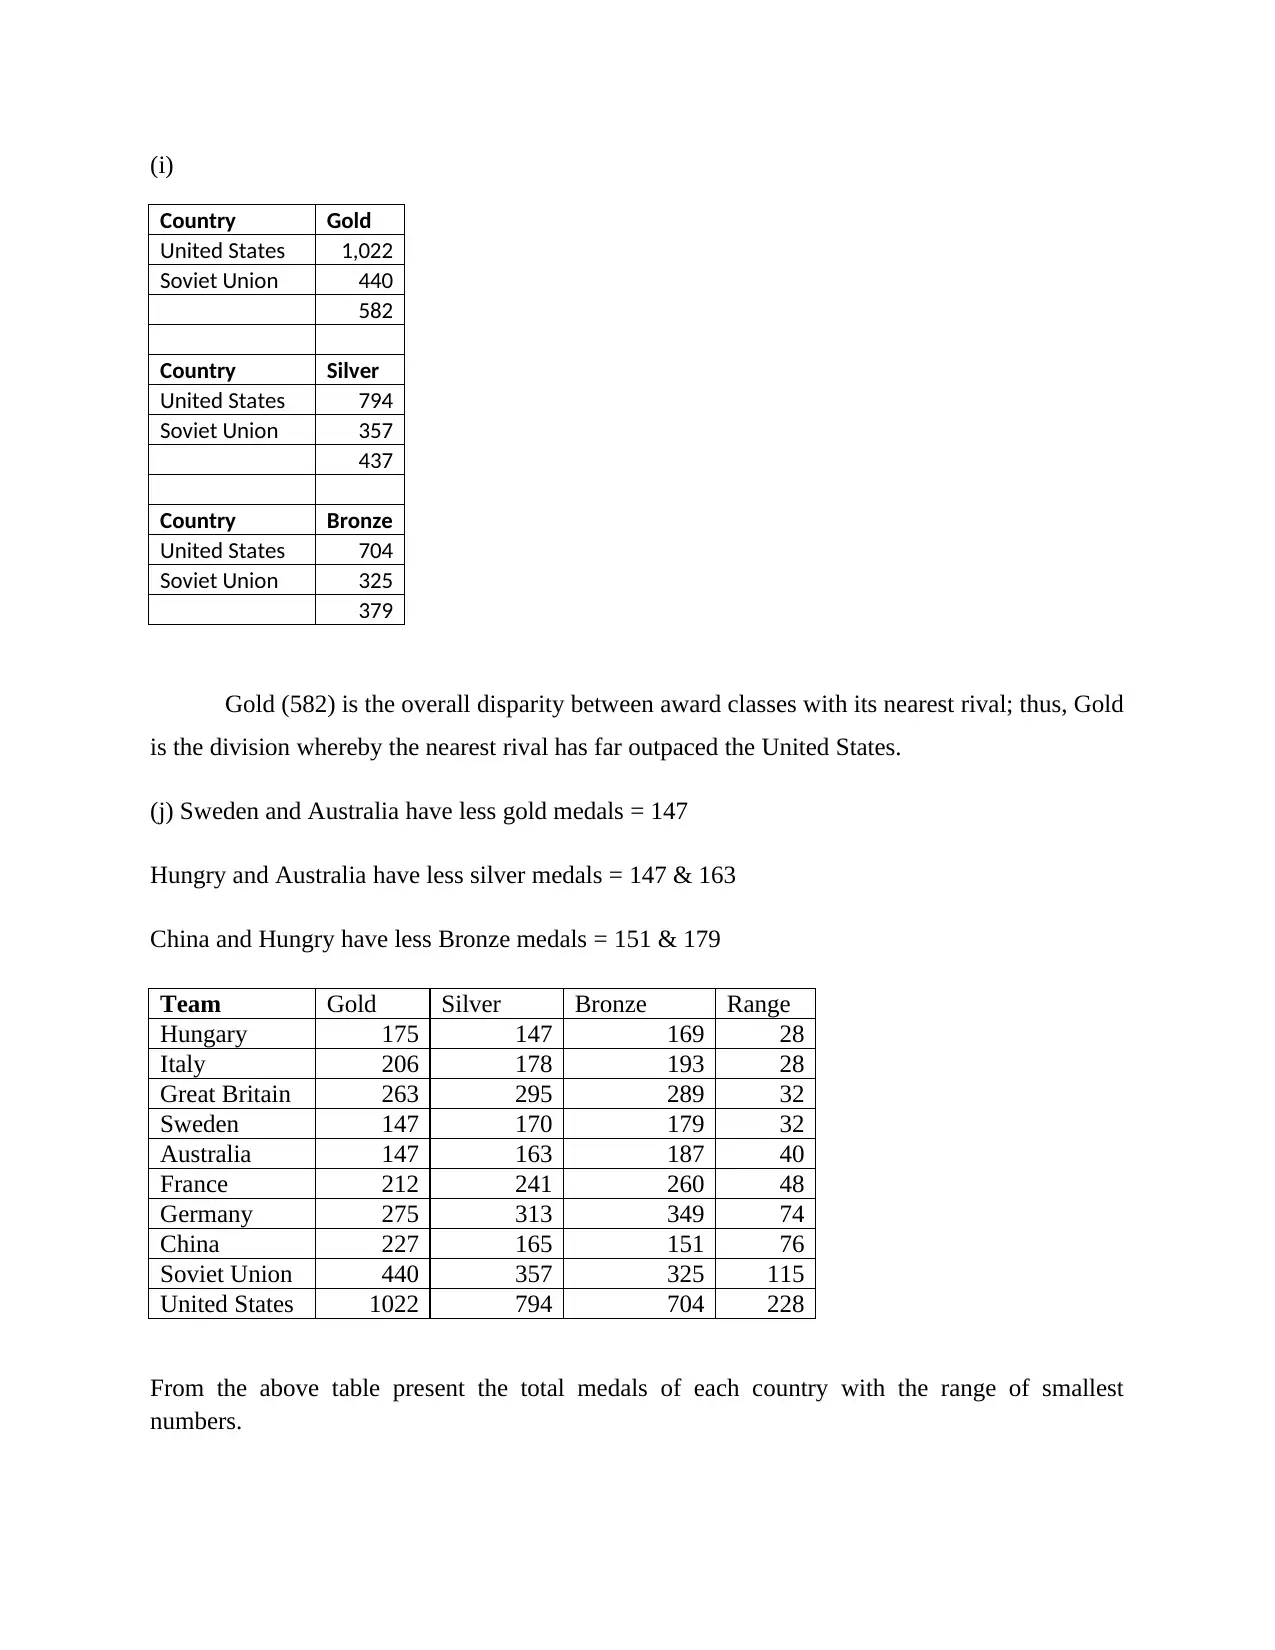
(i)
Country Gold
United States 1,022
Soviet Union 440
582
Country Silver
United States 794
Soviet Union 357
437
Country Bronze
United States 704
Soviet Union 325
379
Gold (582) is the overall disparity between award classes with its nearest rival; thus, Gold
is the division whereby the nearest rival has far outpaced the United States.
(j) Sweden and Australia have less gold medals = 147
Hungry and Australia have less silver medals = 147 & 163
China and Hungry have less Bronze medals = 151 & 179
Team Gold Silver Bronze Range
Hungary 175 147 169 28
Italy 206 178 193 28
Great Britain 263 295 289 32
Sweden 147 170 179 32
Australia 147 163 187 40
France 212 241 260 48
Germany 275 313 349 74
China 227 165 151 76
Soviet Union 440 357 325 115
United States 1022 794 704 228
From the above table present the total medals of each country with the range of smallest
numbers.
⊘ This is a preview!⊘
Do you want full access?
Subscribe today to unlock all pages.
Trusted by 1+ million students worldwide
PART 3
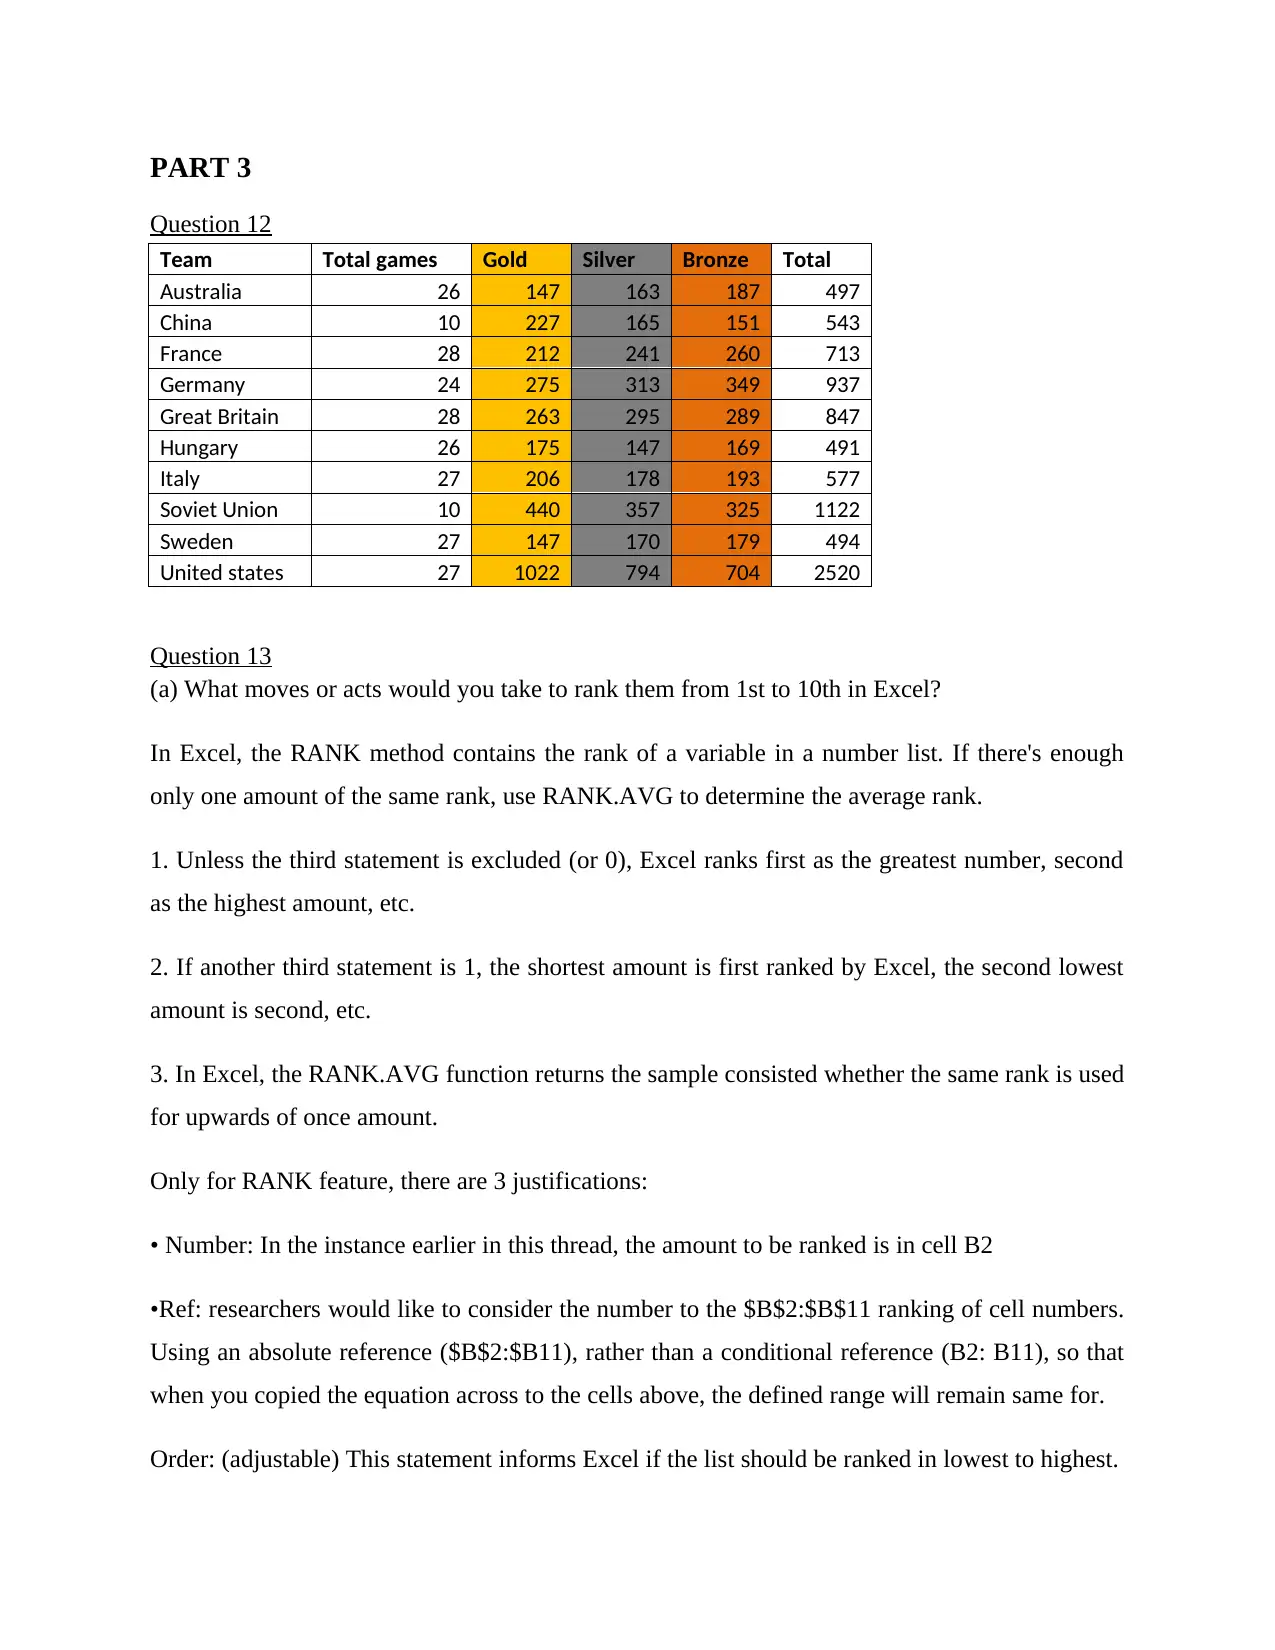
Question 12
Team Total games Gold Silver Bronze Total
Australia 26 147 163 187 497
China 10 227 165 151 543
France 28 212 241 260 713
Germany 24 275 313 349 937
Great Britain 28 263 295 289 847
Hungary 26 175 147 169 491
Italy 27 206 178 193 577
Soviet Union 10 440 357 325 1122
Sweden 27 147 170 179 494
United states 27 1022 794 704 2520
Question 13
(a) What moves or acts would you take to rank them from 1st to 10th in Excel?
In Excel, the RANK method contains the rank of a variable in a number list. If there's enough
only one amount of the same rank, use RANK.AVG to determine the average rank.
1. Unless the third statement is excluded (or 0), Excel ranks first as the greatest number, second
as the highest amount, etc.
2. If another third statement is 1, the shortest amount is first ranked by Excel, the second lowest
amount is second, etc.
3. In Excel, the RANK.AVG function returns the sample consisted whether the same rank is used
for upwards of once amount.
Only for RANK feature, there are 3 justifications:
• Number: In the instance earlier in this thread, the amount to be ranked is in cell B2
•Ref: researchers would like to consider the number to the $B$2:$B$11 ranking of cell numbers.
Using an absolute reference ($B$2:$B11), rather than a conditional reference (B2: B11), so that
when you copied the equation across to the cells above, the defined range will remain same for.
Order: (adjustable) This statement informs Excel if the list should be ranked in lowest to highest.
Paraphrase This Document
Need a fresh take? Get an instant paraphrase of this document with our AI Paraphraser
To seek the rank in the chart in increasing order, use zero, or leaving this statement blank.
The rank claim was ignored entirely in the instance before, to seek the rank in descending
order.
(B2,$B$2:$B$11) = RANK
Form a 1, and any other number but zero, for ascending order.
You might type a 1, to rank in ascending order, if you were contrasting golf scores.
The = RANK(B2,$B$2:$B$11,1)
The 3rd statement (order) is unspecified in the RANK function. The command claim informs
Excel whether the list should be ranked in ascending or descending.
When you use zero as the ordering structure, or if the 3rd argument is not used, the rank is
defined in descending order.
A rank of 1 gets the highest number
The tenth largest number is ranked at 10.
If you use a 1 as the ordering framework, or if you insert as the 3rd argument any
quantity but zero, the rank is set in decreasing order.
A rank of 1 receives the shortest distance
A rank of 10 receives the 10th lowest amount.
Using a cell guide to construct a versatile equation, rather than entering the order
statement amount into a RANK method.
For illustration, in cell E1, type a 1, but for the ordering statement, connect to cell E1.
You can easily see higher capacity by connecting to a cell, while changing the design. In cell E1,
type a zero or remove the amount, and the rank changes to Descending Order.
There are only 2 options for the order option-ascending or descending. Using a checkboxes to
switch the Ascending Order ON or OFF to make it easier for people to change the structure.
Whether it is ON, the order of the RANK is Ascending.
If it is switched OFF, the descending order of the RANK will be
B) In Excel, define the particular corrective action) or step(s) that will create a list / display of
those countries with a total of 800 or more medals?
Conditional formatting makes it much easier through using information labels, colour scales, and
symbol collections which conform to unique differences in the data to identify unique cells or
groups of cells, identify mysteriously, and visualize data. Depending on the circumstances that
you define, a conditional format affects the color of cells. The cell range is configured unless the
statements are met; unless the conditions are incorrect, the range of cells is not configured. There
are several built-in requirements, and you can build your own as well (such as when using a True
or False assessment method).To implement this practice, the Excel method is contingent
formatting, which can imagine values below 800 by showing them as different colours. The steps
for getting the answer below provide:
Support these measures to establish this fundamental configuration rule:
1. Select a particular modules in your normal range (in this case, cells C3: C14), click the Excel
Ribbon 's Home tab, and afterwards click Conditional Formatting as a new rule. A options dialog
box with the New Configuration Rule.
2. Press the Use Formula to Decide Increasing Cells to Format choice in the list box on the right
of the dialogue box. This subset examines the meanings accordance with the study definition. If
TRUE is evaluated by a specific value, the conditional specification is transferred to that cell.
3. Access the calculation presented here in the calculation box that appears. Remember that the
first cell in the goal range is literally referenced by you. It's not necessary for you to search the
full portfolio.
4. Press the button on Format. This triggers the utilizing existing dialogue box, which provides
you with a full range of font, border, and fill advanced settings for your cell nucleus. After
determining your formatting choices have been accomplished, click “Ok” to approve your
modifications and navigate to the New Formatting Rule dialogue.
(c) Line graph or bar graph is more suitable in representing gold medal information
⊘ This is a preview!⊘
Do you want full access?
Subscribe today to unlock all pages.
Trusted by 1+ million students worldwide
1 out of 19
Related Documents


Your All-in-One AI-Powered Toolkit for Academic Success.
+13062052269
info@desklib.com
Available 24*7 on WhatsApp / Email
![[object Object]](/_next/static/media/star-bottom.7253800d.svg)
Unlock your academic potential
Copyright © 2020–2026 A2Z Services. All Rights Reserved. Developed and managed by ZUCOL.