Data Analysis and Information Management Project Report - Semester 1
VerifiedAdded on 2022/12/19
|12
|1063
|51
Project
AI Summary
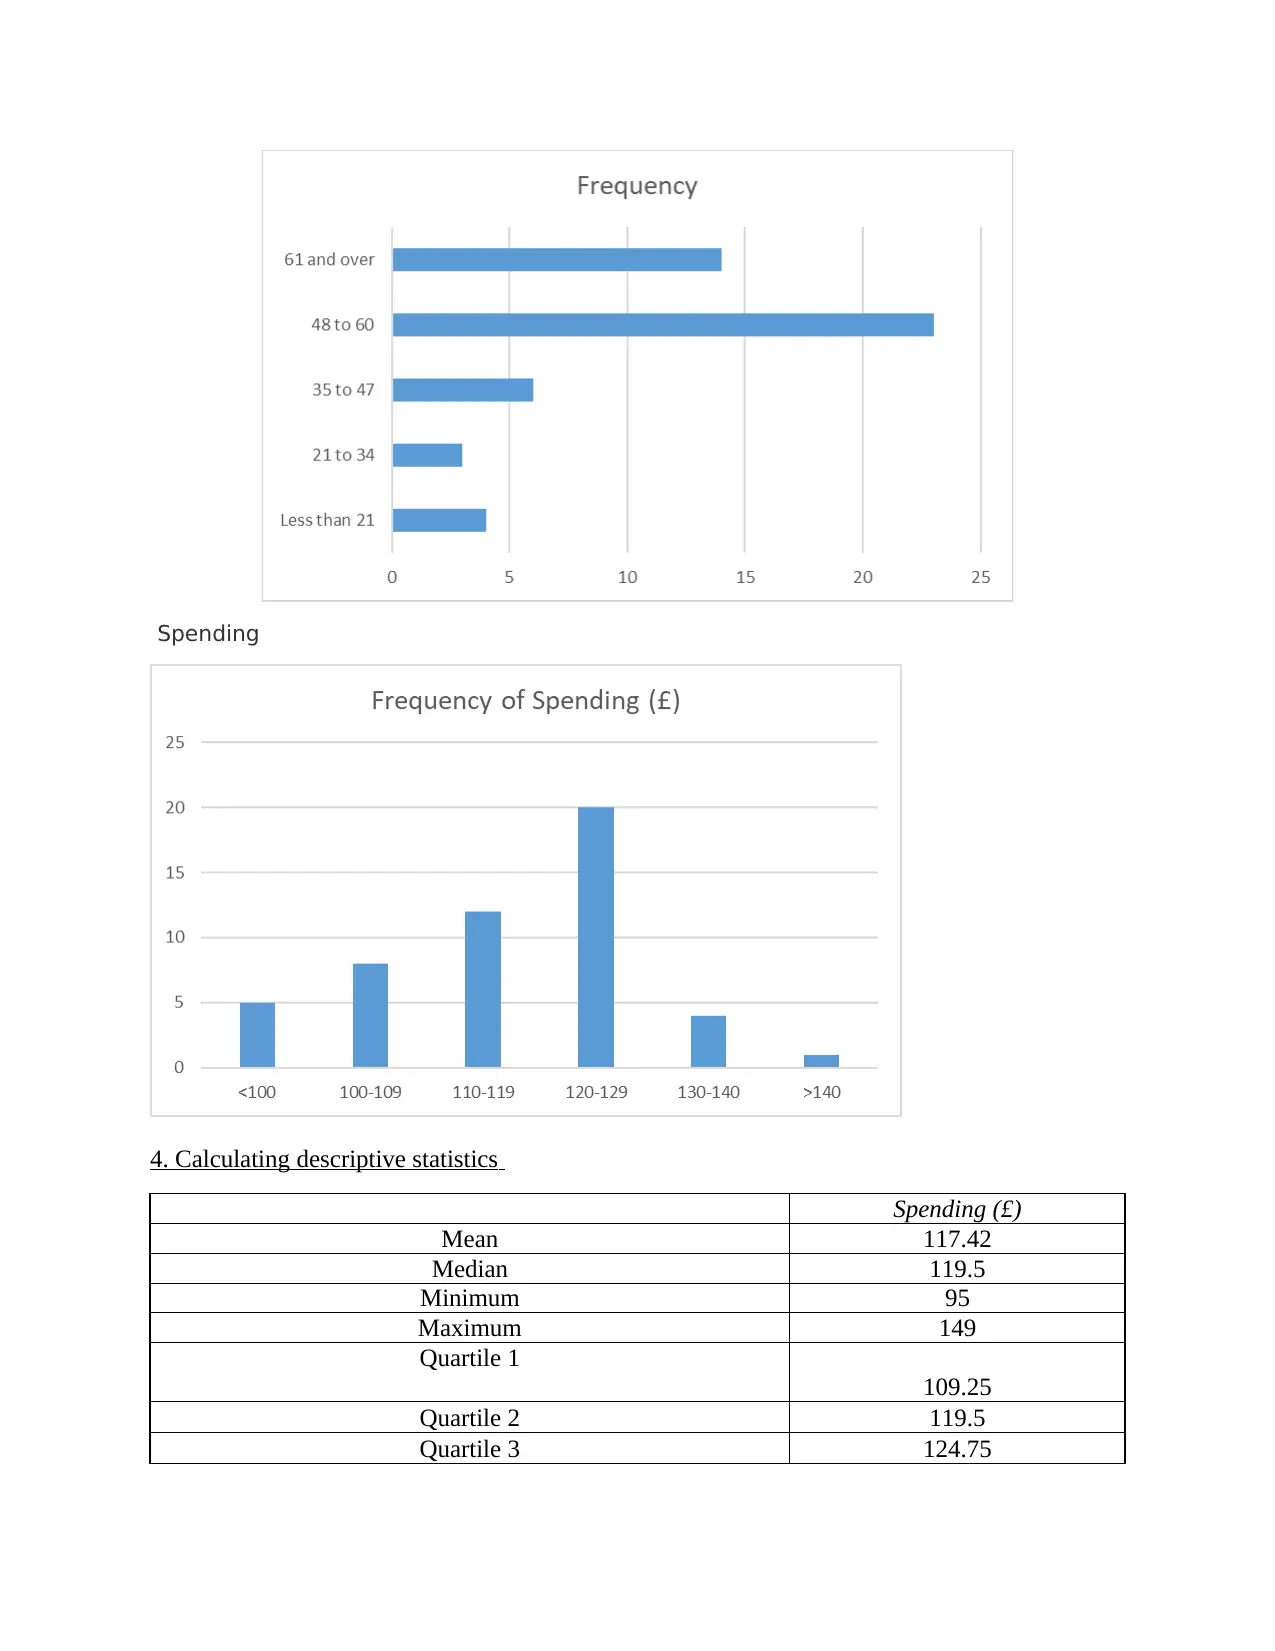
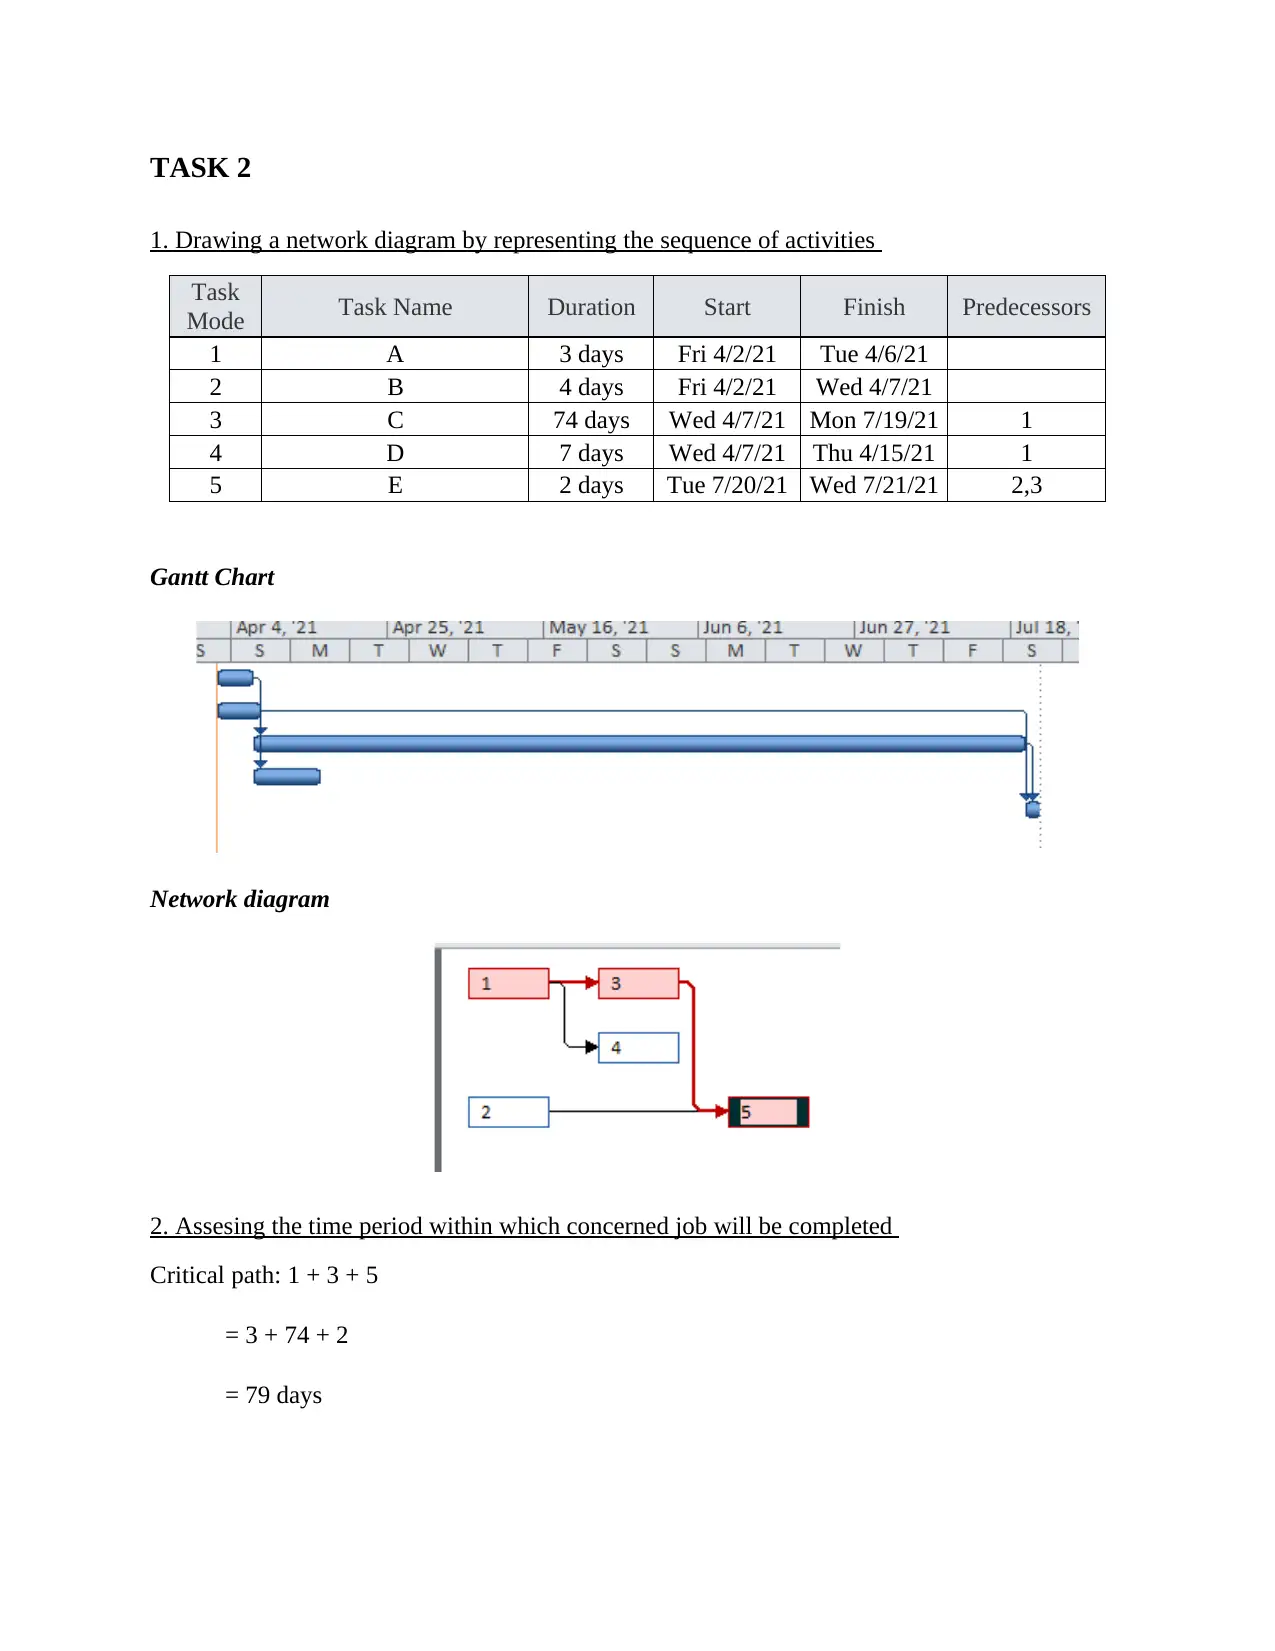
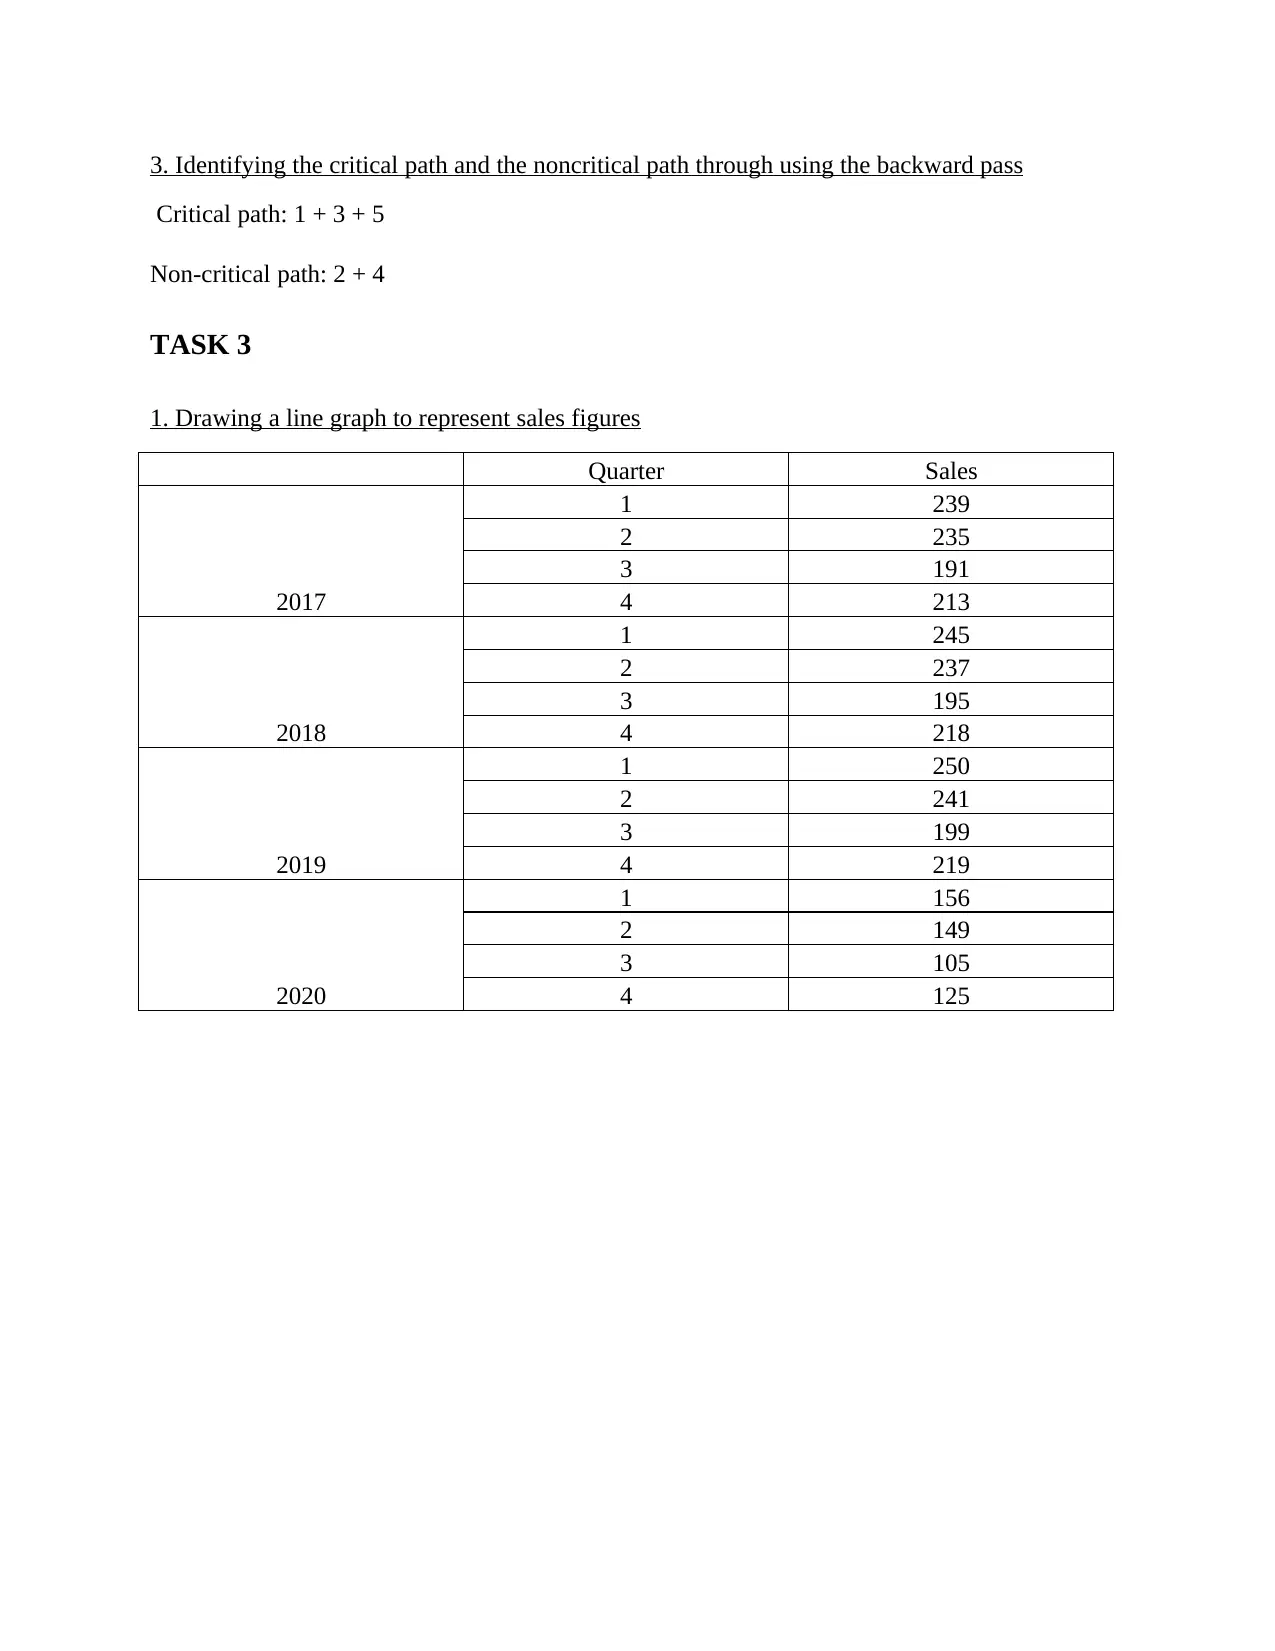
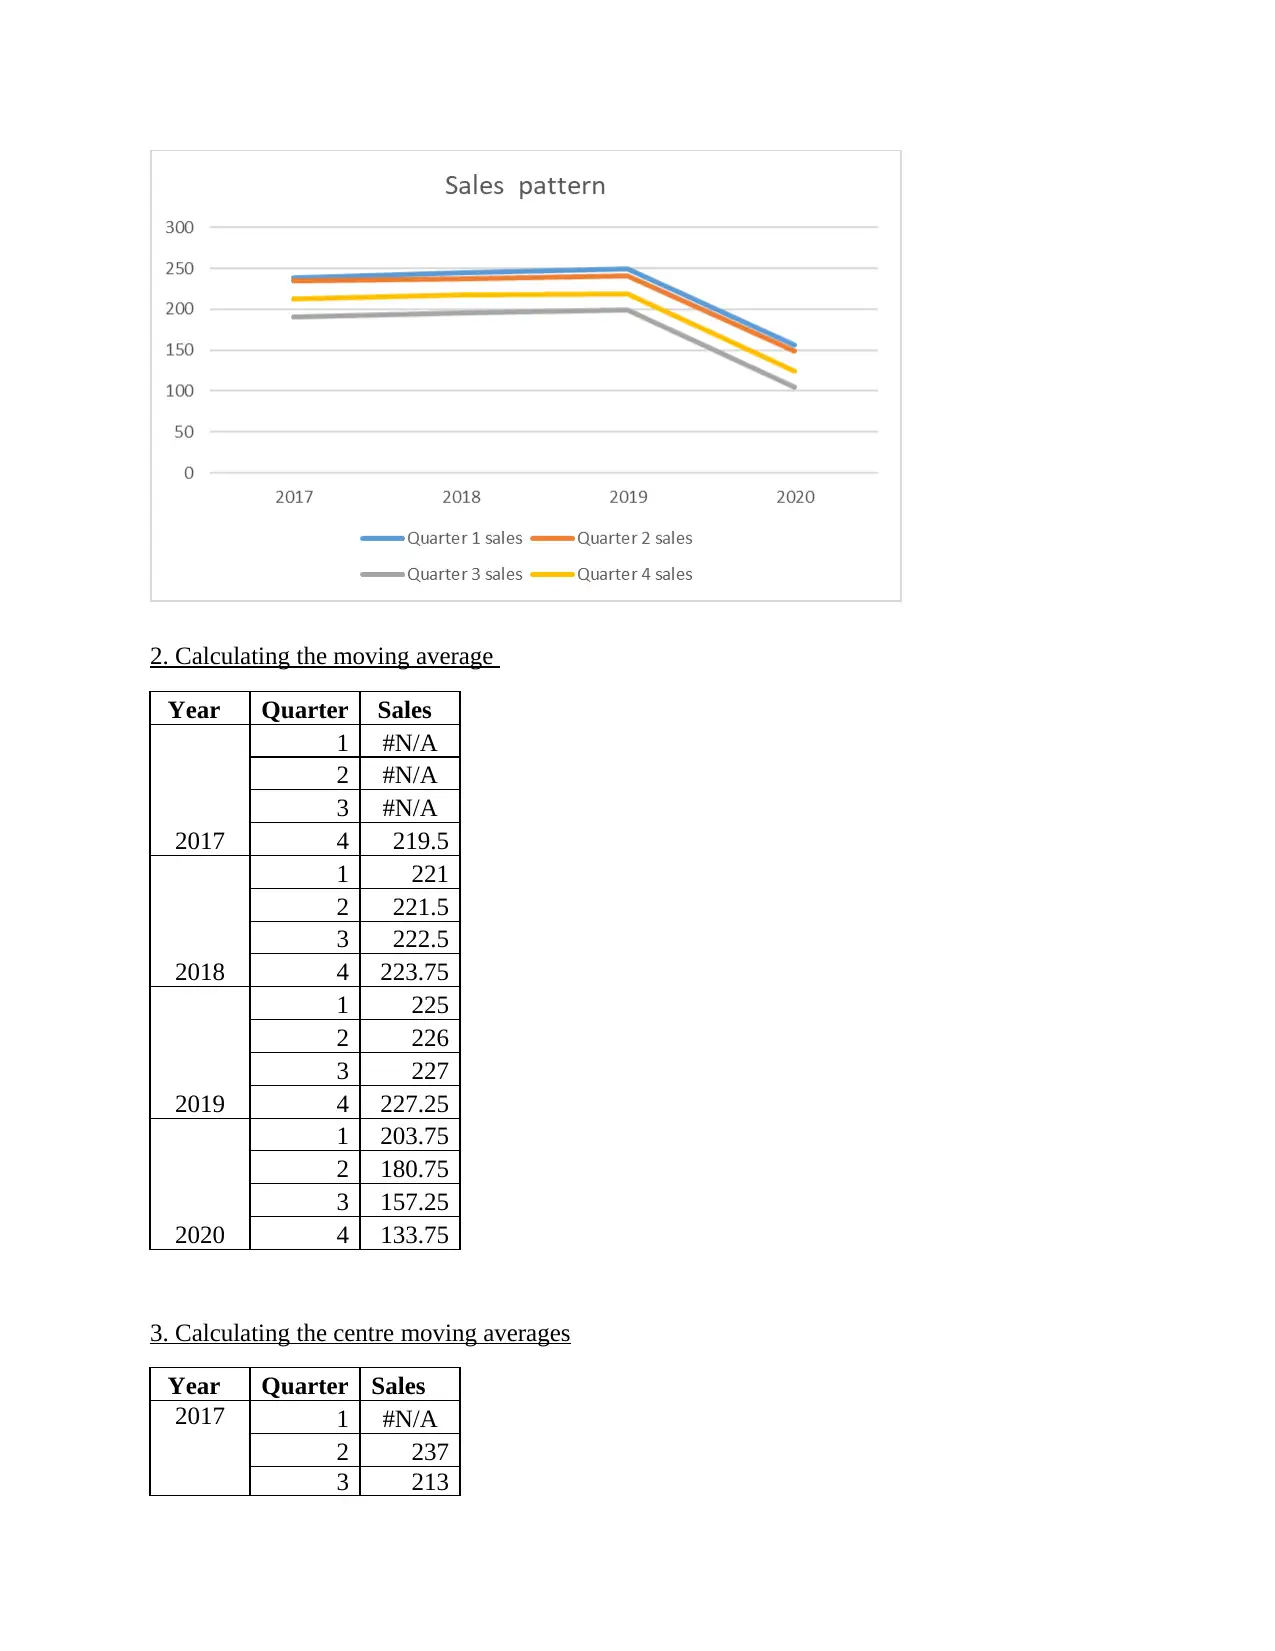
This project encompasses a comprehensive analysis of data and information management techniques. Task 1 focuses on data labeling, frequency analysis, graphical representations, and descriptive statistics calculation. Task 2 involves network diagram creation, time period assessment, and critical p...

Using and Managing Data and Information
Secure Best Marks with AI Grader
Need help grading? Try our AI Grader for instant feedback on your assignments.

TABLE OF CONTENTS
TASK 1............................................................................................................................................3
1. Label the codes for the categories...........................................................................................3
2. Producing frequency and % frequency of tables.....................................................................4
3. Drawing the graphical presentation for each variable.............................................................5
4. Calculating descriptive statistics..............................................................................................6
TASK 2............................................................................................................................................6
1. Drawing a network diagram by representing the sequence of activities.................................6
2. Assesing the time period within which concerned job will be completed..............................7
3. Identifying the critical path and the noncritical path through using the backward pass..........7
TASK 3............................................................................................................................................7
1. Drawing a line graph to represent sales figures.......................................................................7
2. Calculating the moving average..............................................................................................8
3. Calculating the centre moving averages..................................................................................9
4. Presenting the original sales data and the trend of sales figures............................................10
TASK 4..........................................................................................................................................10
Building a tree diagram to show the probabilities of a Salesperson being selected..................10
TASK 5..........................................................................................................................................11
Applying linear programming for solving concerned problem.................................................11

TASK 1
1. Label the codes for the categories
Gender
Particulars Labels
1 Male
2 Female
3 Prefer not to say
Age
Particulars Labels
1 Less than 21
2 21 to 34
3 35 to 47
4 48 to 60
5 61 and over
Education
Particulars Labels
1 GCSE or below
2 A’ level or Diploma
3 Degree or further
1. Label the codes for the categories
Gender
Particulars Labels
1 Male
2 Female
3 Prefer not to say
Age
Particulars Labels
1 Less than 21
2 21 to 34
3 35 to 47
4 48 to 60
5 61 and over
Education
Particulars Labels
1 GCSE or below
2 A’ level or Diploma
3 Degree or further

Are you a regular user of self-checkout?
Particulars Labels
1 Yes
2 No
2. Producing frequency and % frequency of tables
Gender
Particulars Frequency % of Frequency
Male 20 40%
Female 29 58%
Prefer not to say 1 2%
Total 50 100%
Education
Particulars Frequency % of Frequency
GCSE or below 13 26%
A’ level or Diploma 18 36%
Degree or further 19 38%
Total 50 100%
Age
Particulars Frequency % of Frequency
Less than 21 4 8%
21 to 34 3 6%
35 to 47 6 12%
48 to 60 23 46%
61 and over 14 28%
Total 50 100%
Secure Best Marks with AI Grader
Need help grading? Try our AI Grader for instant feedback on your assignments.

SCC user
Particulars Frequency % of Frequency
Yes 15 30%
No 35 70%
Total 50
Spending
Particulars Frequency of Spending (£) % of Frequency
<100 5 10%
100-109 8 16%
110-119 12 24%
120-129 20 40%
130-140 4 8%
>140 1 2%
Total 50 100%
3. Drawing the graphical presentation for each variable
Education
Age
Particulars Frequency % of Frequency
Yes 15 30%
No 35 70%
Total 50
Spending
Particulars Frequency of Spending (£) % of Frequency
<100 5 10%
100-109 8 16%
110-119 12 24%
120-129 20 40%
130-140 4 8%
>140 1 2%
Total 50 100%
3. Drawing the graphical presentation for each variable
Education
Age

Spending
4. Calculating descriptive statistics
Spending (£)
Mean 117.42
Median 119.5
Minimum 95
Maximum 149
Quartile 1
109.25
Quartile 2 119.5
Quartile 3 124.75
4. Calculating descriptive statistics
Spending (£)
Mean 117.42
Median 119.5
Minimum 95
Maximum 149
Quartile 1
109.25
Quartile 2 119.5
Quartile 3 124.75

TASK 2
1. Drawing a network diagram by representing the sequence of activities
Task
Mode Task Name Duration Start Finish Predecessors
1 A 3 days Fri 4/2/21 Tue 4/6/21
2 B 4 days Fri 4/2/21 Wed 4/7/21
3 C 74 days Wed 4/7/21 Mon 7/19/21 1
4 D 7 days Wed 4/7/21 Thu 4/15/21 1
5 E 2 days Tue 7/20/21 Wed 7/21/21 2,3
Gantt Chart
Network diagram
2. Assesing the time period within which concerned job will be completed
Critical path: 1 + 3 + 5
= 3 + 74 + 2
= 79 days
Paraphrase This Document
Need a fresh take? Get an instant paraphrase of this document with our AI Paraphraser

3. Identifying the critical path and the noncritical path through using the backward pass
Critical path: 1 + 3 + 5
Non-critical path: 2 + 4
TASK 3
1. Drawing a line graph to represent sales figures
Quarter Sales
2017
1 239
2 235
3 191
4 213
2018
1 245
2 237
3 195
4 218
2019
1 250
2 241
3 199
4 219
2020
1 156
2 149
3 105
4 125
Critical path: 1 + 3 + 5
Non-critical path: 2 + 4
TASK 3
1. Drawing a line graph to represent sales figures
Quarter Sales
2017
1 239
2 235
3 191
4 213
2018
1 245
2 237
3 195
4 218
2019
1 250
2 241
3 199
4 219
2020
1 156
2 149
3 105
4 125

2. Calculating the moving average
Year Quarter Sales
2017
1 #N/A
2 #N/A
3 #N/A
4 219.5
2018
1 221
2 221.5
3 222.5
4 223.75
2019
1 225
2 226
3 227
4 227.25
2020
1 203.75
2 180.75
3 157.25
4 133.75
3. Calculating the centre moving averages
Year Quarter Sales
2017 1 #N/A
2 237
3 213
Year Quarter Sales
2017
1 #N/A
2 #N/A
3 #N/A
4 219.5
2018
1 221
2 221.5
3 222.5
4 223.75
2019
1 225
2 226
3 227
4 227.25
2020
1 203.75
2 180.75
3 157.25
4 133.75
3. Calculating the centre moving averages
Year Quarter Sales
2017 1 #N/A
2 237
3 213

4 202
2018
1 229
2 241
3 216
4 206.5
2019
1 234
2 245.5
3 220
4 209
2020
1 187.5
2 152.5
3 127
4 115
4. Presenting the original sales data and the trend of sales figures
TASK 4
Building a tree diagram to show the probabilities of a Salesperson being selected
Let A be Sam, B be Alex.
P(Sam chooses Salesperson) = P(A) = 0.5
P(Alex chooses Salesperson ) = P(B) = 0.3
Secure Best Marks with AI Grader
Need help grading? Try our AI Grader for instant feedback on your assignments.

P(Salesperson chosen by both) = P(A and B) = 0 as only one manager works in a day.
P(A OR B) = P(A) + P(B) – P(A and B) = 0.5 + 0.3 – 0 = 0.8
Therefore, the probability that salesperson selected either by A or B is 0.8.
It is given that manager Sam has worked for 6 days and while manager Sam worked for 4
days in the last 10 days. Therefore, by multiplying number of days with the probability of being
selected P(S) and probability of not selected P(NS). The probability of salesperson being selected
by Sam is greater than Alex.
TASK 5
Applying linear programming for solving concerned problem
Brie Goude Total Profit
Production quantity 12 0

Unit profits 5 4 60
Constraints Production Requirements per Unit Used Available
Milk 1.8 1.2 21.6 120
Salt 100
15
0 1200 1200
Cell Name
Original
Value
Final
Value
$E$4 Unit profits Total Profit 60 60
Cell Name
Original
Value
Final
Value Integer
$C$3 Production quantity Brie 12 12 Contin
$D$3 Production quantity Goude 0 0 Contin
Cell Name Cell Value Formula Status Slack
$E$7 Milk Used 21.6 $E$7<=$F$7
Not
Binding 98.4
$E$8 Salt Used 1200 $E$8<=$F$8 Binding 0
1 out of 12
Related Documents

Your All-in-One AI-Powered Toolkit for Academic Success.
+13062052269
info@desklib.com
Available 24*7 on WhatsApp / Email
Unlock your academic potential
© 2024 | Zucol Services PVT LTD | All rights reserved.