Data Management Assignment: Confidence Intervals and Sample Size

Verified

Added on  2022/12/27

|3
|408
|71
Homework Assignment
AI Summary
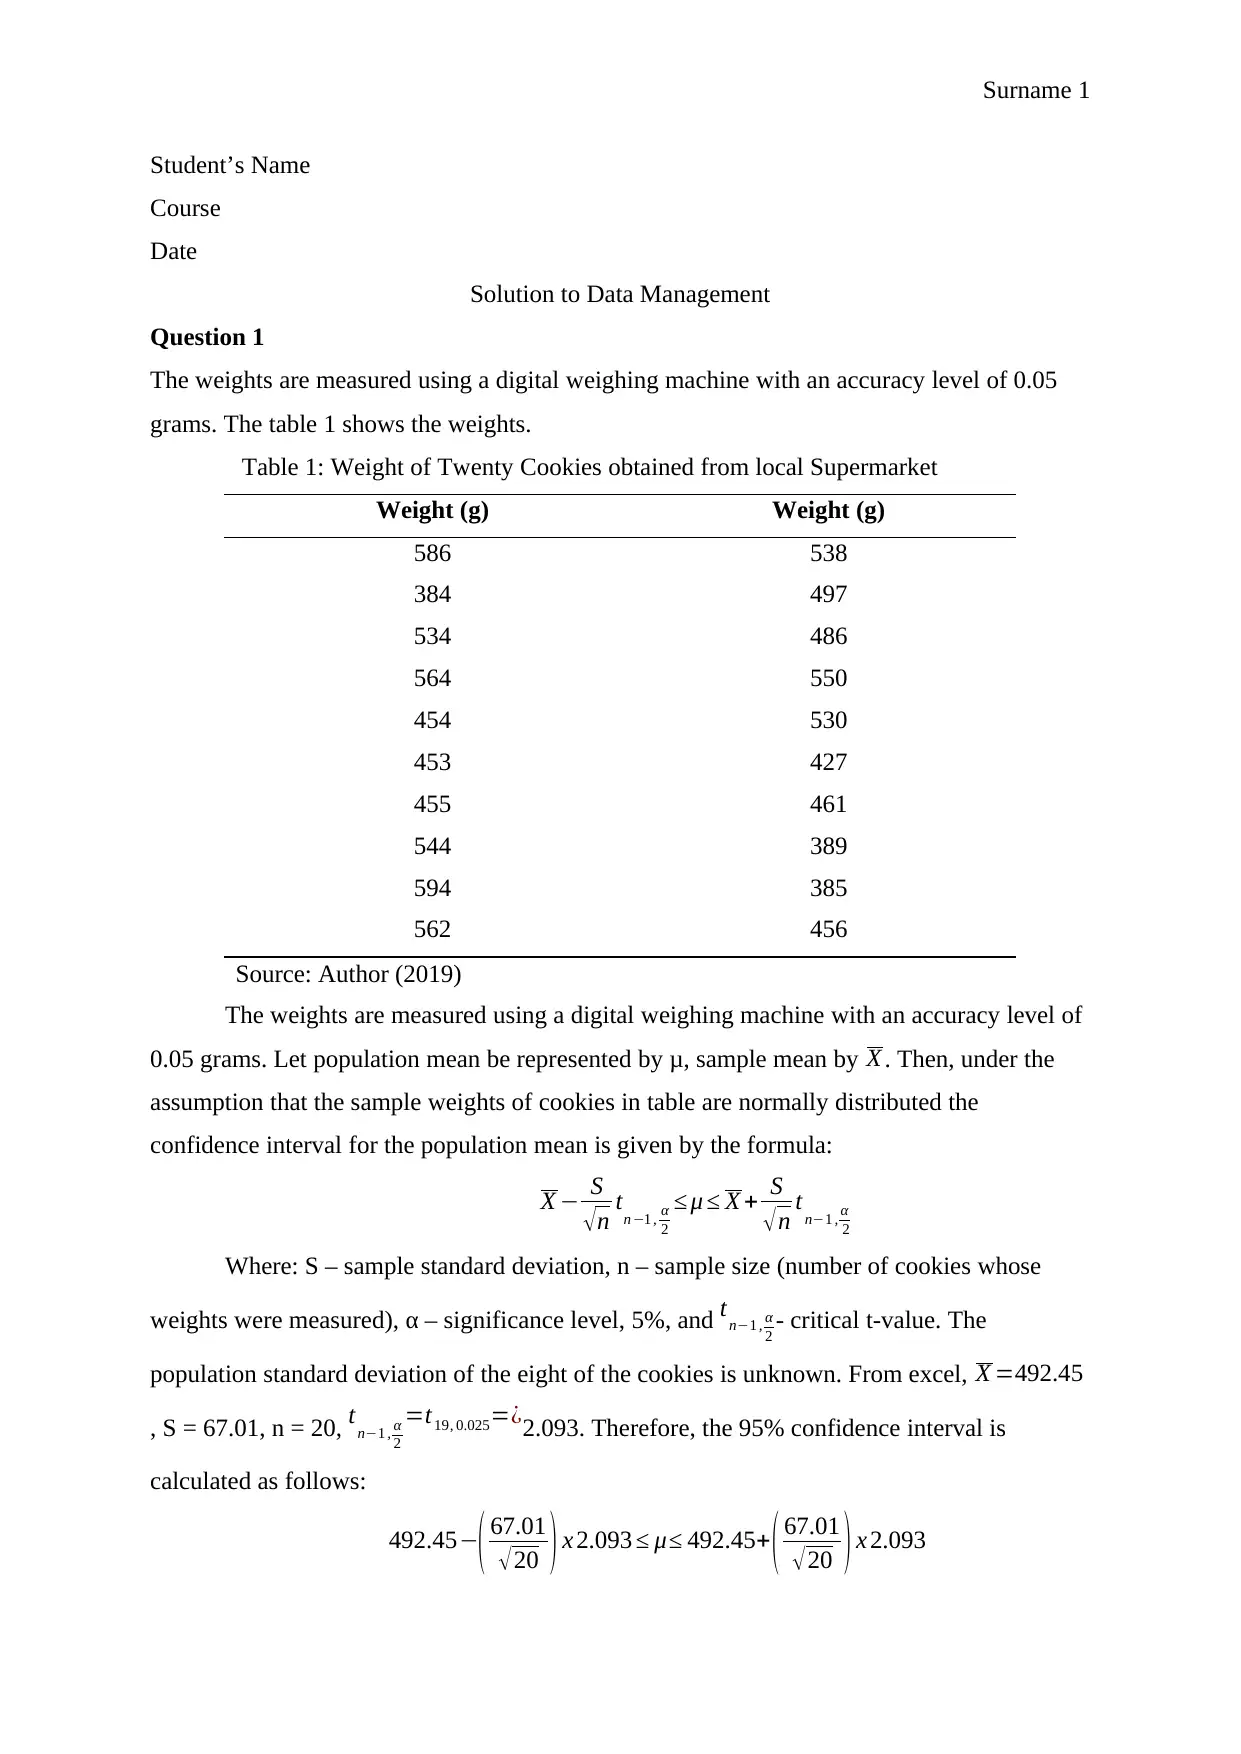
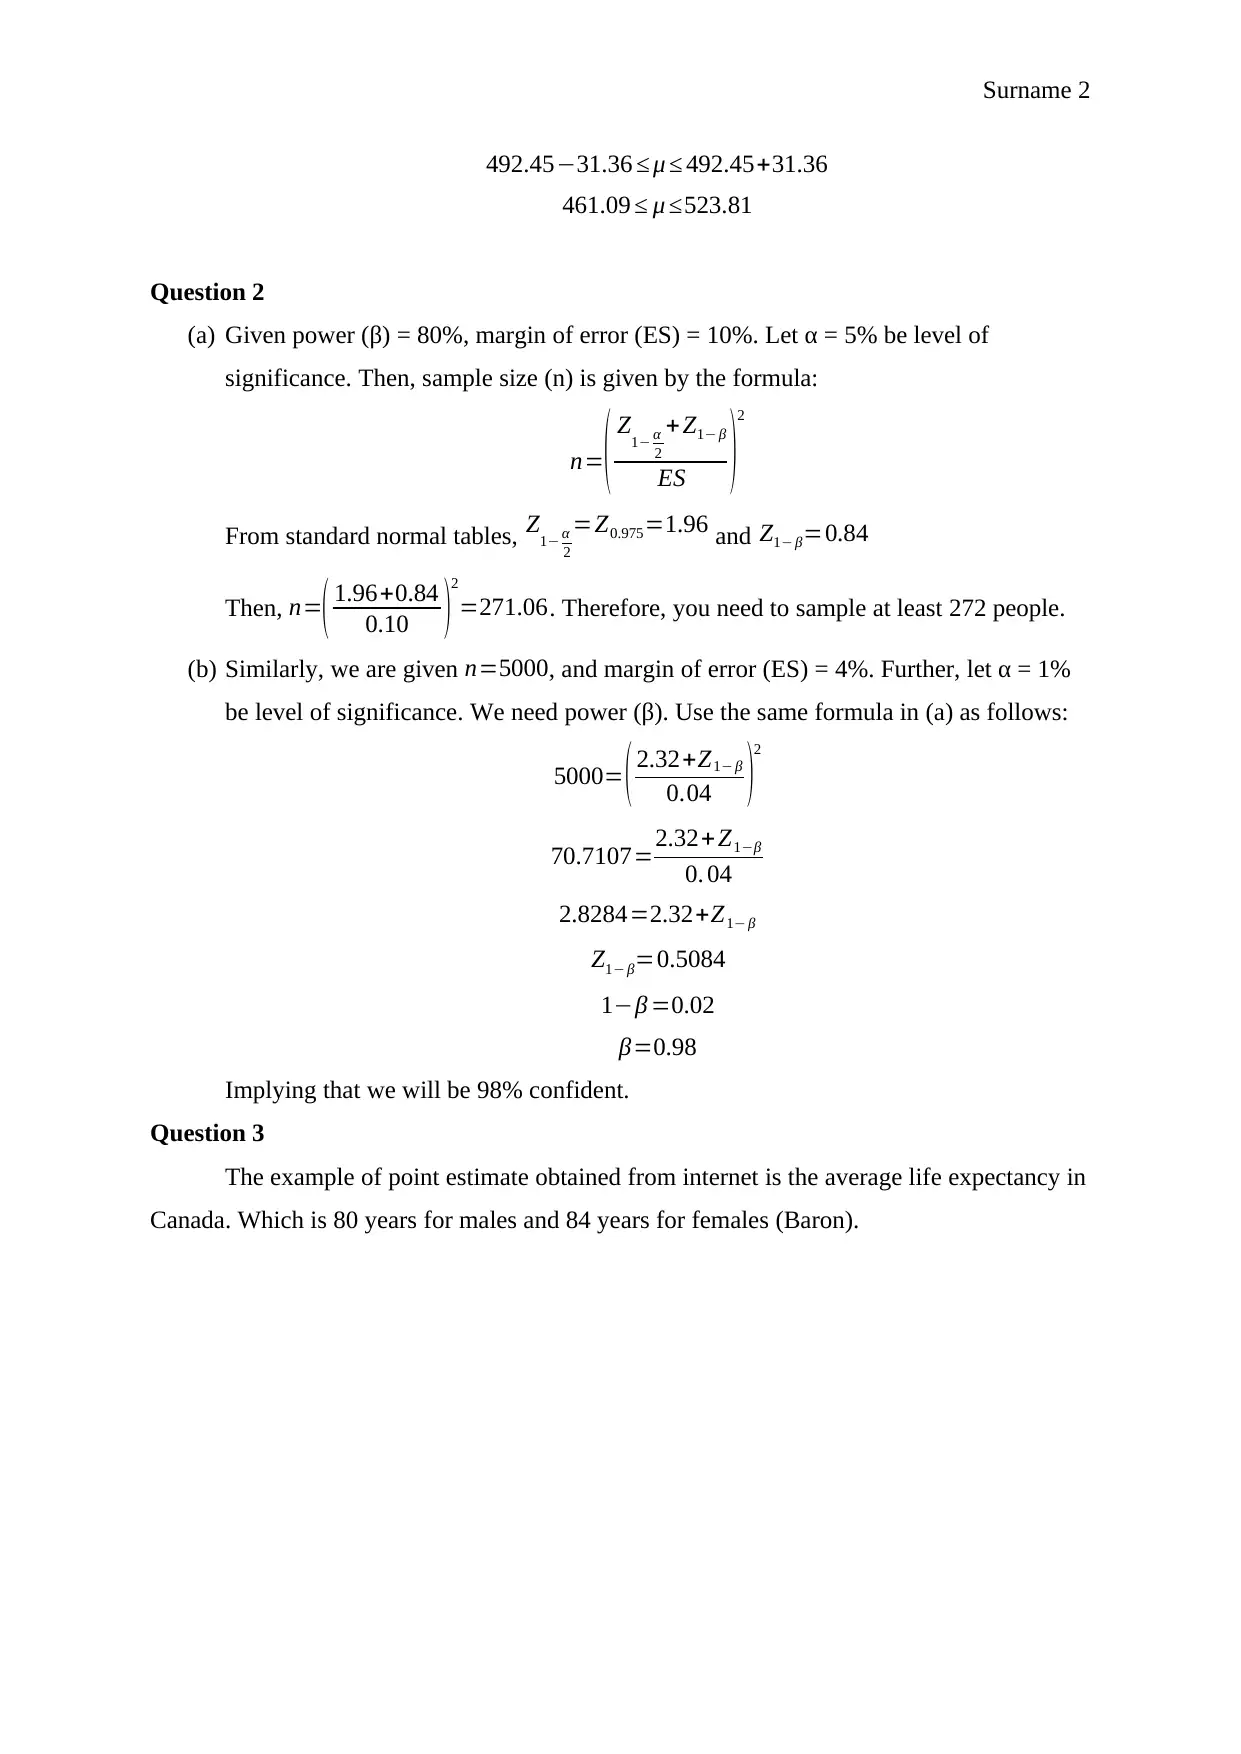
This document provides a solution to a statistics assignment, focusing on data analysis techniques. The assignment explores confidence intervals, sample size calculations, and point estimates. The solution begins by calculating a 95% confidence interval for the population mean of cookie weights, using sample data and the t-distribution. It then calculates the required sample size for a given power and margin of error. Finally, the document provides an example of a point estimate from the internet. The solution demonstrates the application of statistical concepts to real-world scenarios, providing a comprehensive understanding of the topics covered.
Document Page
Surname 1
Student’s Name
Course
Date
Solution to Data Management
Question 1
The weights are measured using a digital weighing machine with an accuracy level of 0.05
grams. The table 1 shows the weights.
Table 1: Weight of Twenty Cookies obtained from local Supermarket
Weight (g) Weight (g)
586 538
384 497
534 486
564 550
454 530
453 427
455 461
544 389
594 385
562 456
Source: Author (2019)
The weights are measured using a digital weighing machine with an accuracy level of
0.05 grams. Let population mean be represented by μ, sample mean by X . Then, under the
assumption that the sample weights of cookies in table are normally distributed the
confidence interval for the population mean is given by the formula:
X S
n tn 1 , α
2
μ X + S
n tn1 , α
2
Where: S – sample standard deviation, n – sample size (number of cookies whose
weights were measured), α – significance level, 5%, and tn1 , α
2 - critical t-value. The
population standard deviation of the eight of the cookies is unknown. From excel, X =492.45
, S = 67.01, n = 20, tn1 , α
2
=t19, 0.025=¿2.093. Therefore, the 95% confidence interval is
calculated as follows:
492.45
( 67.01
20 ) x 2.093 μ 492.45+ ( 67.01
20 ) x 2.093
tabler-icon-diamond-filled.svg

Paraphrase This Document

Need a fresh take? Get an instant paraphrase of this document with our AI Paraphraser
Document Page
Surname 2
492.4531.36 μ 492.45+31.36
461.09 μ 523.81
Question 2
(a) Given power (β) = 80%, margin of error (ES) = 10%. Let α = 5% be level of
significance. Then, sample size (n) is given by the formula:
n=( Z1 α
2
+ Z1 β
ES )
2
From standard normal tables, Z1 α
2
=Z0.975=1.96 and Z1 β=0.84
Then, n=( 1.96+0.84
0.10 )
2
=271.06. Therefore, you need to sample at least 272 people.
(b) Similarly, we are given n=5000, and margin of error (ES) = 4%. Further, let α = 1%
be level of significance. We need power (β). Use the same formula in (a) as follows:
5000= ( 2.32+Z1 β
0.04 )2
70.7107=2.32+ Z1β
0. 04
2.8284=2.32+Z1 β
Z1 β=0.5084
1β =0.02
β=0.98
Implying that we will be 98% confident.
Question 3
The example of point estimate obtained from internet is the average life expectancy in
Canada. Which is 80 years for males and 84 years for females (Baron).
Document Page
Surname 3
Work Cited
Baron, Christof. Average life expectancy* in North America for those born in 2018, by
gender and region (in years). 2018. 11 June 2019.
<https://www.statista.com/statistics/274513/life-expectancy-in-north-america/>.
chevron_up_icon
1 out of 3
circle_padding
hide_on_mobile
zoom_out_icon
[object Object]