Using and Managing Data and Information Homework Solution

Verified

Added on  2022/12/22

|12
|737
|40
Homework Assignment
AI Summary
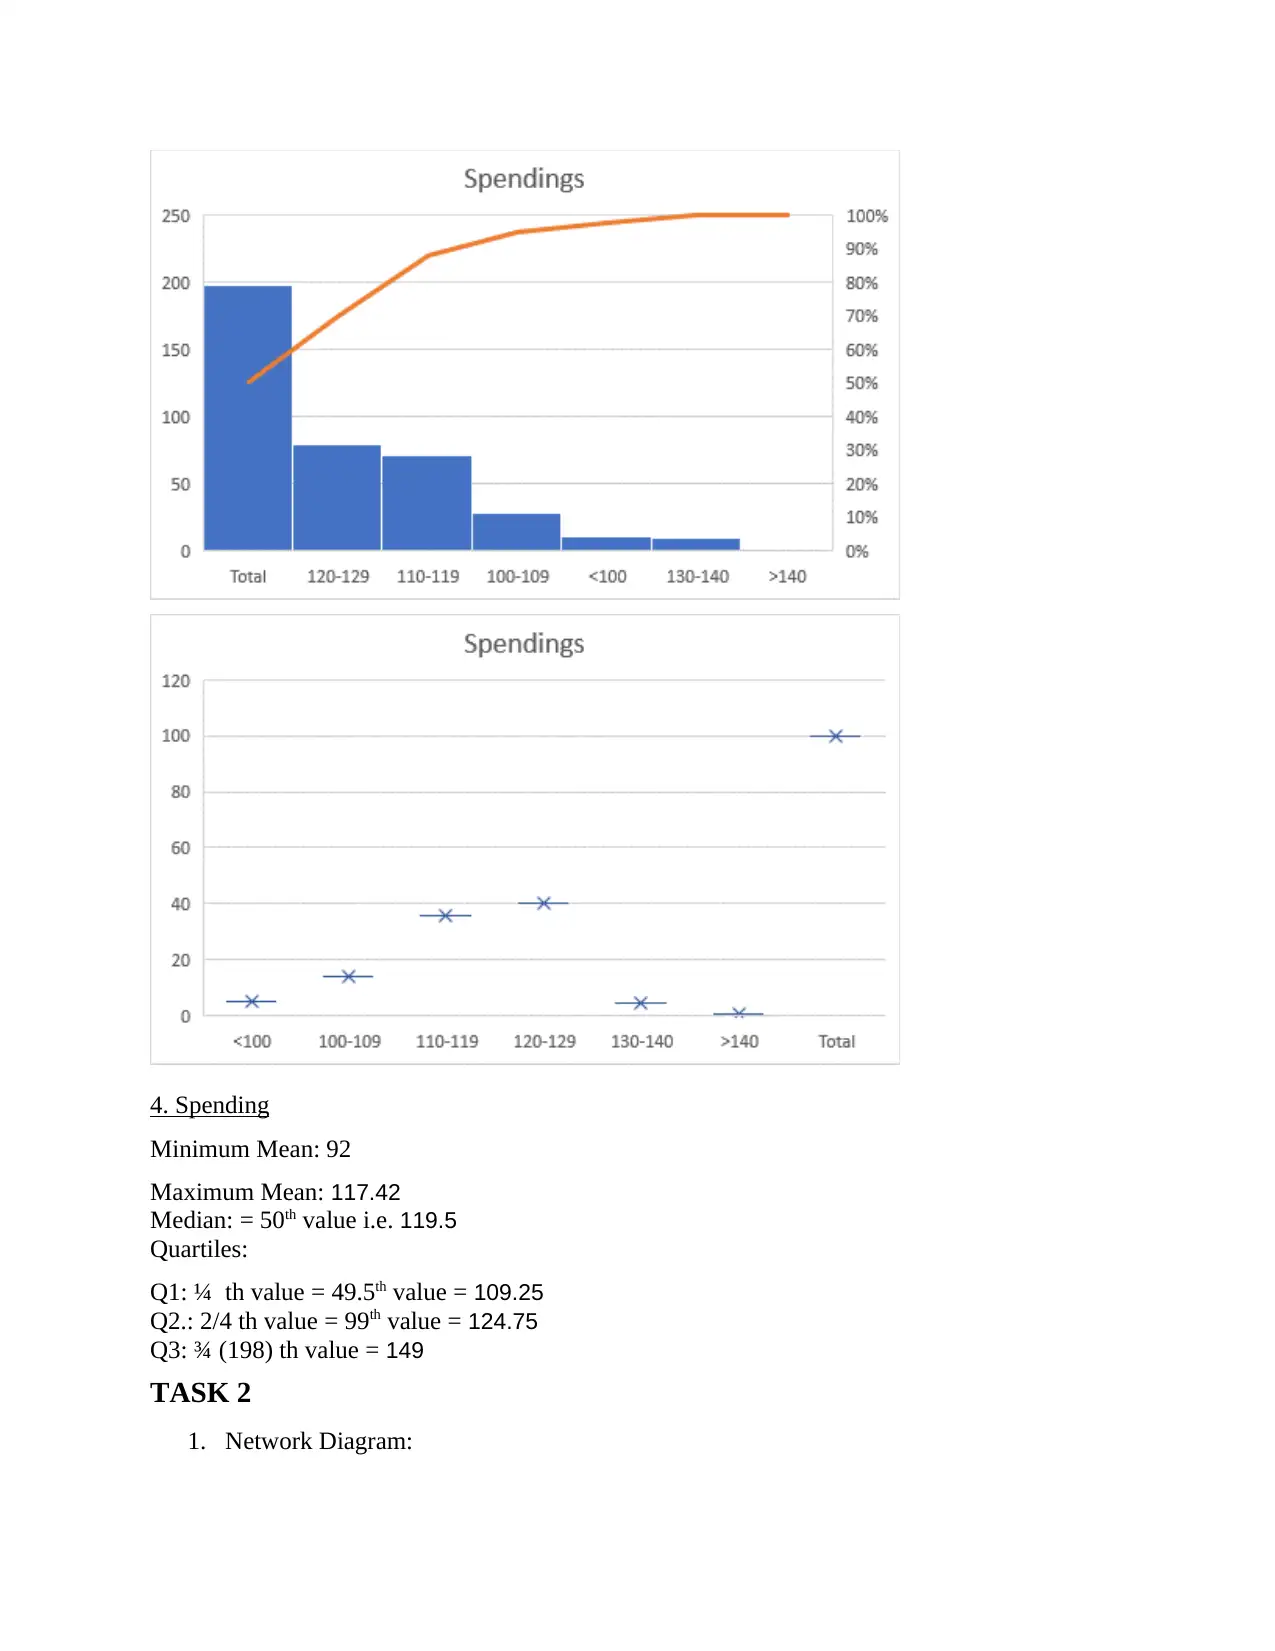
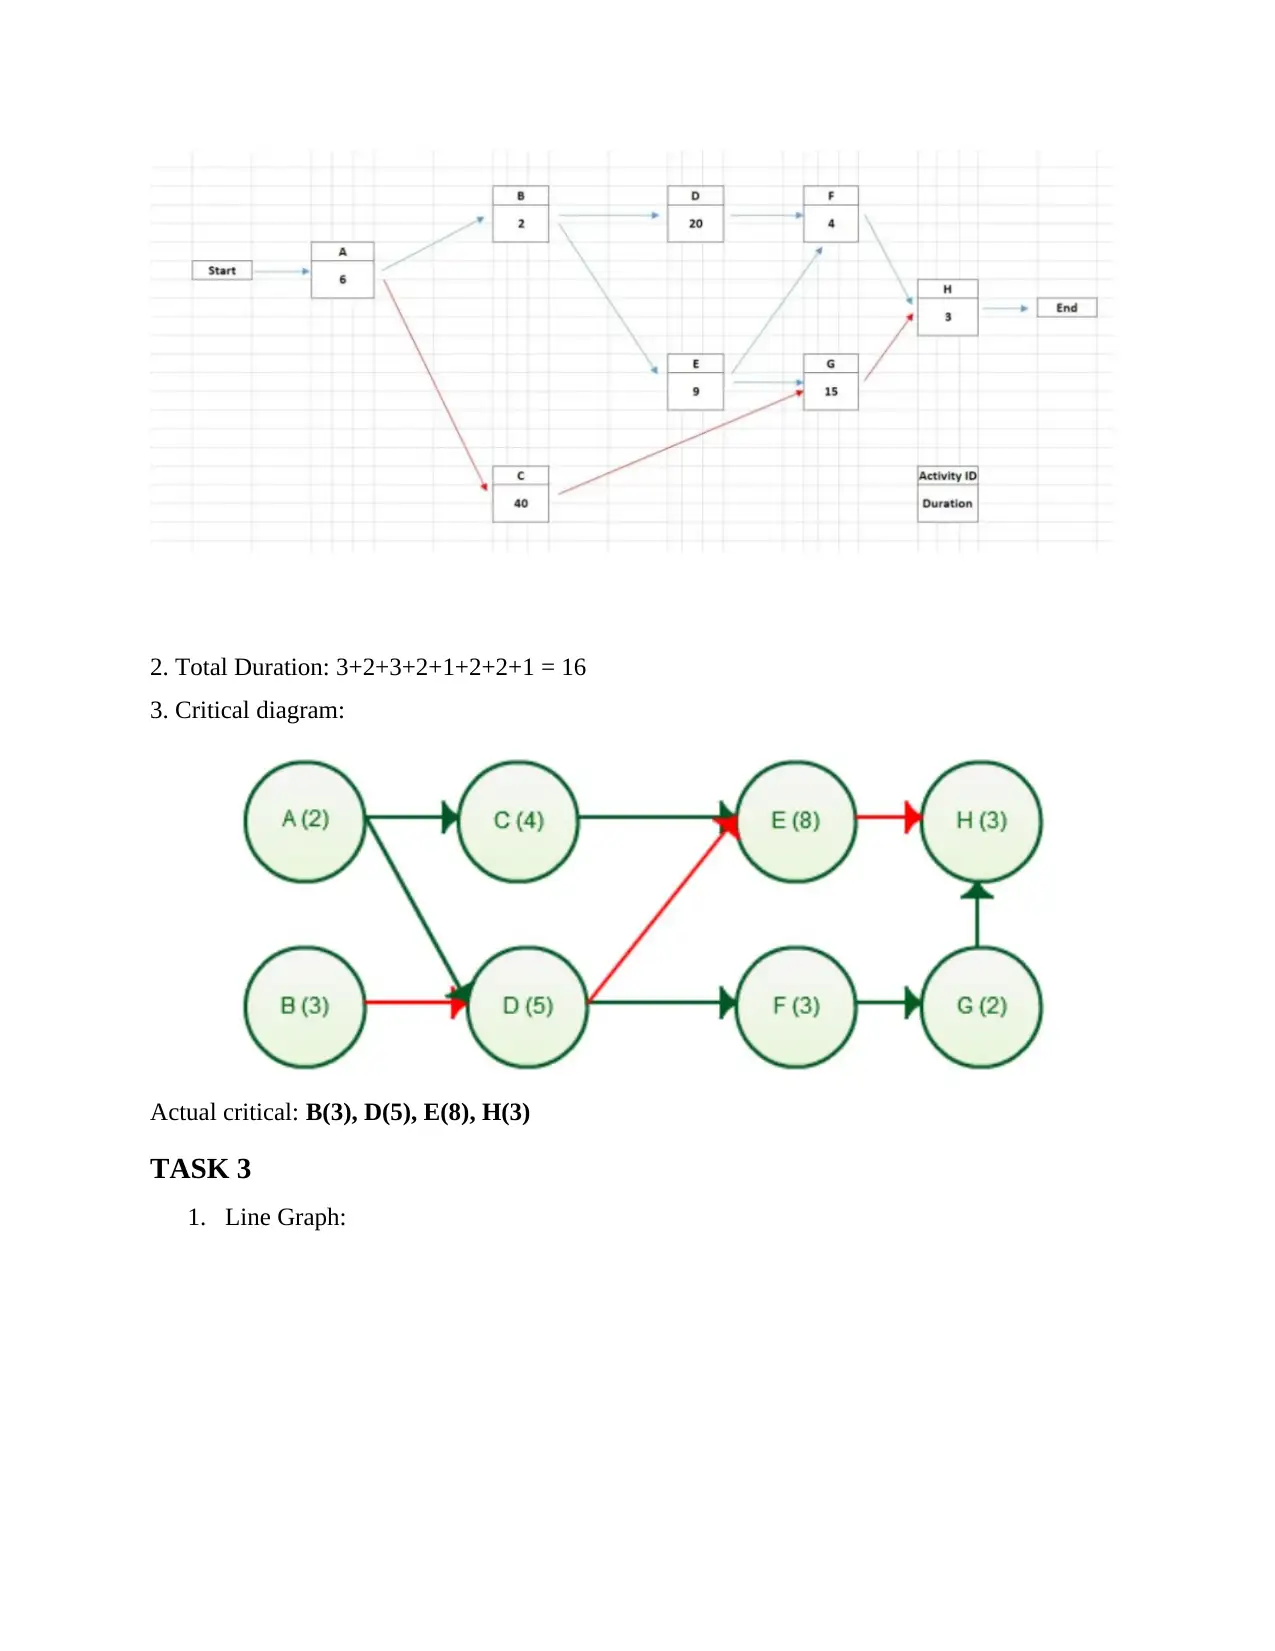
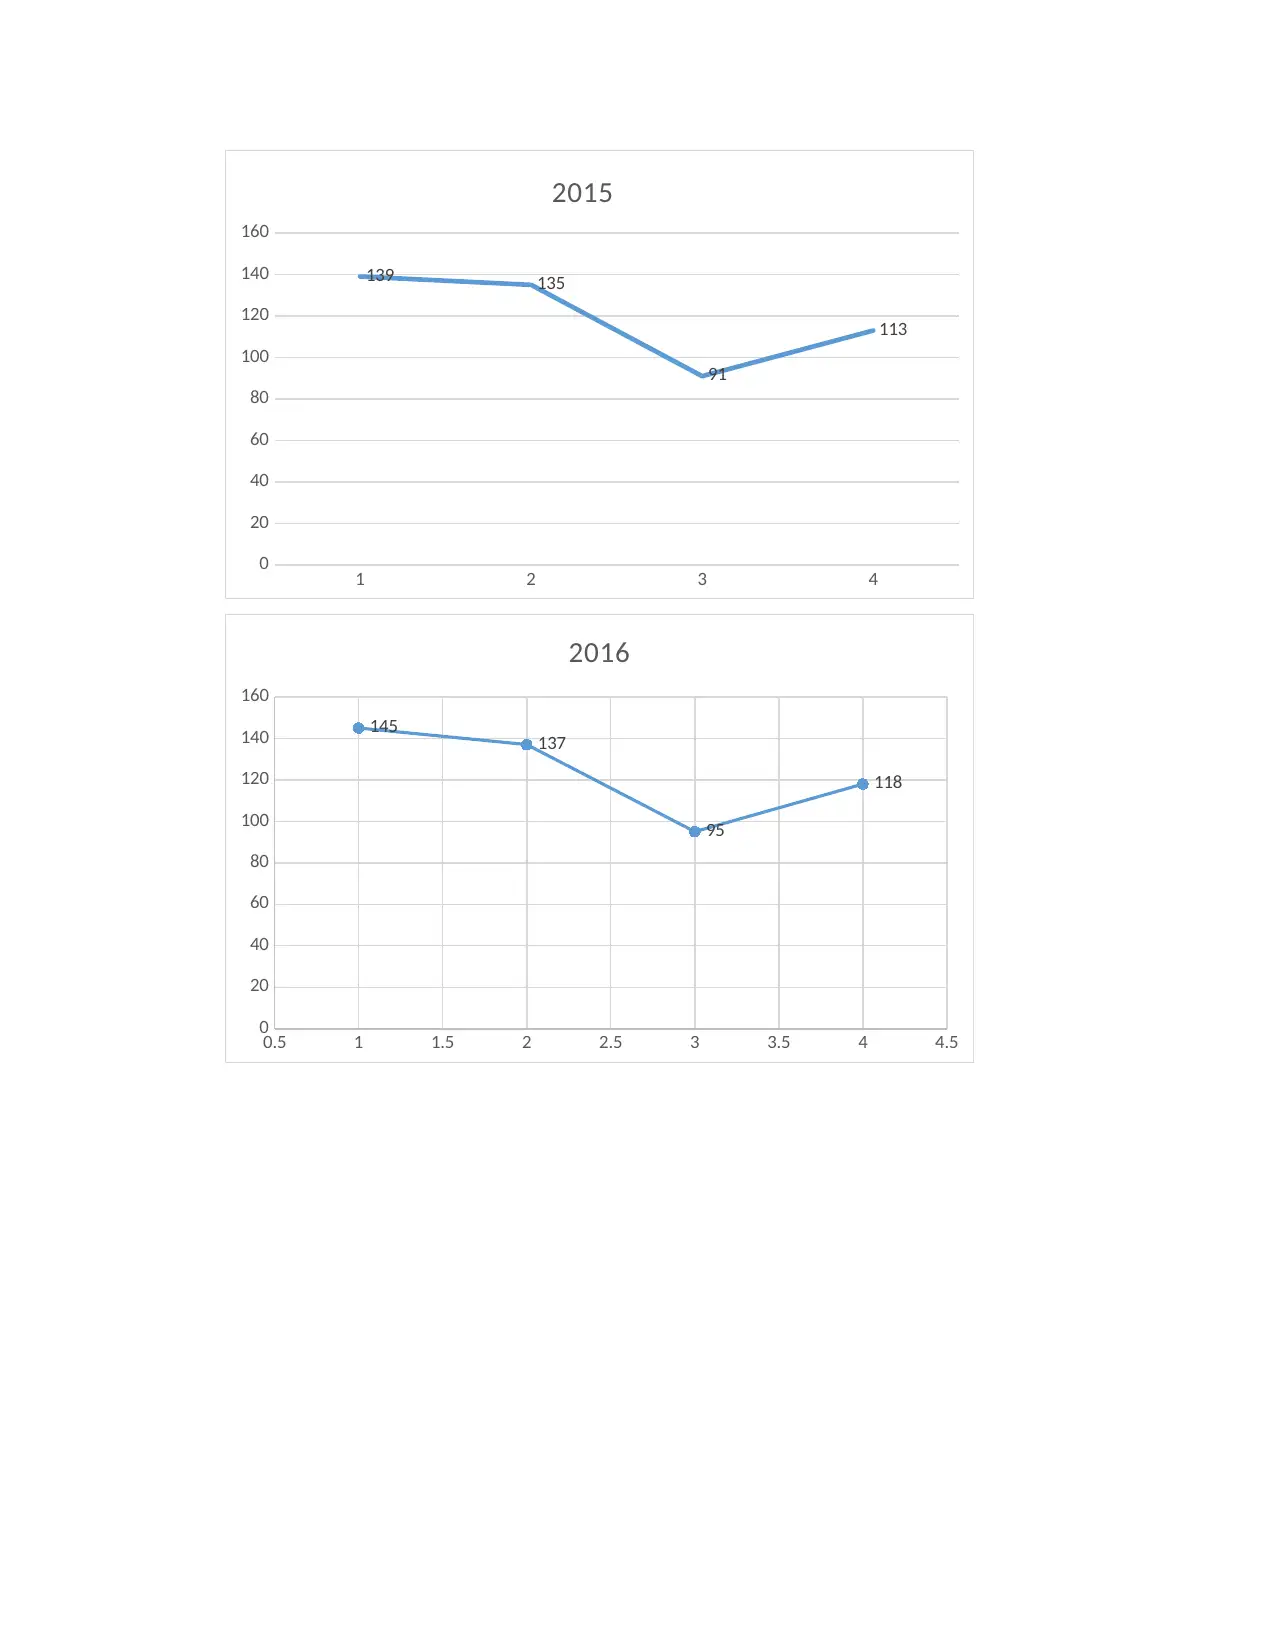
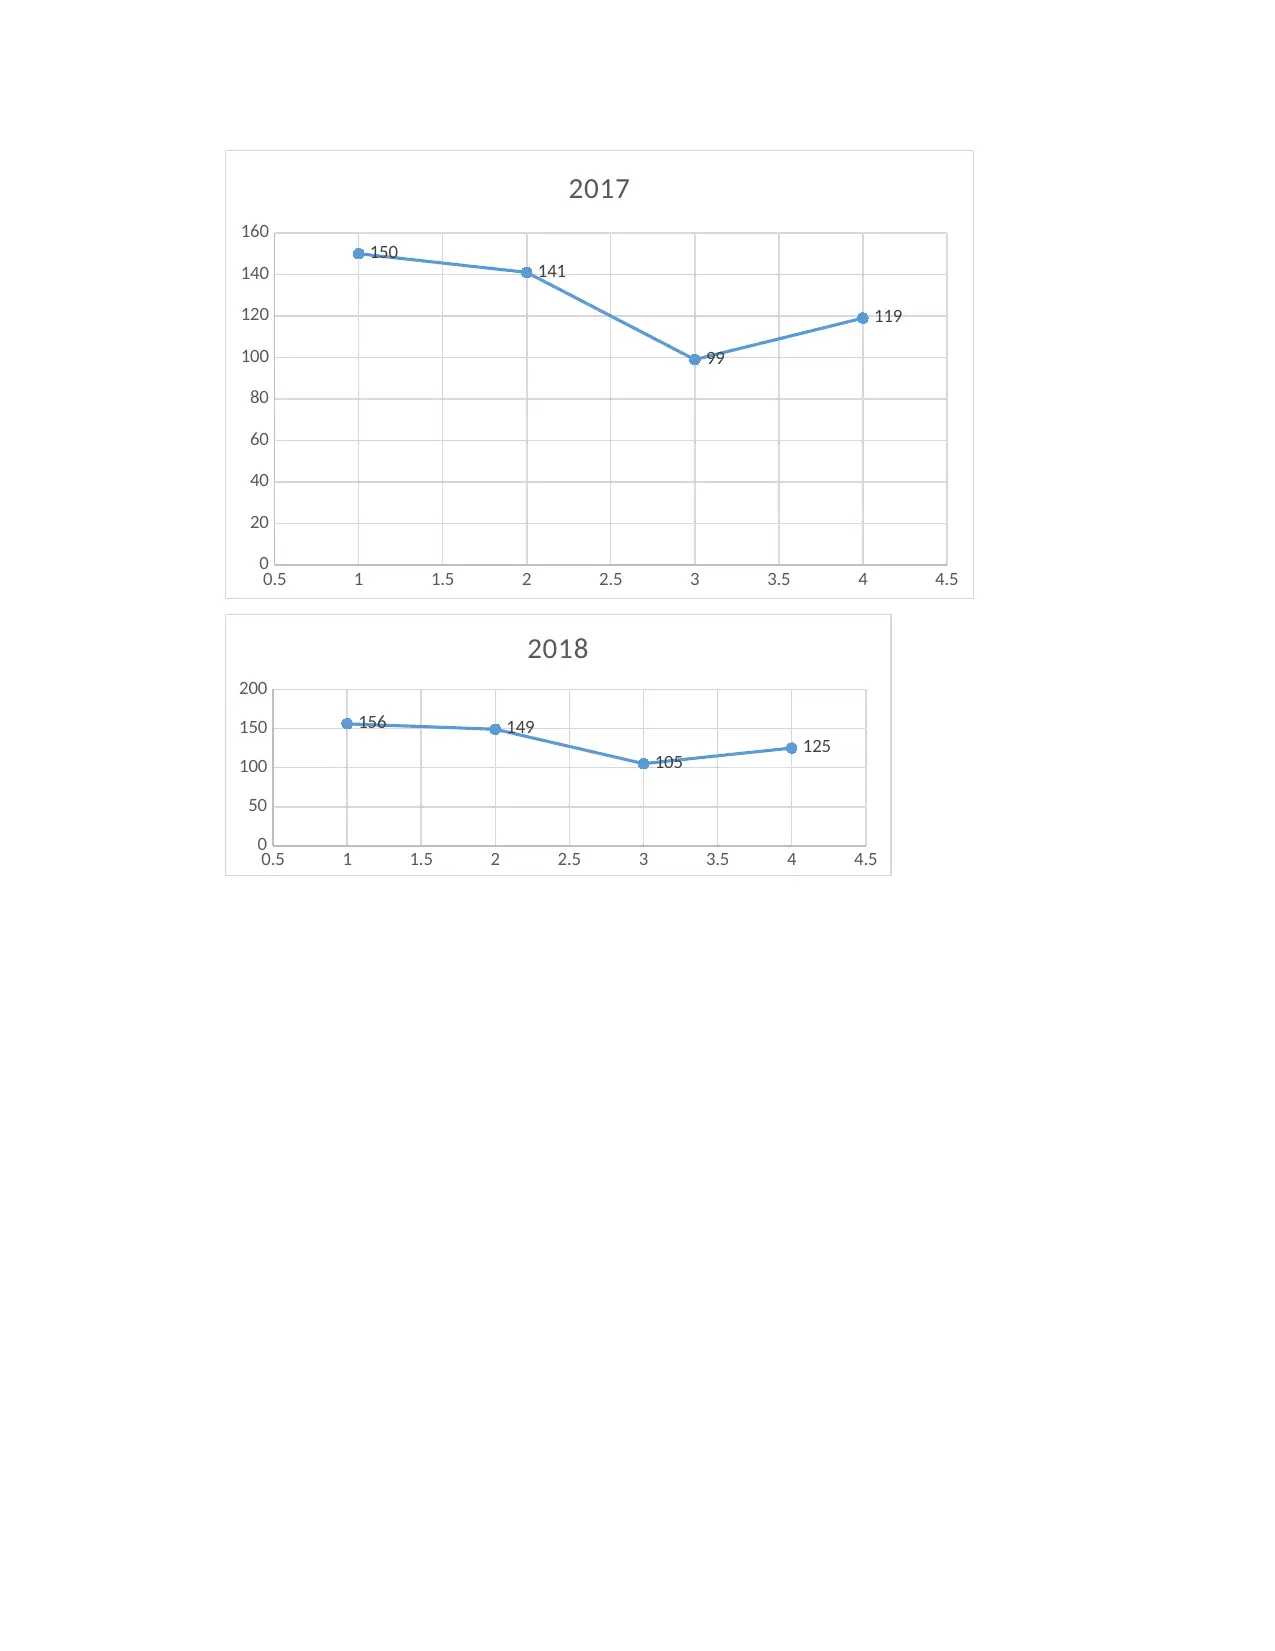
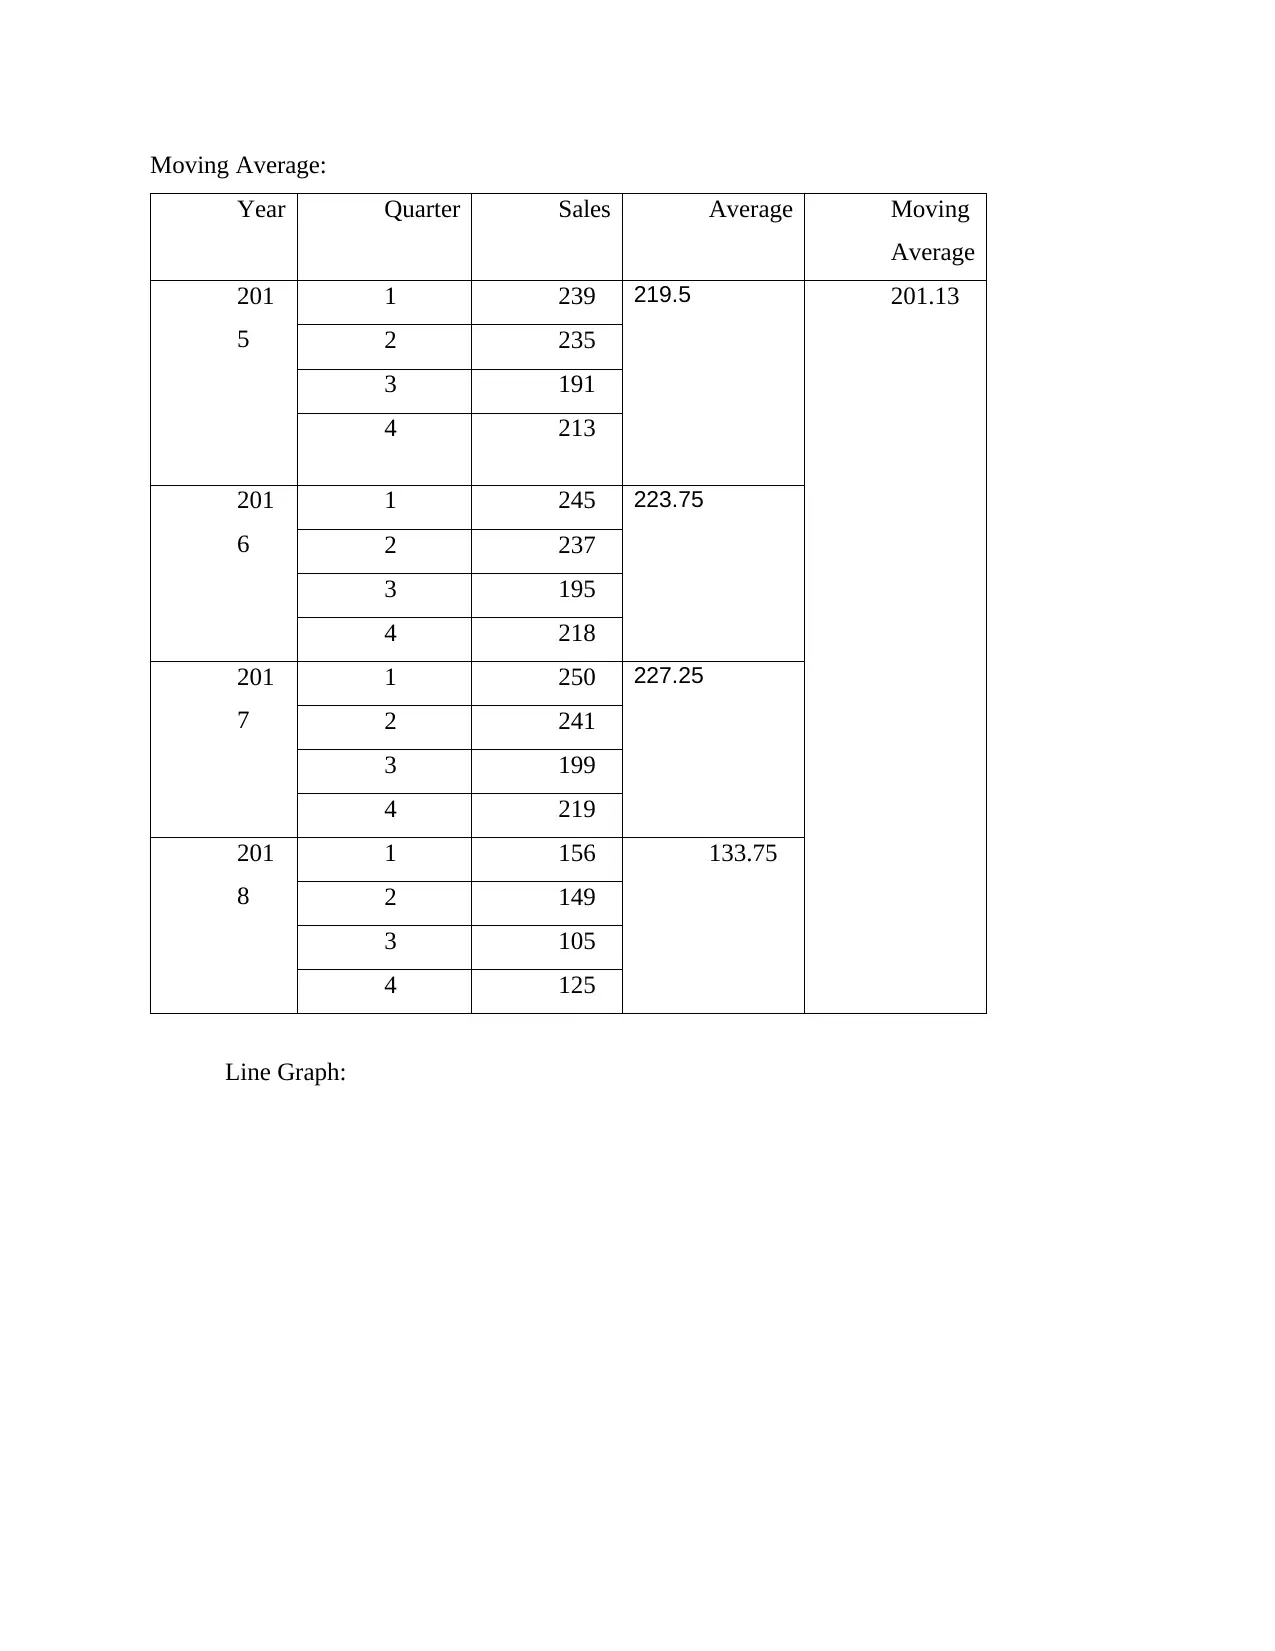
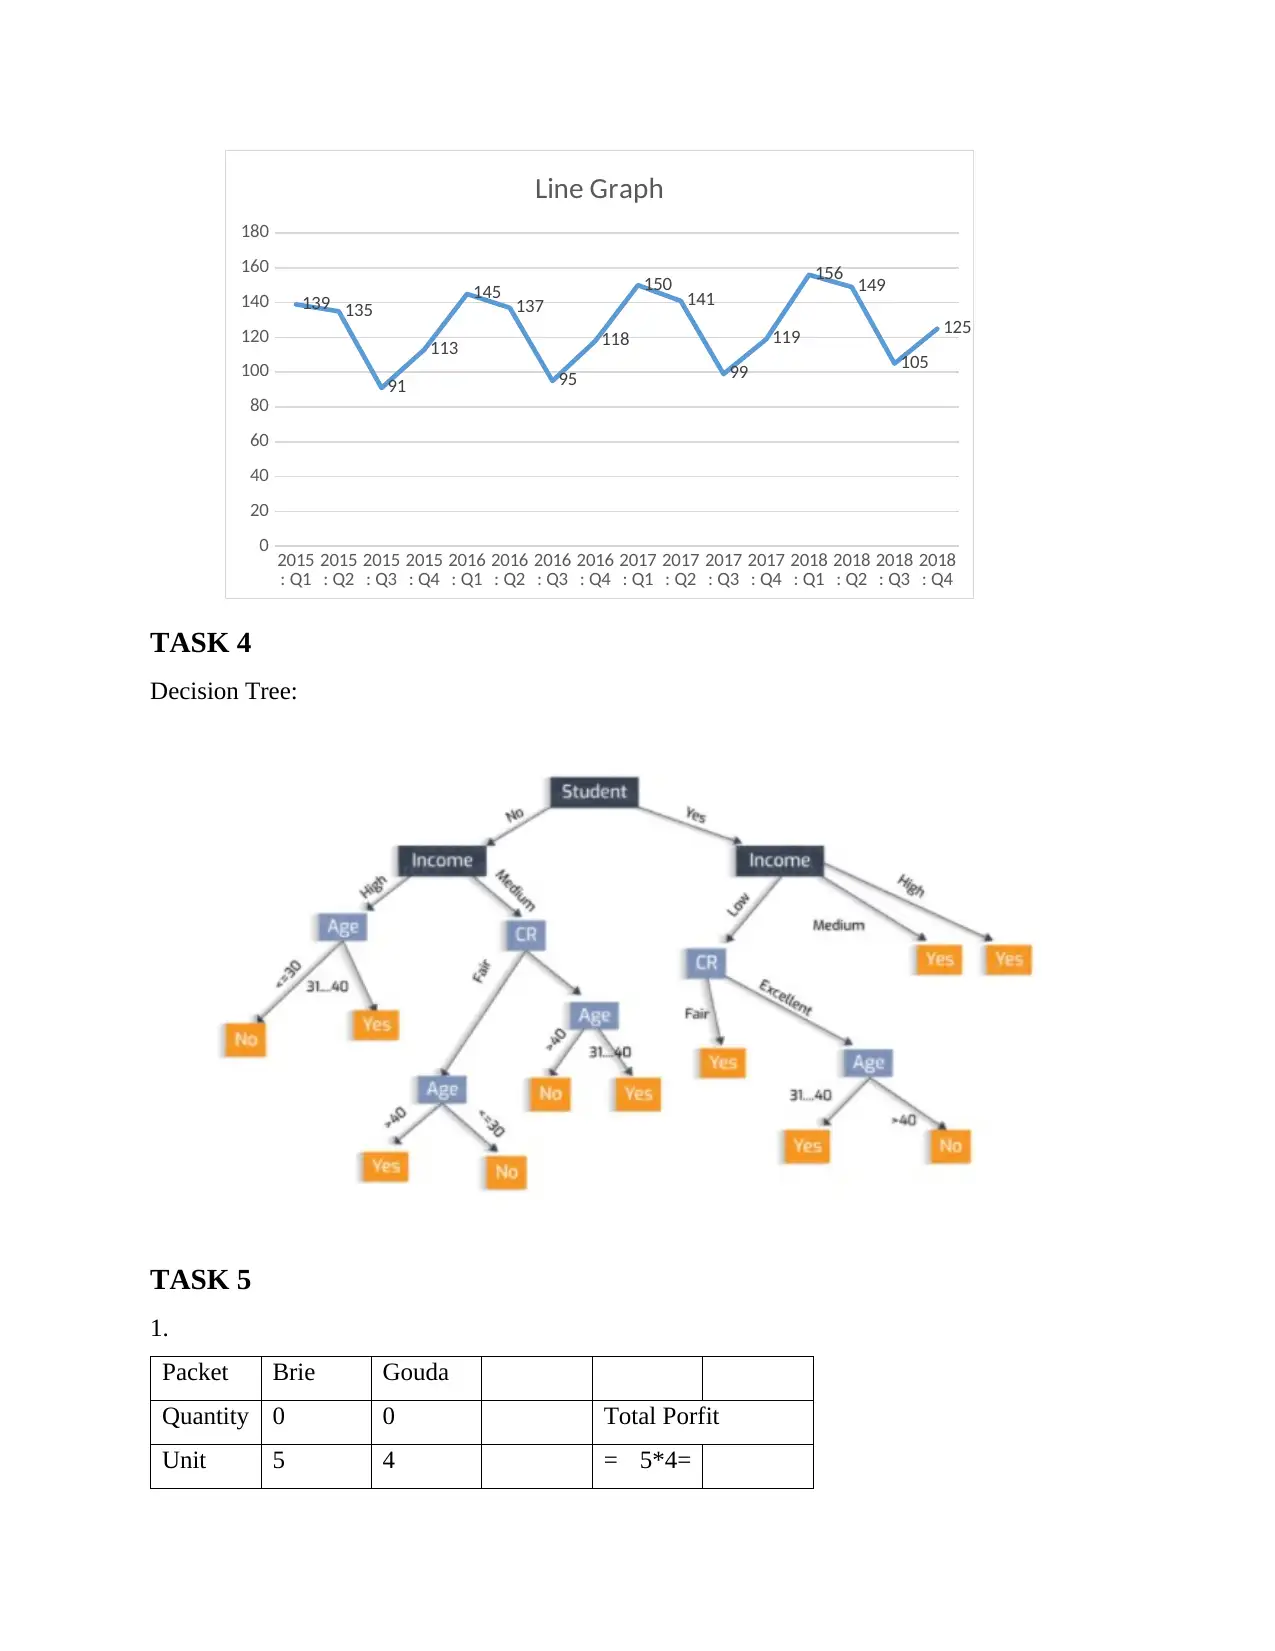
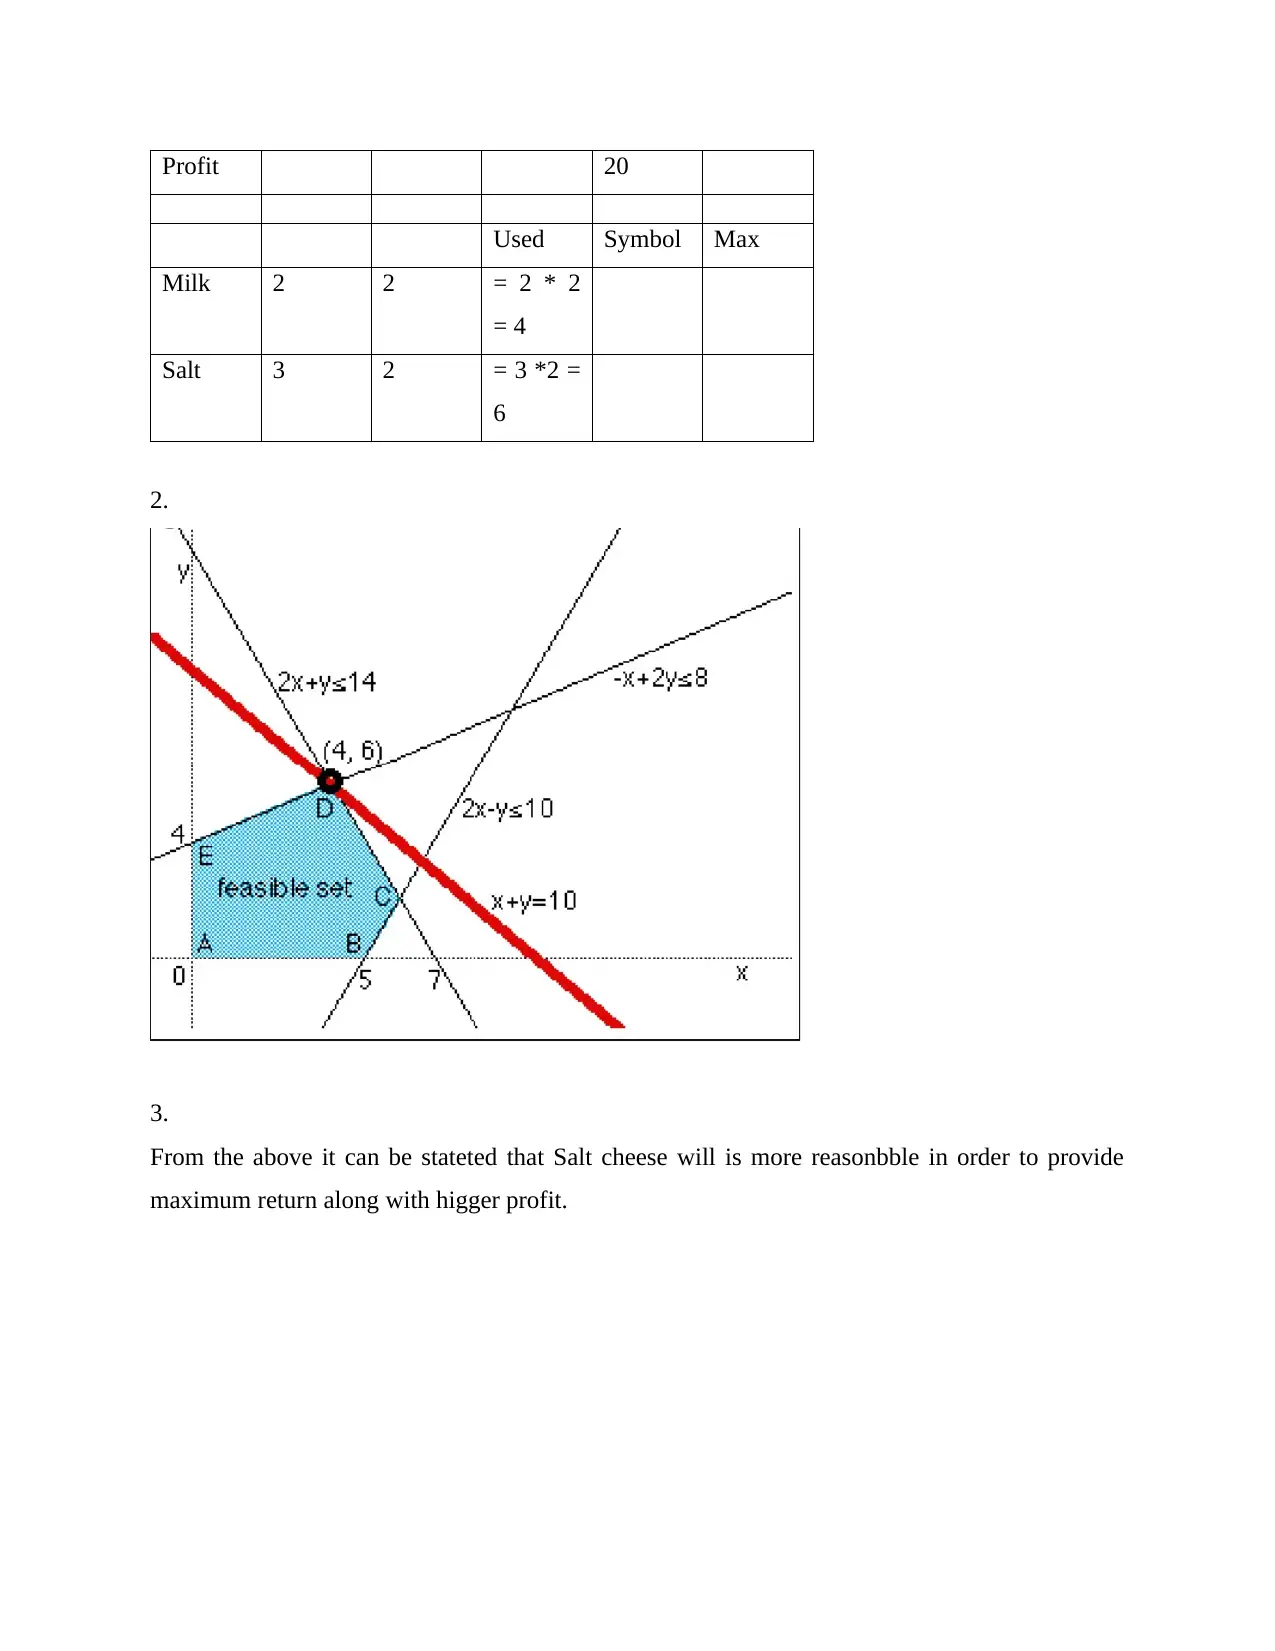
This document presents a comprehensive solution to a data analysis and information management assignment, covering various aspects of data handling and interpretation. The solution begins with labeling codes for categories and creating frequency and percentage frequency tables for gender, age, education, and user spending. It then proceeds to graphical representations, including bar charts and pie charts, to visualize the data. Further analysis includes calculating spending statistics (minimum, mean, median, quartiles) and constructing a cross table. The assignment also involves a network diagram, calculating total duration and identifying the critical path. Time series analysis is performed using line graphs and moving averages. The solution also incorporates a decision tree to represent a decision-making process. Finally, the document includes calculations for profit maximization in a cheese production scenario. This document provides valuable insights into data analysis techniques and their practical applications.
Document Page
Using and Managing Data and
Information
tabler-icon-diamond-filled.svg

Paraphrase This Document

Need a fresh take? Get an instant paraphrase of this document with our AI Paraphraser
Document Page
Contents
TASK 1............................................................................................................................................3
1. Label the codes for categories:...........................................................................................3
2. Frequency and percentage frequency tables:......................................................................3
3. Graphical representation:....................................................................................................5
4. Spending.............................................................................................................................6
5. Cross Table:........................................................................................................................7
6. Scatter Diagram:.................................................................................................................8
TASK 2............................................................................................................................................8
TASK 3............................................................................................................................................9
TASK 4..........................................................................................................................................13
Document Page
TASK 1
1. Label the codes for categories:
ï‚· Gender:
1. Male? 2. Female? 3. Prefer not to say
ï‚· Age:
1. Less than 21 2. 21 to 34 3. 35 to 47 4. 48 to 60 5. 61 and over
ï‚· Education:
1. GCSE or below 2. A’ level or Diploma 3. Degree or further
ï‚· Are you a regular user of self-checkout user?:
1. Yes 2. No
2. Frequency and percentage frequency tables:
Gender
Frequenc
y
Percentage
Male 20.0 40.00%
Female 29.0 58.00%
Prefer not to
say
1.0 2.00%
Total 50.0 100%
Age Frequency Percentage
Less than
21
4.0 8.00%
21 to 34 3.0 6.00%
35 to 47 6.0 12.00%
48 to 60 23.0 46.00%
61 and
over
14.0 28.00%
Total 50.0 100.0
Document Page
Education Frequency Percentage
GCSE or below 13.00 26.00%
A’ level or
Diploma
18.00 36.00%
Degree or further 19.00 38.00%
Total 50.00 100%
SSC
User
Frequency Percentage
Yes 15.00 30.00%
No 35.00 70.00%
Total 50.00 100
Spending Frequency Percentage
<100 5.0 10.00%
100-109 8.0 16.00%
110-119 12.0 24.00%
120-129 20.0 40.00%
130-140 4.0 8.00%
>140 1.0 2.0%
Total 50.0 100
tabler-icon-diamond-filled.svg

Paraphrase This Document

Need a fresh take? Get an instant paraphrase of this document with our AI Paraphraser
Document Page
3. Graphical representation:
47.4747474747475
51.5151515151515
1.01010101010101
100
Gender
Male Female Prefer not to say Total
Less than 21
21 to 34
35 to 47
48 to 60
61 and over
Total
0 20 40 60 80 100 120
9.09090909090909
8.58585858585859
16.1616161616162
47.4747474747475
18.6868686868687
100
Age
Document Page
4. Spending
Minimum Mean: 92
Maximum Mean: 117.42
Median: = 50th value i.e. 119.5
Quartiles:
Q1: ¼ th value = 49.5th value = 109.25
Q2.: 2/4 th value = 99th value = 124.75
Q3: ¾ (198) th value = 149
TASK 2
1. Network Diagram:
Document Page
2. Total Duration: 3+2+3+2+1+2+2+1 = 16
3. Critical diagram:
Actual critical: B(3), D(5), E(8), H(3)
TASK 3
1. Line Graph:
tabler-icon-diamond-filled.svg

Paraphrase This Document

Need a fresh take? Get an instant paraphrase of this document with our AI Paraphraser
Document Page
1 2 3 4
0
20
40
60
80
100
120
140
160
139 135
91
113
2015
0.5 1 1.5 2 2.5 3 3.5 4 4.5
0
20
40
60
80
100
120
140
160
145 137
95
118
2016
Document Page
0.5 1 1.5 2 2.5 3 3.5 4 4.5
0
20
40
60
80
100
120
140
160
150 141
99
119
2017
0.5 1 1.5 2 2.5 3 3.5 4 4.5
0
50
100
150
200
156 149
105 125
2018
Document Page
Moving Average:
Year Quarter Sales Average Moving
Average
201
5
1 239 219.5 201.13
2 235
3 191
4 213
201
6
1 245 223.75
2 237
3 195
4 218
201
7
1 250 227.25
2 241
3 199
4 219
201
8
1 156 133.75
2 149
3 105
4 125
Line Graph:
tabler-icon-diamond-filled.svg

Paraphrase This Document

Need a fresh take? Get an instant paraphrase of this document with our AI Paraphraser
Document Page
2015
: Q1
2015
: Q2
2015
: Q3
2015
: Q4
2016
: Q1
2016
: Q2
2016
: Q3
2016
: Q4
2017
: Q1
2017
: Q2
2017
: Q3
2017
: Q4
2018
: Q1
2018
: Q2
2018
: Q3
2018
: Q4
0
20
40
60
80
100
120
140
160
180
139 135
91
113
145 137
95
118
150 141
99
119
156 149
105
125
Line Graph
TASK 4
Decision Tree:
TASK 5
1.
Packet Brie Gouda
Quantity 0 0 Total Porfit
Unit 5 4 = 5*4=
Document Page
Profit 20
Used Symbol Max
Milk 2 2 = 2 * 2
= 4
Salt 3 2 = 3 *2 =
6
2.
3.
From the above it can be stateted that Salt cheese will is more reasonbble in order to provide
maximum return along with higger profit.
chevron_up_icon
1 out of 12
circle_padding
hide_on_mobile
zoom_out_icon
[object Object]