Data Mining Assignment: XLMiner, Clustering, and Business Insights

Verified

Added on  2020/03/16

|10
|1164
|170
Homework Assignment
AI Summary
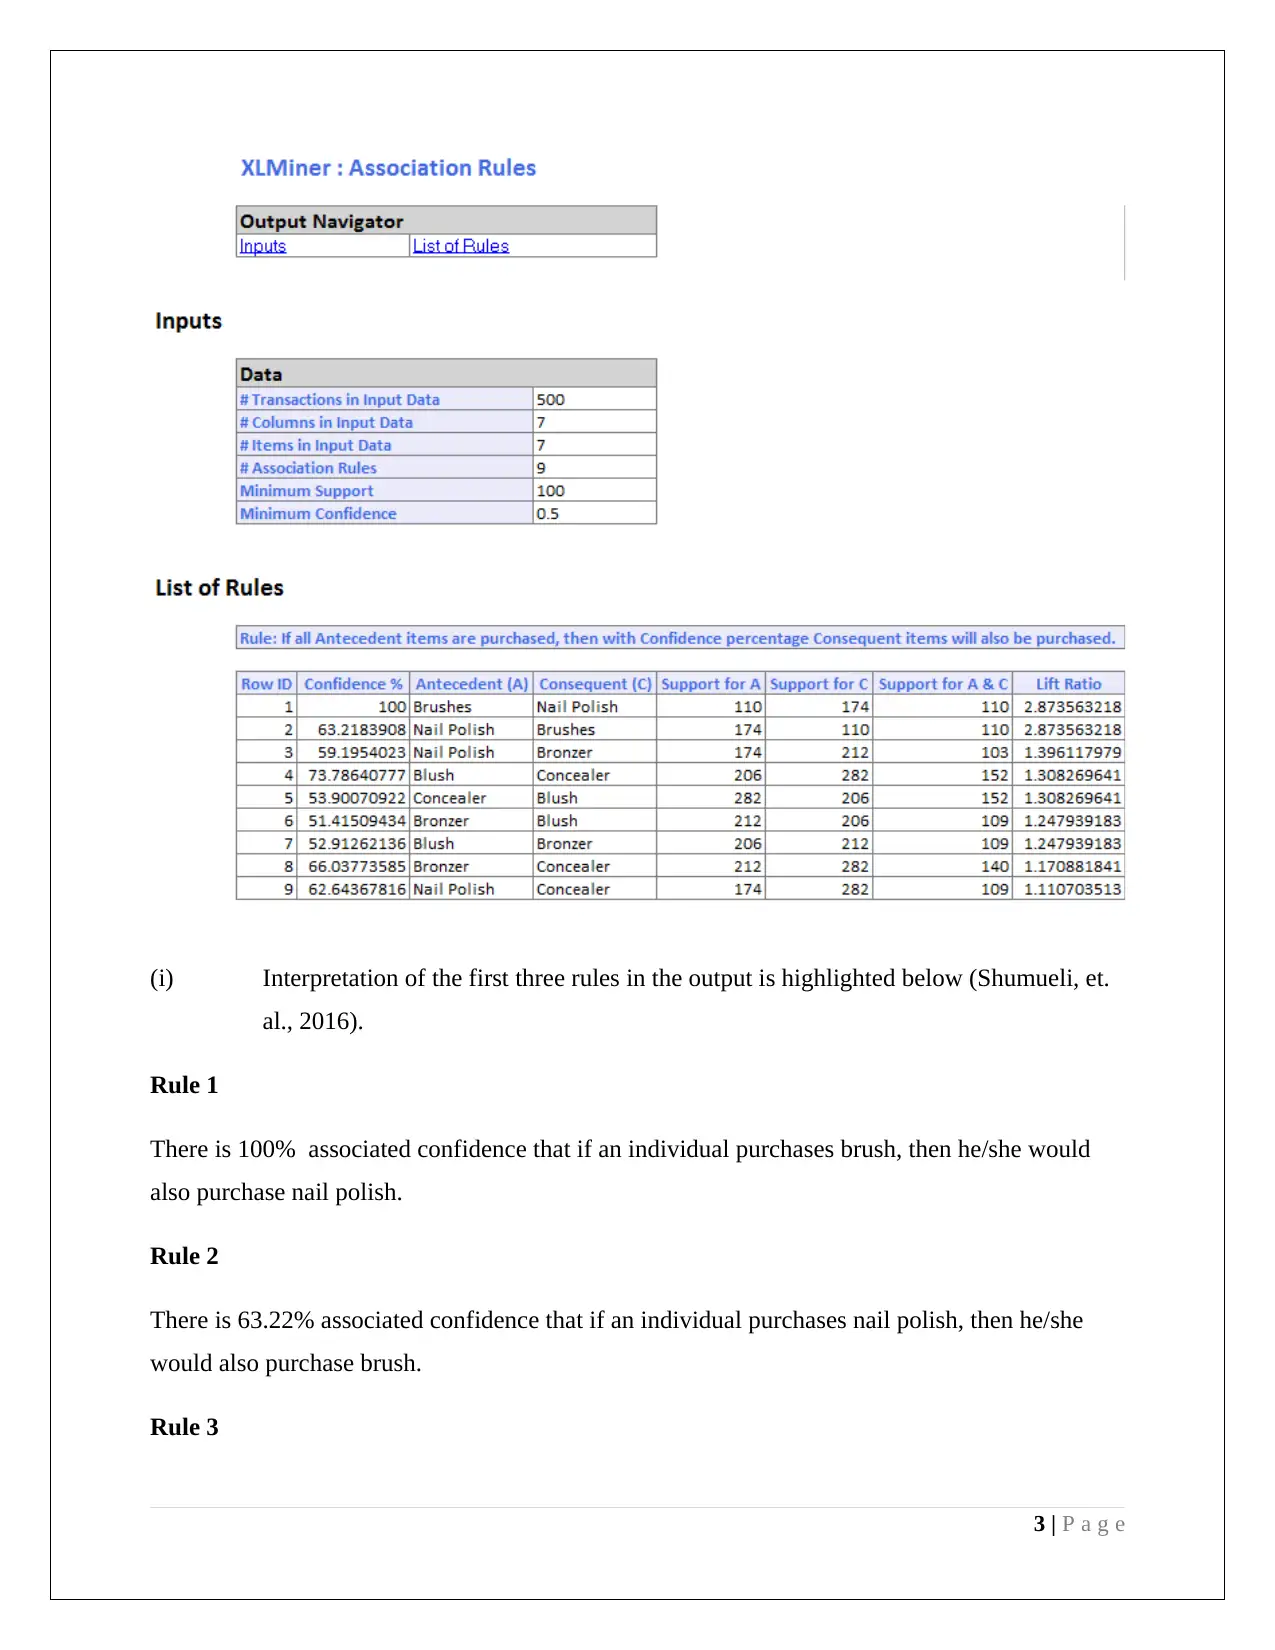
This data mining assignment analyzes association rules and clustering techniques using XLMiner. The solution begins by interpreting association rules, assessing redundancy, and evaluating the impact of confidence levels. It then examines a dendrogram output, emphasizing the importance of data normalization in clustering and the labeling of clusters based on centroid parameters. The assignment compares hierarchical and K-mean clustering results, highlighting differences in cluster formation. Finally, it proposes targeted marketing strategies for different customer clusters, such as high net worth and infrequent flyers, based on the clustering analysis. The assignment includes references to relevant literature.
Document Page
DATA MINING
Student id
[Pick the date]
tabler-icon-diamond-filled.svg

Paraphrase This Document

Need a fresh take? Get an instant paraphrase of this document with our AI Paraphraser
Document Page
Table of Contents
Question 1........................................................................................................................................2
Question 2........................................................................................................................................4
Reference.........................................................................................................................................8
1 | P a g e
Document Page
Question 1
XLMiner is used to apply association rules on the given set of data. The output from XLMiner is
highlighted below:
Minimum confidence is taken as 50%.
2 | P a g e
Document Page
(i) Interpretation of the first three rules in the output is highlighted below (Shumueli, et.
al., 2016).
Rule 1
There is 100% associated confidence that if an individual purchases brush, then he/she would
also purchase nail polish.
Rule 2
There is 63.22% associated confidence that if an individual purchases nail polish, then he/she
would also purchase brush.
Rule 3
3 | P a g e
tabler-icon-diamond-filled.svg

Paraphrase This Document

Need a fresh take? Get an instant paraphrase of this document with our AI Paraphraser
Document Page
There is 59.19% associated confidence that if an individual purchase nail polish, then he/she
would also purchase bronzer.
(ii) The redundancy of rule tends to adversely impact the quality of information provided.
This is because redundant rules do not add any value and hence should be removed.
These tend to provide redundant information which is otherwise provided by a
separate rule as well. For the given output, a redundant rule is observed for the second
rule since it does not add any value when seen along with the first rule.
Also, these rules have high utility which can be assessed by considering two different parameters
namely the confidence interval and also the lift ratio. The rules which tend to have a higher lift
ratio must be accorded a higher importance. Further, the confidence interval tends to highlight
the chances of the consequent happening considering the antecedent.
(iii) When the minimum confidence is increased to 75%, then the following output would
be generated.
4 | P a g e
Document Page
Based on the above highlighted XLMiner output, it would be fair to conclude that only one rule
would be displayed which is higher than 75% confidence. This is because the rules which have
presented confidence percentage lower than 75% would not appear. This can also be validated
from the earlier output where minimum confidence percentage was 50% and hence the rules that
were being outlined were relatively larger. Hence, as a general rule it can be said that lower the
minimum confidence level, assuming everything else remains the same, there would be an
increase in the number of rules visible in the output (Ragsdale, 2014).
Question 2
(a) The dendrogram output for the given set of data generated by XLMiner is presented below:
It is apparent from the above dendrogram that there are three clusters present which are
presented at the distance of threshold value i.e. 1000. This can be deciphered by drawing a
horizontal line parallel to the X axis.
5 | P a g e
Document Page
(b) Data normalisation is very imperative for the process of clustering. This is because if data
normalisation is not done, then this could potentially lead to distances between centroids
not being computed correctly which would be the direct outcome of undue importance
given to the parameter which would have a larger scale. One way to minimize this
problem is to accord equal weights to the various variables so that the weights are
delinked with the scale. Also, the overall measure can be influenced through the impact
of scale which in-turn could reduce the overall utility of the clustering process. Therefore,
it becomes evident that normalisation is necessary before clustering (Grossmann &
Rinderle, 2015).
(c) The labeling of the clusters based on their centroid parameters is given below (Ragsdale,
2014).
First Cluster
Characteristics Observed:
1) Some non-flight transactions are observed.
2) Over spending pattern seems to be lying between the other two clusters.
Hence, appropriate label is middle class flyer.
Second Cluster
Characteristics Observed:
1) The miles eligible for award travel are the highest.
6 | P a g e
tabler-icon-diamond-filled.svg

Paraphrase This Document

Need a fresh take? Get an instant paraphrase of this document with our AI Paraphraser
Document Page
2) The flight transactions in the last one year are also significant leading to earning of
substantial air miles.
3) The non-flight transactions are also significant but lesser than cluster 1.
4) Further, the time since enrollment seems to be quite high.
Hence, appropriate label is high networth flyer.
Third Cluster
Characteristics Observed:
1) The flight transactions in the last 12 months seem to be almost zero and hence the
flight related miles earned are almost zero.
2) However, the non-flight related miles tend to be significant.
Hence, appropriate label is Infrequent Flyer.
d) The K mean clustering has been implemented with three clusters and the following picture
seems to have emerged.
It needs to be compared whether the clustering process leads to the similar pattern formation as
in case of hierarchical clustering (Shumueli, et. al., 2016).
Clearly, the output above implies that the respective clusters obtained in this process seem to be
different in comparison to the above clustering result. This is most evident by comparing any one
cluster with the corresponding cluster in hierarchical. Take for example cluster 1, the high flight
transaction and corresponding flight miles along with the highest balance clearly reflect that this
7 | P a g e
Document Page
cluster belongs to the high networth individuals. This is in sharp contrast with the observation in
case of hierarchical clustering where the same was not observed for these flyers. Hence, the
result of the two cannot be compared (Grossmann & Rinderle, 2015).
e) The cluster 2 and cluster 3 (according to hierarchical clustering) would be the proposed targets
as these represent opportunities which are to be tapped.
For the high networth cluster, offer should be linked to the number of check ins which can
potentially lead to higher bonus points. Further, frequent flyer card also needs to be promoted
so as to build loyalty and enhance the business.
For the infrequent traveller cluster, it would be opportune to provide usage of bonus miles for
flights which would tend to lead to higher rewards and potential cash-back. This would
typically increase the number of flight transactions by this group (Ragsdale, 2014).
Reference
Ragsdale, C. (2014) Spread sheet Modelling and Decision Analysis: A Practical Introduction to
Business Analytics (7th ed.). London: Cengage Learning.
Shumueli, G., Bruce, C.P., Yahav, I., Patel, R. N., Kenneth, C., & Lichtendahl, J. (2016) Data
Mining For Business Analytics: Concepts Techniques and Application (2nd ed.).London:
John Wiley & Sons.
Grossmann, W. & Rinderle- Ma, S. (2015) Fundamentals of Business Intelligence (2nd ed.). New
York: Springer.
8 | P a g e
Document Page
9 | P a g e
chevron_up_icon
1 out of 10
circle_padding
hide_on_mobile
zoom_out_icon