Data Mining and Visualization for Business Intelligence Assignment - 3

Verified

Added on  2020/03/16

|6
|1216
|89
Project
AI Summary
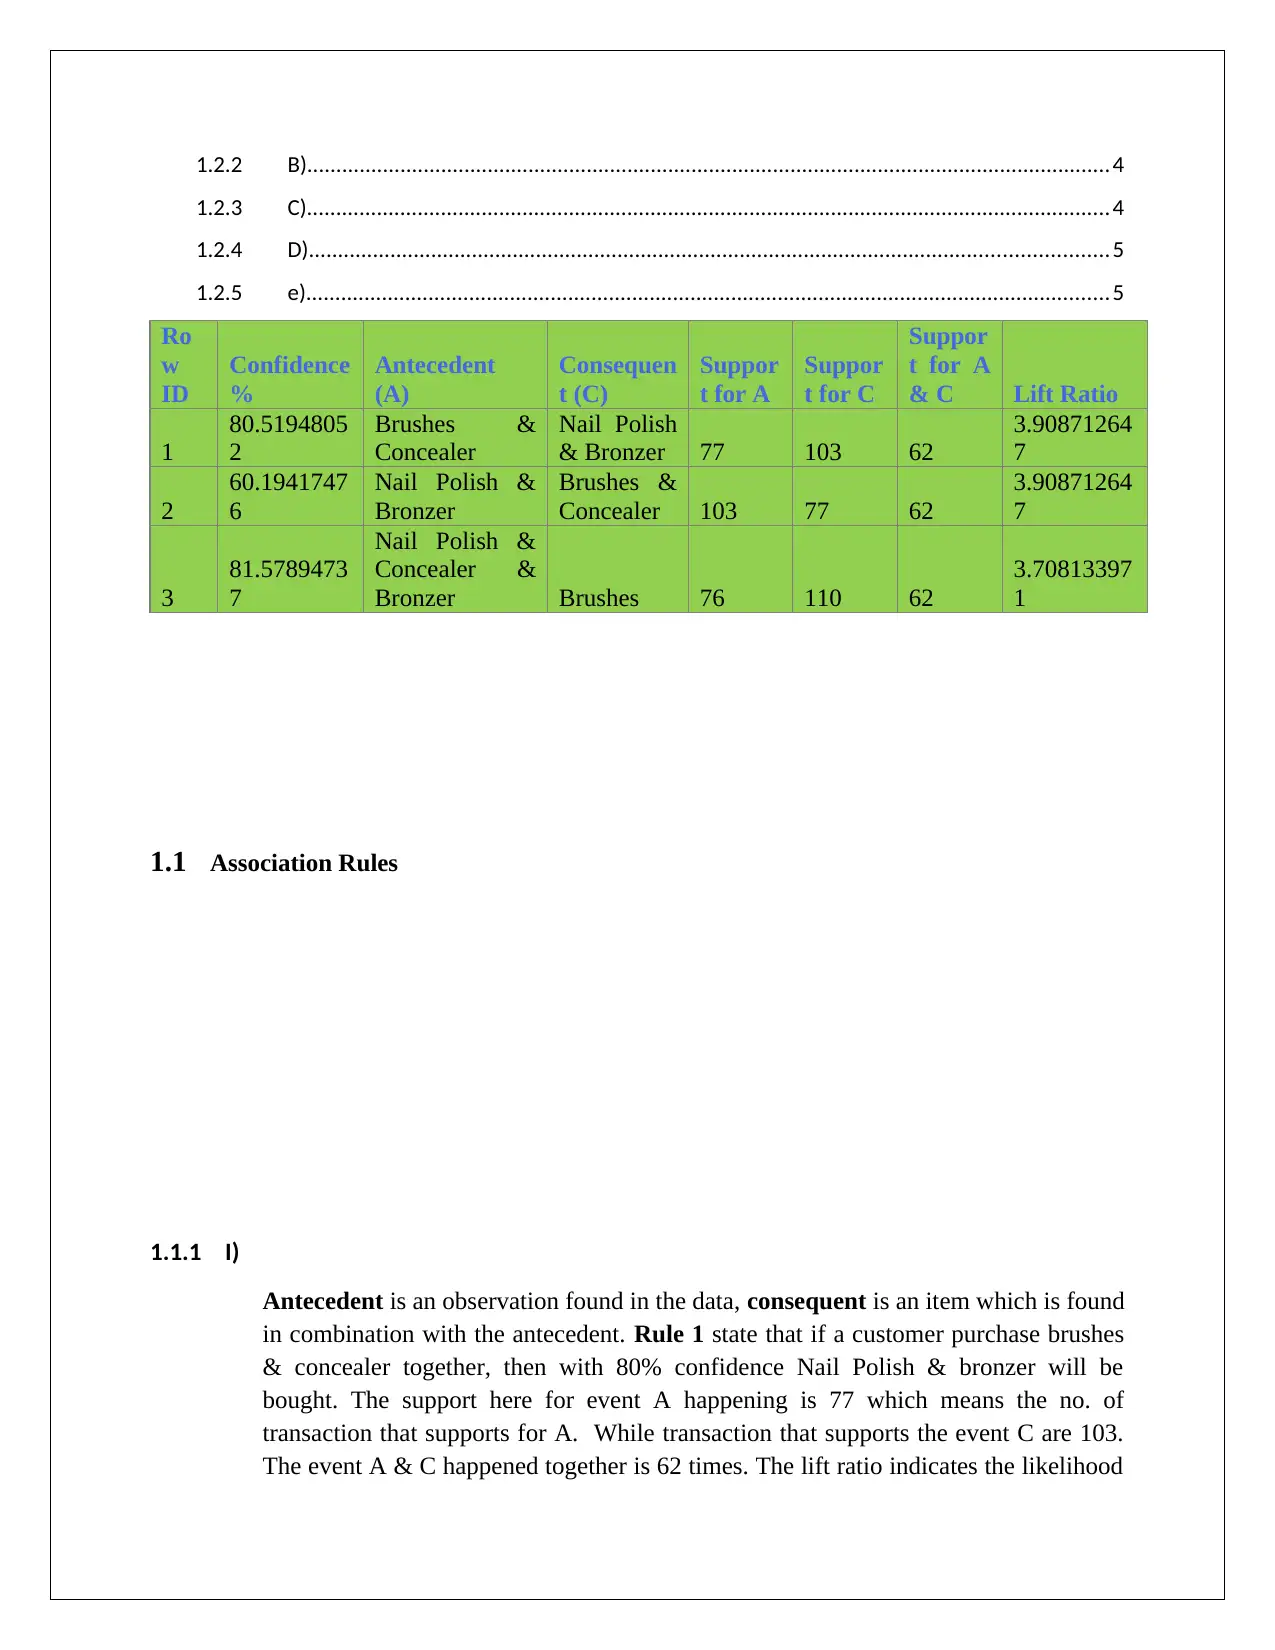
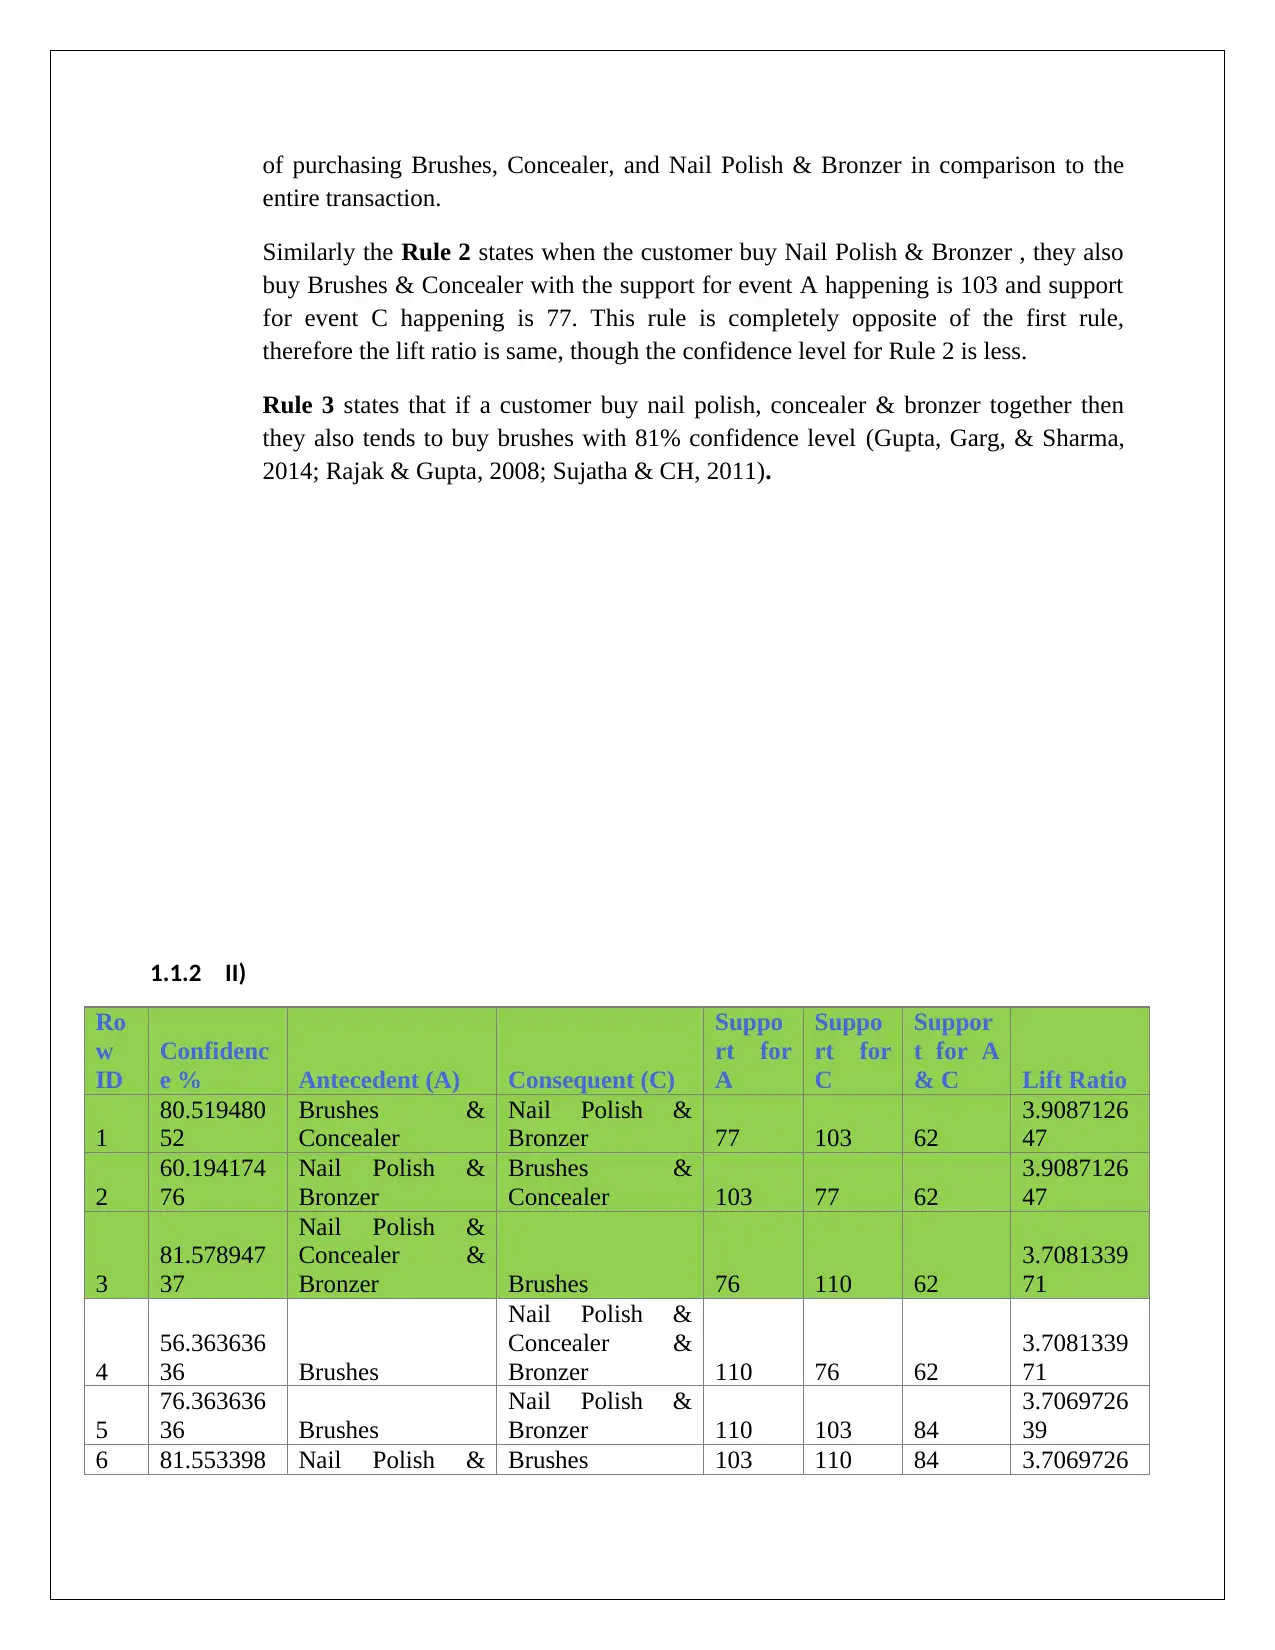
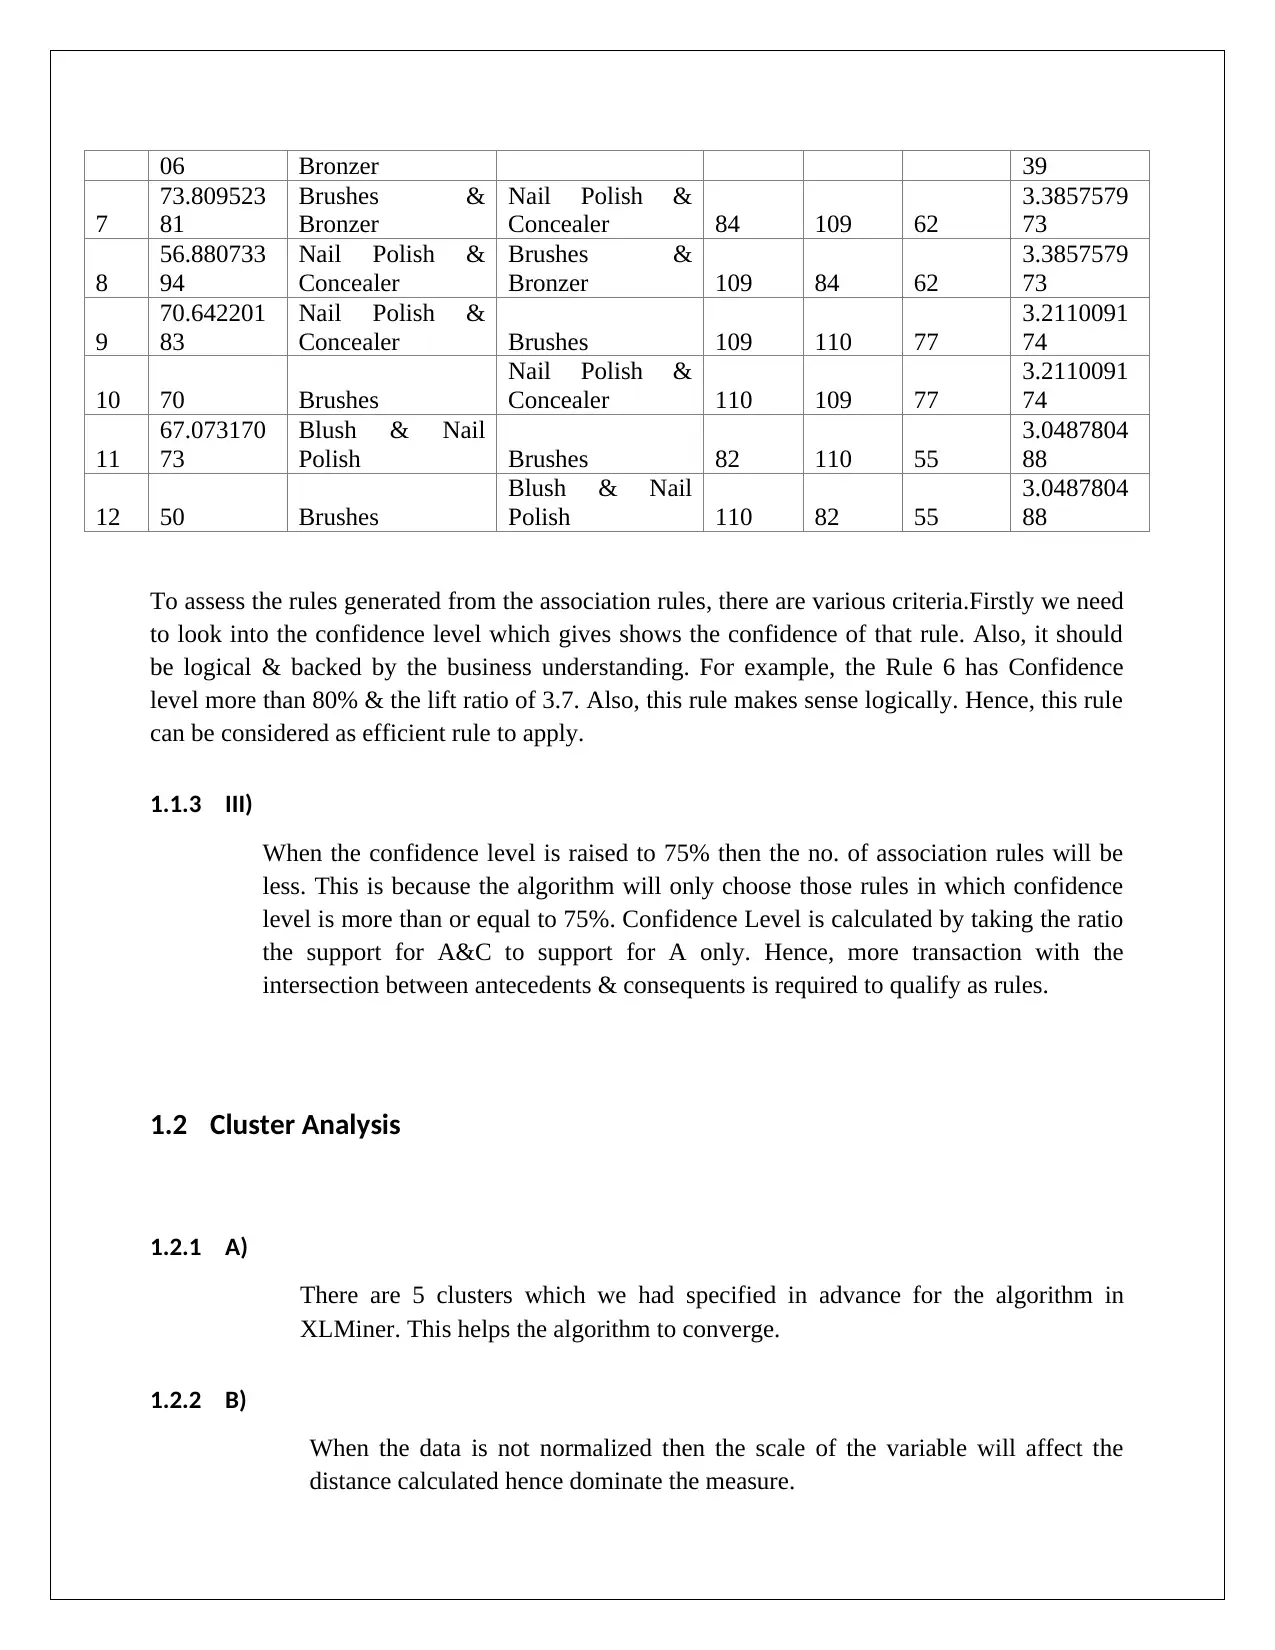
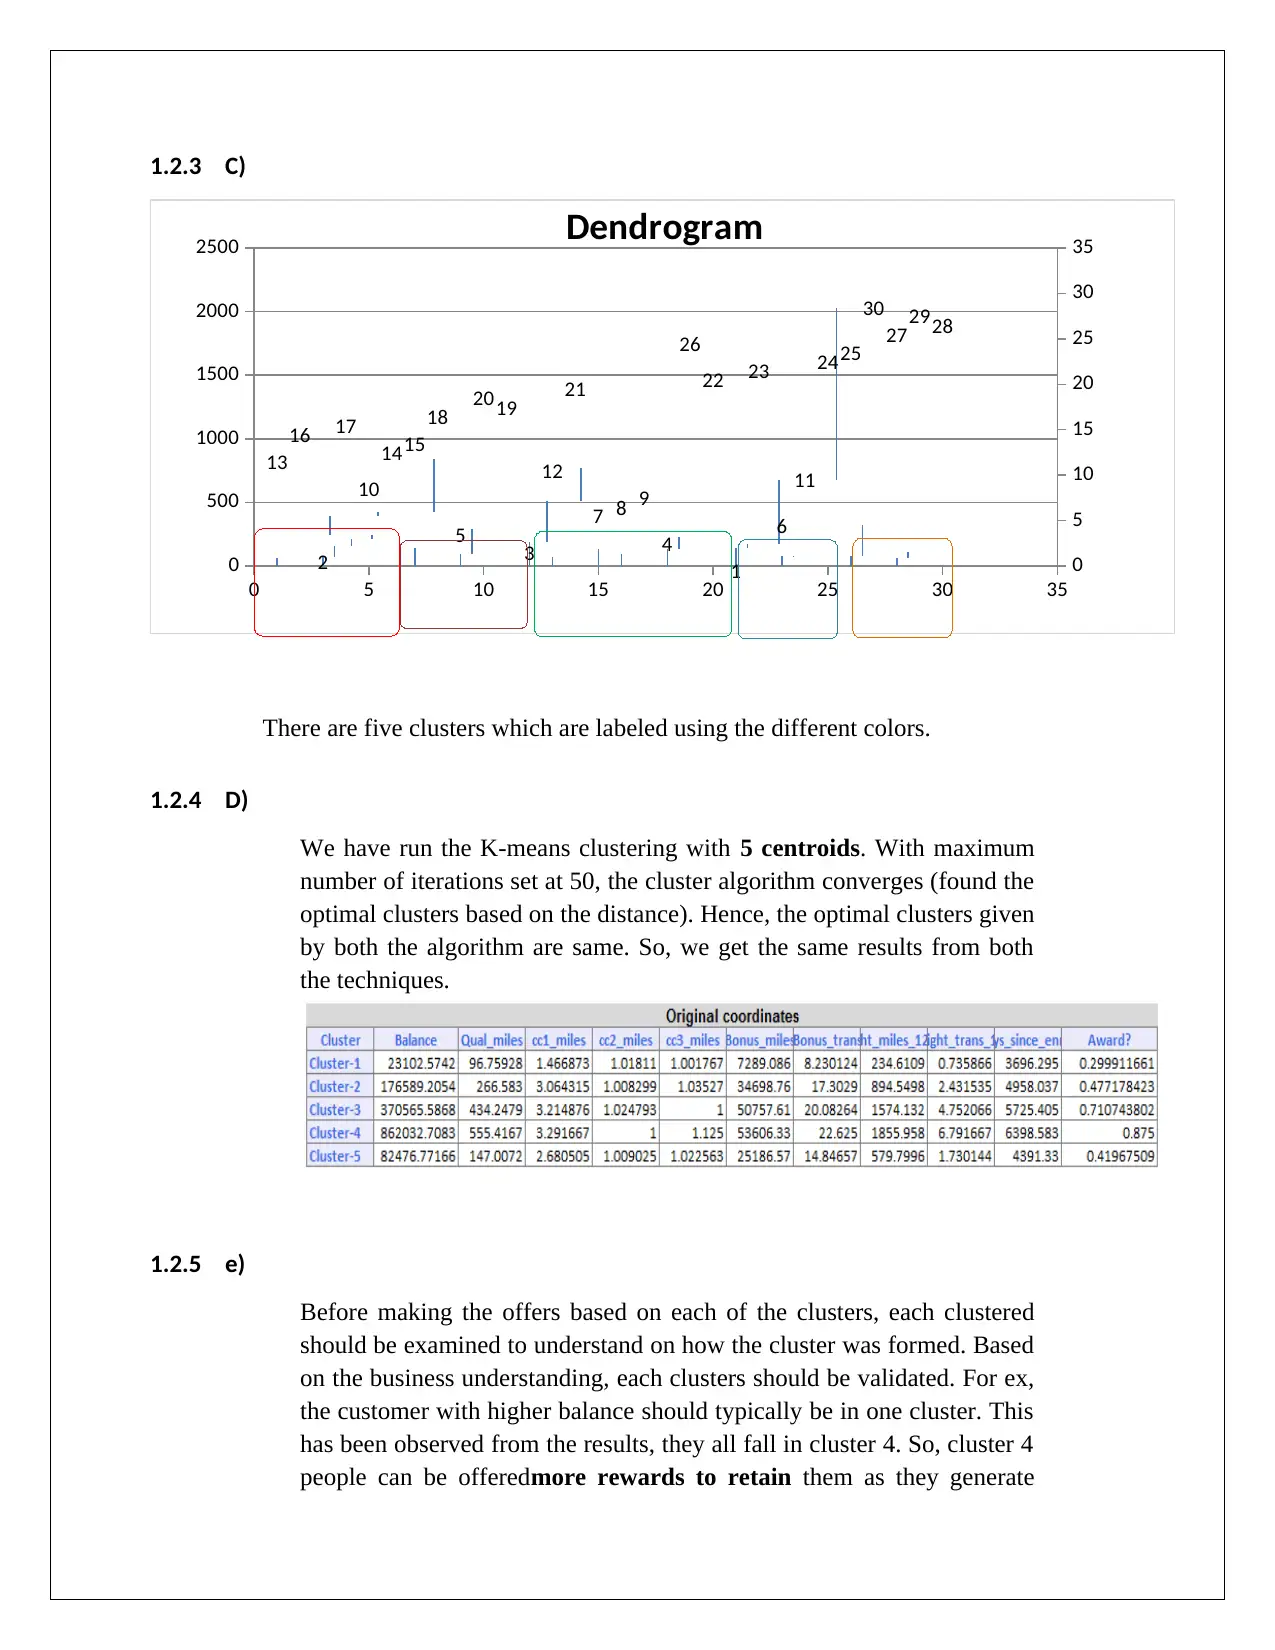
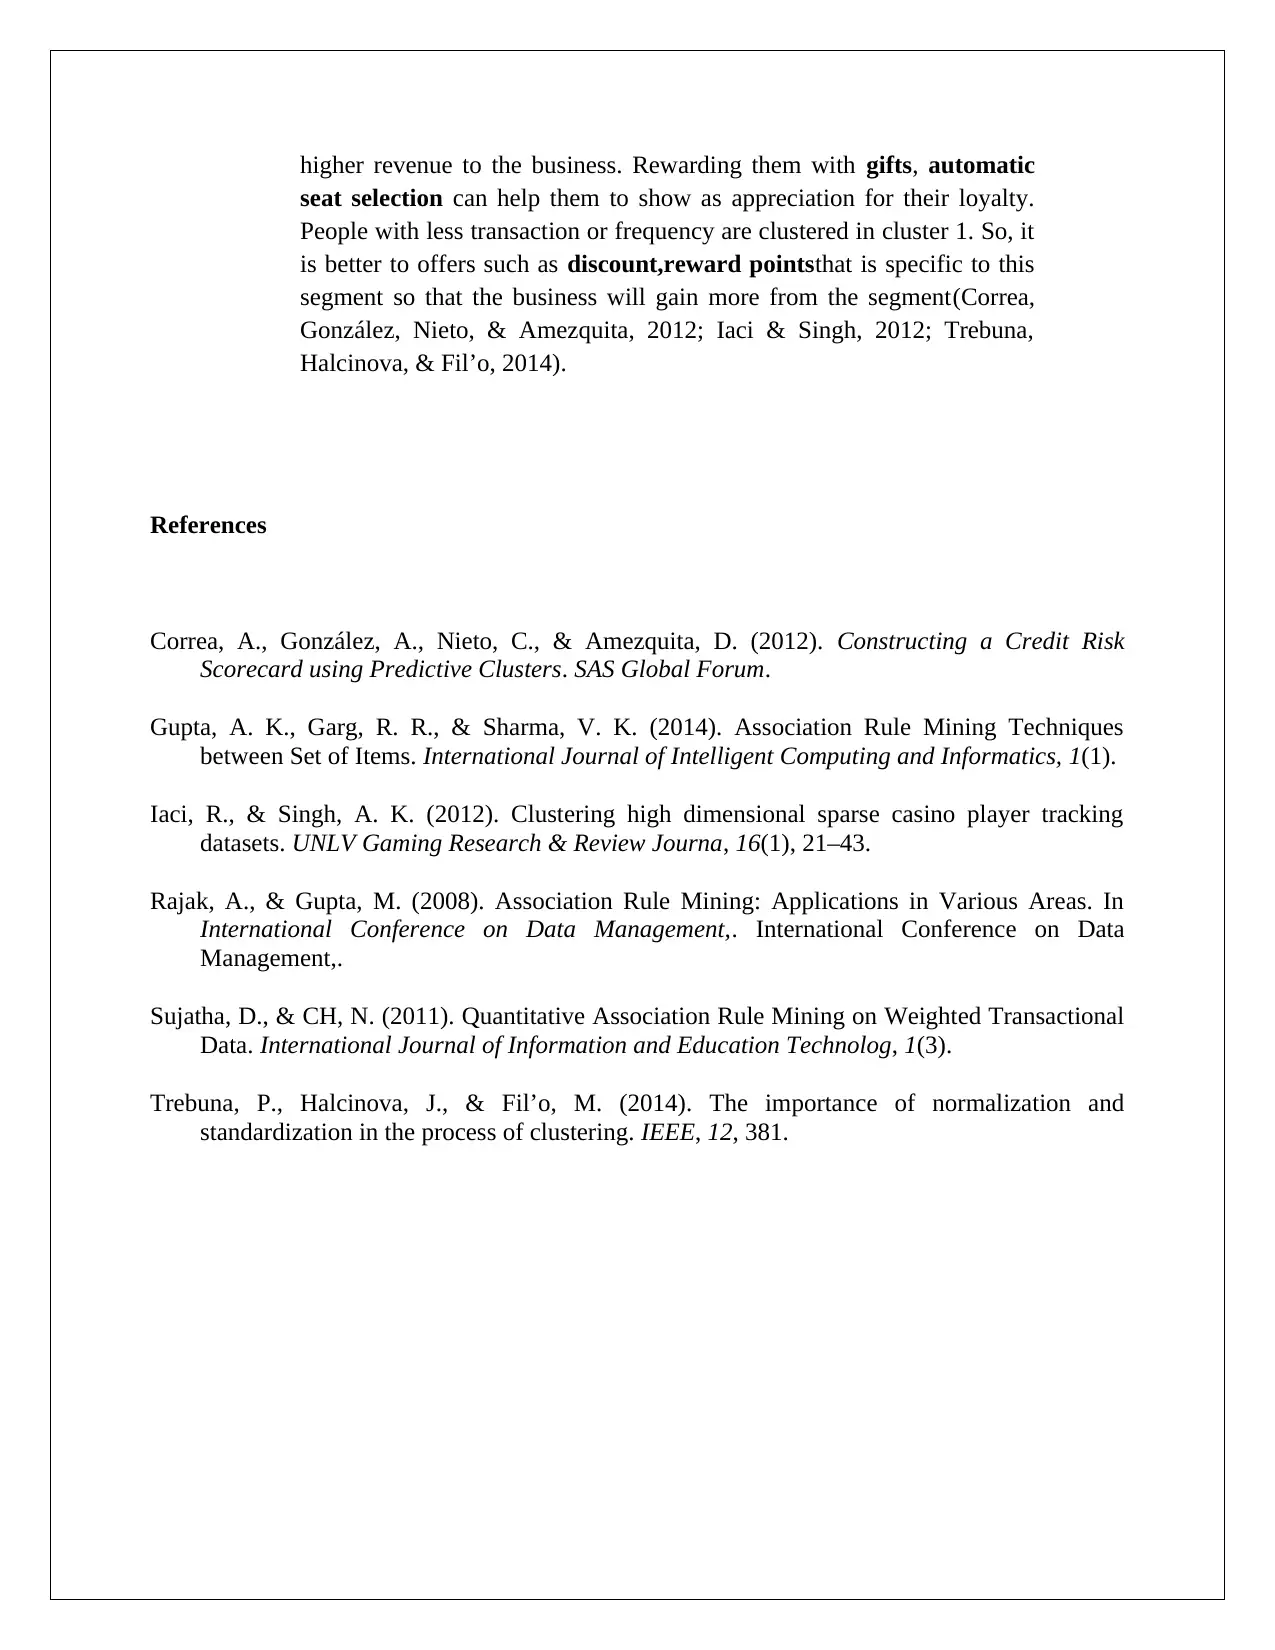
This assignment explores data mining and visualization techniques for business intelligence. It covers association rules, including concepts like antecedents, consequents, confidence levels, and lift ratios, using examples to illustrate how these rules can be applied to understand customer purchasing behavior. The assignment also delves into cluster analysis, specifically K-means clustering, discussing the importance of data normalization, the interpretation of clusters, and how clustered data can inform business decisions such as targeted marketing offers and customer retention strategies. The analysis is supported by references to relevant literature in the field of data mining and business intelligence.
Document Page
Data Mining and Visualization for Business Intelligence
Assignment - 3
[Pick the date]
Student Name
Contents
1.1 Association Rules........................................................................................................................2
1.1.1 I)...........................................................................................................................................2
1.1.2 II)..........................................................................................................................................3
1.1.3 III).........................................................................................................................................4
1.2 Cluster Analysis............................................................................................................................4
1.2.1 A).........................................................................................................................................4
tabler-icon-diamond-filled.svg

Paraphrase This Document

Need a fresh take? Get an instant paraphrase of this document with our AI Paraphraser
Document Page
1.2.2 B)..........................................................................................................................................4
1.2.3 C)..........................................................................................................................................4
1.2.4 D).........................................................................................................................................5
1.2.5 e)..........................................................................................................................................5
Ro
w
ID
Confidence
%
Antecedent
(A)
Consequen
t (C)
Suppor
t for A
Suppor
t for C
Suppor
t for A
& C Lift Ratio
1
80.5194805
2
Brushes &
Concealer
Nail Polish
& Bronzer 77 103 62
3.90871264
7
2
60.1941747
6
Nail Polish &
Bronzer
Brushes &
Concealer 103 77 62
3.90871264
7
3
81.5789473
7
Nail Polish &
Concealer &
Bronzer Brushes 76 110 62
3.70813397
1
1.1 Association Rules
1.1.1 I)
Antecedent is an observation found in the data, consequent is an item which is found
in combination with the antecedent. Rule 1 state that if a customer purchase brushes
& concealer together, then with 80% confidence Nail Polish & bronzer will be
bought. The support here for event A happening is 77 which means the no. of
transaction that supports for A. While transaction that supports the event C are 103.
The event A & C happened together is 62 times. The lift ratio indicates the likelihood
Document Page
of purchasing Brushes, Concealer, and Nail Polish & Bronzer in comparison to the
entire transaction.
Similarly the Rule 2 states when the customer buy Nail Polish & Bronzer , they also
buy Brushes & Concealer with the support for event A happening is 103 and support
for event C happening is 77. This rule is completely opposite of the first rule,
therefore the lift ratio is same, though the confidence level for Rule 2 is less.
Rule 3 states that if a customer buy nail polish, concealer & bronzer together then
they also tends to buy brushes with 81% confidence level (Gupta, Garg, & Sharma,
2014; Rajak & Gupta, 2008; Sujatha & CH, 2011).
1.1.2 II)
Ro
w
ID
Confidenc
e % Antecedent (A) Consequent (C)
Suppo
rt for
A
Suppo
rt for
C
Suppor
t for A
& C Lift Ratio
1
80.519480
52
Brushes &
Concealer
Nail Polish &
Bronzer 77 103 62
3.9087126
47
2
60.194174
76
Nail Polish &
Bronzer
Brushes &
Concealer 103 77 62
3.9087126
47
3
81.578947
37
Nail Polish &
Concealer &
Bronzer Brushes 76 110 62
3.7081339
71
4
56.363636
36 Brushes
Nail Polish &
Concealer &
Bronzer 110 76 62
3.7081339
71
5
76.363636
36 Brushes
Nail Polish &
Bronzer 110 103 84
3.7069726
39
6 81.553398 Nail Polish & Brushes 103 110 84 3.7069726
Document Page
06 Bronzer 39
7
73.809523
81
Brushes &
Bronzer
Nail Polish &
Concealer 84 109 62
3.3857579
73
8
56.880733
94
Nail Polish &
Concealer
Brushes &
Bronzer 109 84 62
3.3857579
73
9
70.642201
83
Nail Polish &
Concealer Brushes 109 110 77
3.2110091
74
10 70 Brushes
Nail Polish &
Concealer 110 109 77
3.2110091
74
11
67.073170
73
Blush & Nail
Polish Brushes 82 110 55
3.0487804
88
12 50 Brushes
Blush & Nail
Polish 110 82 55
3.0487804
88
To assess the rules generated from the association rules, there are various criteria.Firstly we need
to look into the confidence level which gives shows the confidence of that rule. Also, it should
be logical & backed by the business understanding. For example, the Rule 6 has Confidence
level more than 80% & the lift ratio of 3.7. Also, this rule makes sense logically. Hence, this rule
can be considered as efficient rule to apply.
1.1.3 III)
When the confidence level is raised to 75% then the no. of association rules will be
less. This is because the algorithm will only choose those rules in which confidence
level is more than or equal to 75%. Confidence Level is calculated by taking the ratio
the support for A&C to support for A only. Hence, more transaction with the
intersection between antecedents & consequents is required to qualify as rules.
1.2 Cluster Analysis
1.2.1 A)
There are 5 clusters which we had specified in advance for the algorithm in
XLMiner. This helps the algorithm to converge.
1.2.2 B)
When the data is not normalized then the scale of the variable will affect the
distance calculated hence dominate the measure.
tabler-icon-diamond-filled.svg

Paraphrase This Document

Need a fresh take? Get an instant paraphrase of this document with our AI Paraphraser
Document Page
1.2.3 C)
0 5 10 15 20 25 30 35
0
500
1000
1500
2000
2500
0
5
10
15
20
25
30
35
13
16
2
17
10
1415
18
5
2019
3
12
21
7 8 9
4
26
22
1
23
6
11
2425
30
272928
Dendrogram
There are five clusters which are labeled using the different colors.
1.2.4 D)
We have run the K-means clustering with 5 centroids. With maximum
number of iterations set at 50, the cluster algorithm converges (found the
optimal clusters based on the distance). Hence, the optimal clusters given
by both the algorithm are same. So, we get the same results from both
the techniques.
1.2.5 e)
Before making the offers based on each of the clusters, each clustered
should be examined to understand on how the cluster was formed. Based
on the business understanding, each clusters should be validated. For ex,
the customer with higher balance should typically be in one cluster. This
has been observed from the results, they all fall in cluster 4. So, cluster 4
people can be offeredmore rewards to retain them as they generate
Document Page
higher revenue to the business. Rewarding them with gifts, automatic
seat selection can help them to show as appreciation for their loyalty.
People with less transaction or frequency are clustered in cluster 1. So, it
is better to offers such as discount,reward pointsthat is specific to this
segment so that the business will gain more from the segment(Correa,
González, Nieto, & Amezquita, 2012; Iaci & Singh, 2012; Trebuna,
Halcinova, & Fil’o, 2014).
References
Correa, A., González, A., Nieto, C., & Amezquita, D. (2012). Constructing a Credit Risk
Scorecard using Predictive Clusters. SAS Global Forum.
Gupta, A. K., Garg, R. R., & Sharma, V. K. (2014). Association Rule Mining Techniques
between Set of Items. International Journal of Intelligent Computing and Informatics, 1(1).
Iaci, R., & Singh, A. K. (2012). Clustering high dimensional sparse casino player tracking
datasets. UNLV Gaming Research & Review Journa, 16(1), 21–43.
Rajak, A., & Gupta, M. (2008). Association Rule Mining: Applications in Various Areas. In
International Conference on Data Management,. International Conference on Data
Management,.
Sujatha, D., & CH, N. (2011). Quantitative Association Rule Mining on Weighted Transactional
Data. International Journal of Information and Education Technolog, 1(3).
Trebuna, P., Halcinova, J., & Fil’o, M. (2014). The importance of normalization and
standardization in the process of clustering. IEEE, 12, 381.
chevron_up_icon
1 out of 6
circle_padding
hide_on_mobile
zoom_out_icon
[object Object]