Data Mining Assignment on Association Rules and Clustering Analysis
VerifiedAdded on 2020/03/04
|4
|991
|208
Homework Assignment
AI Summary
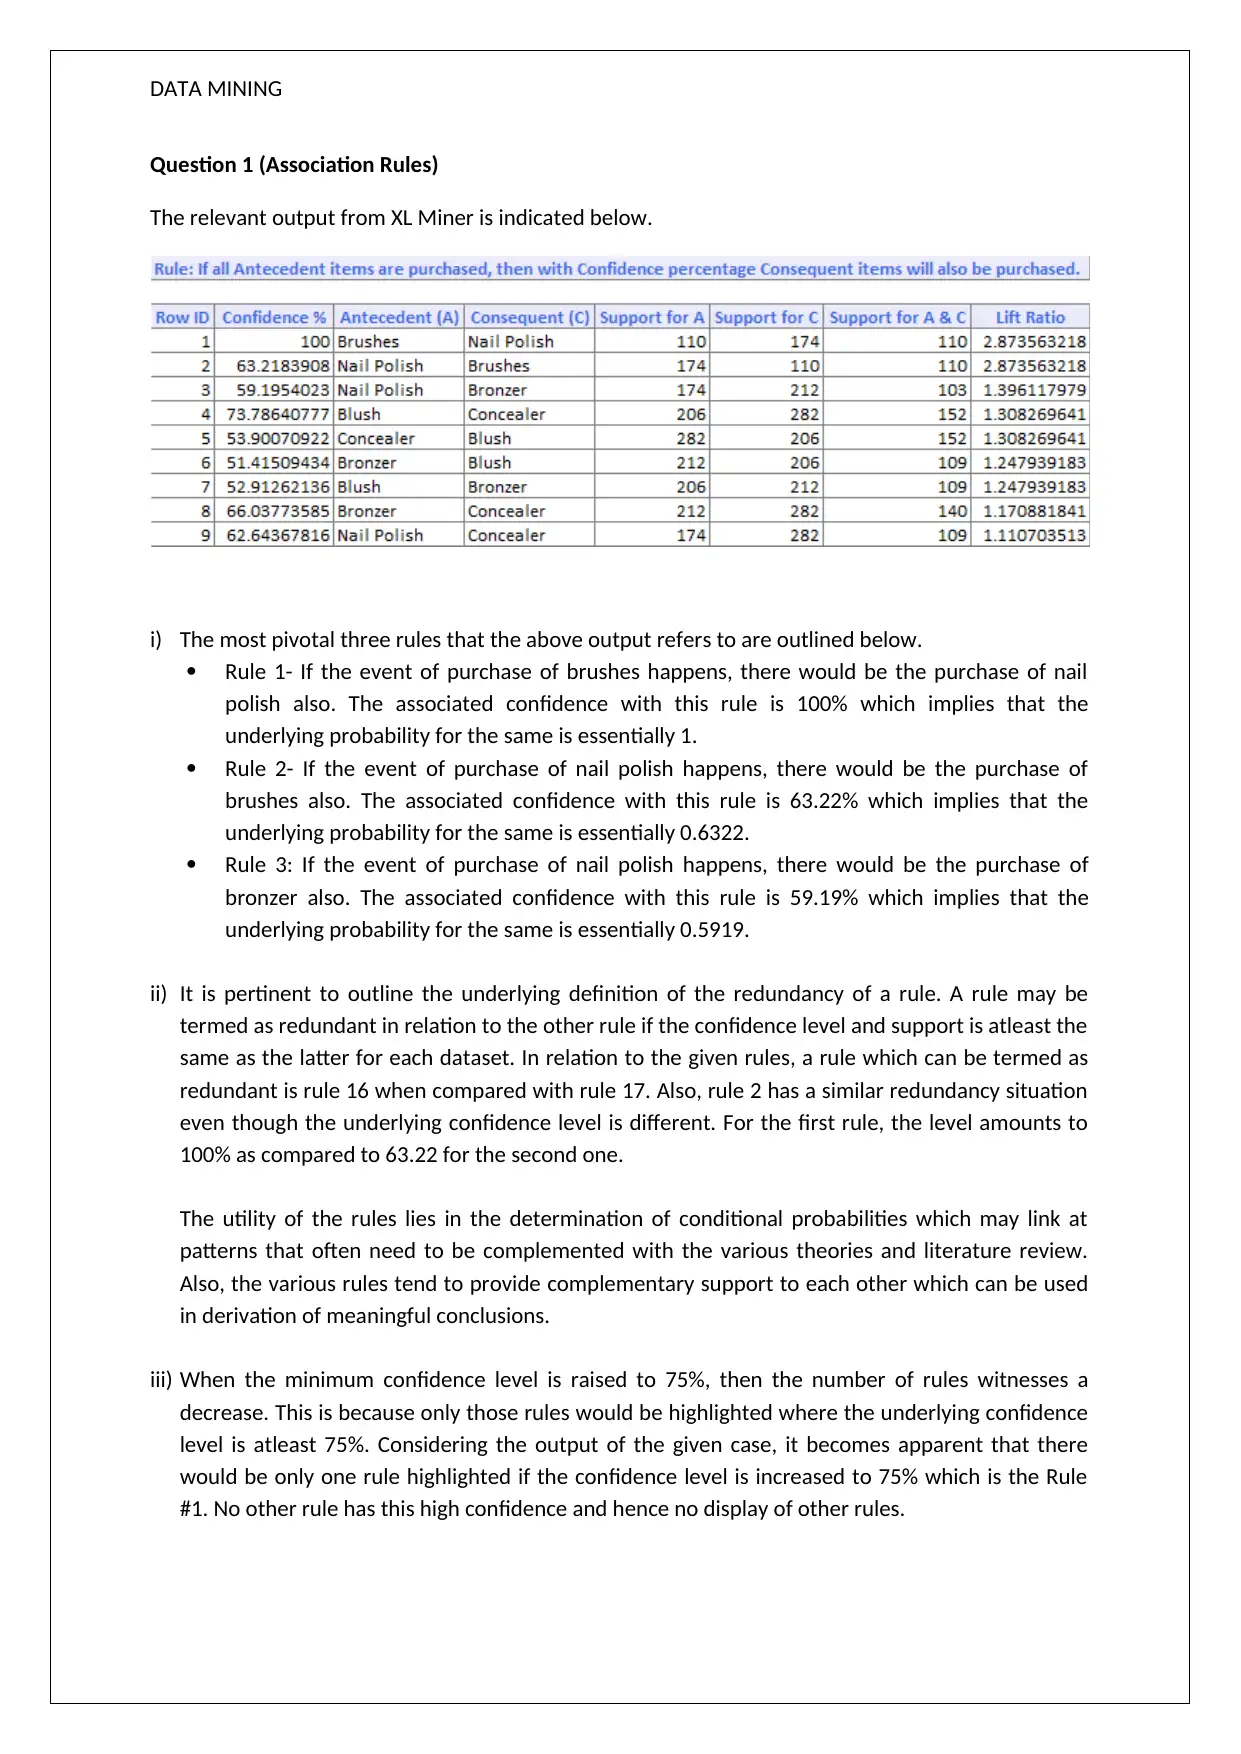
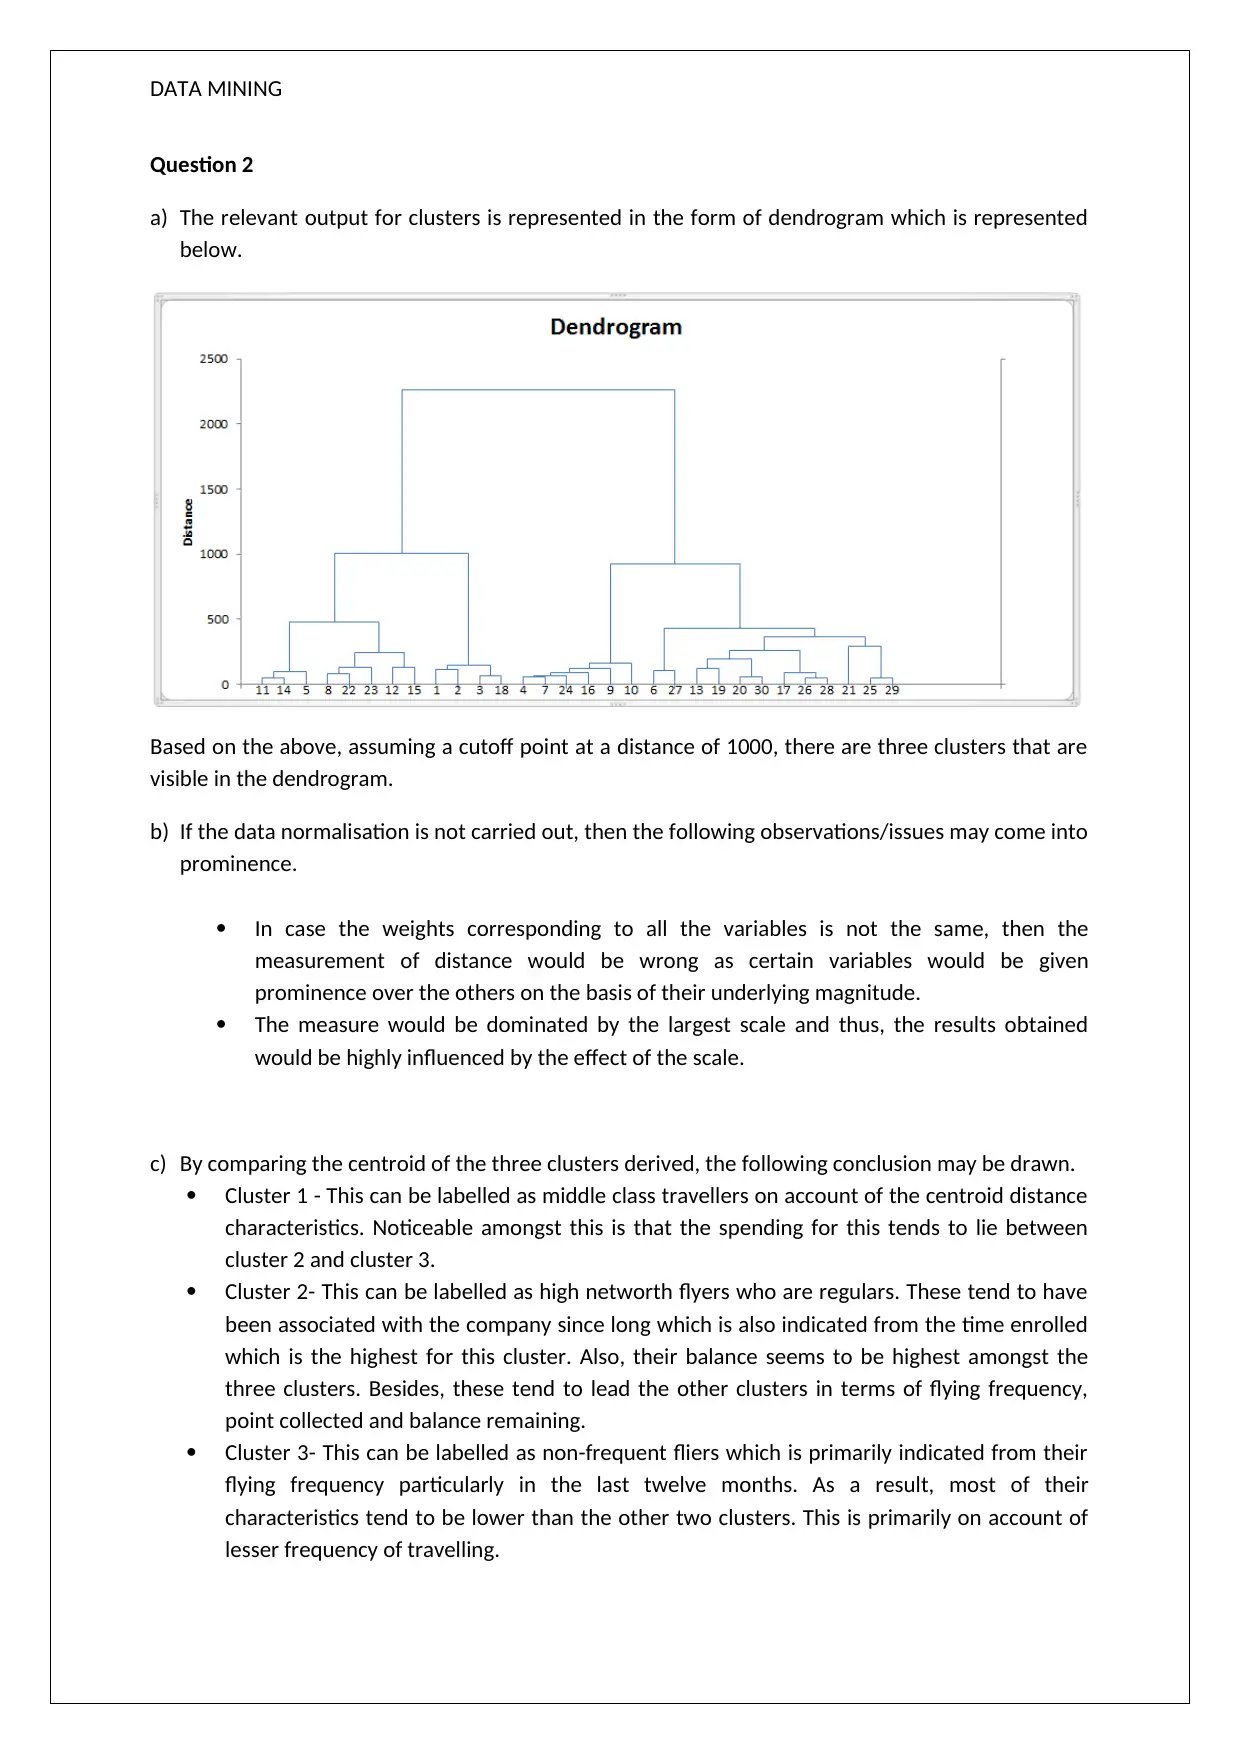
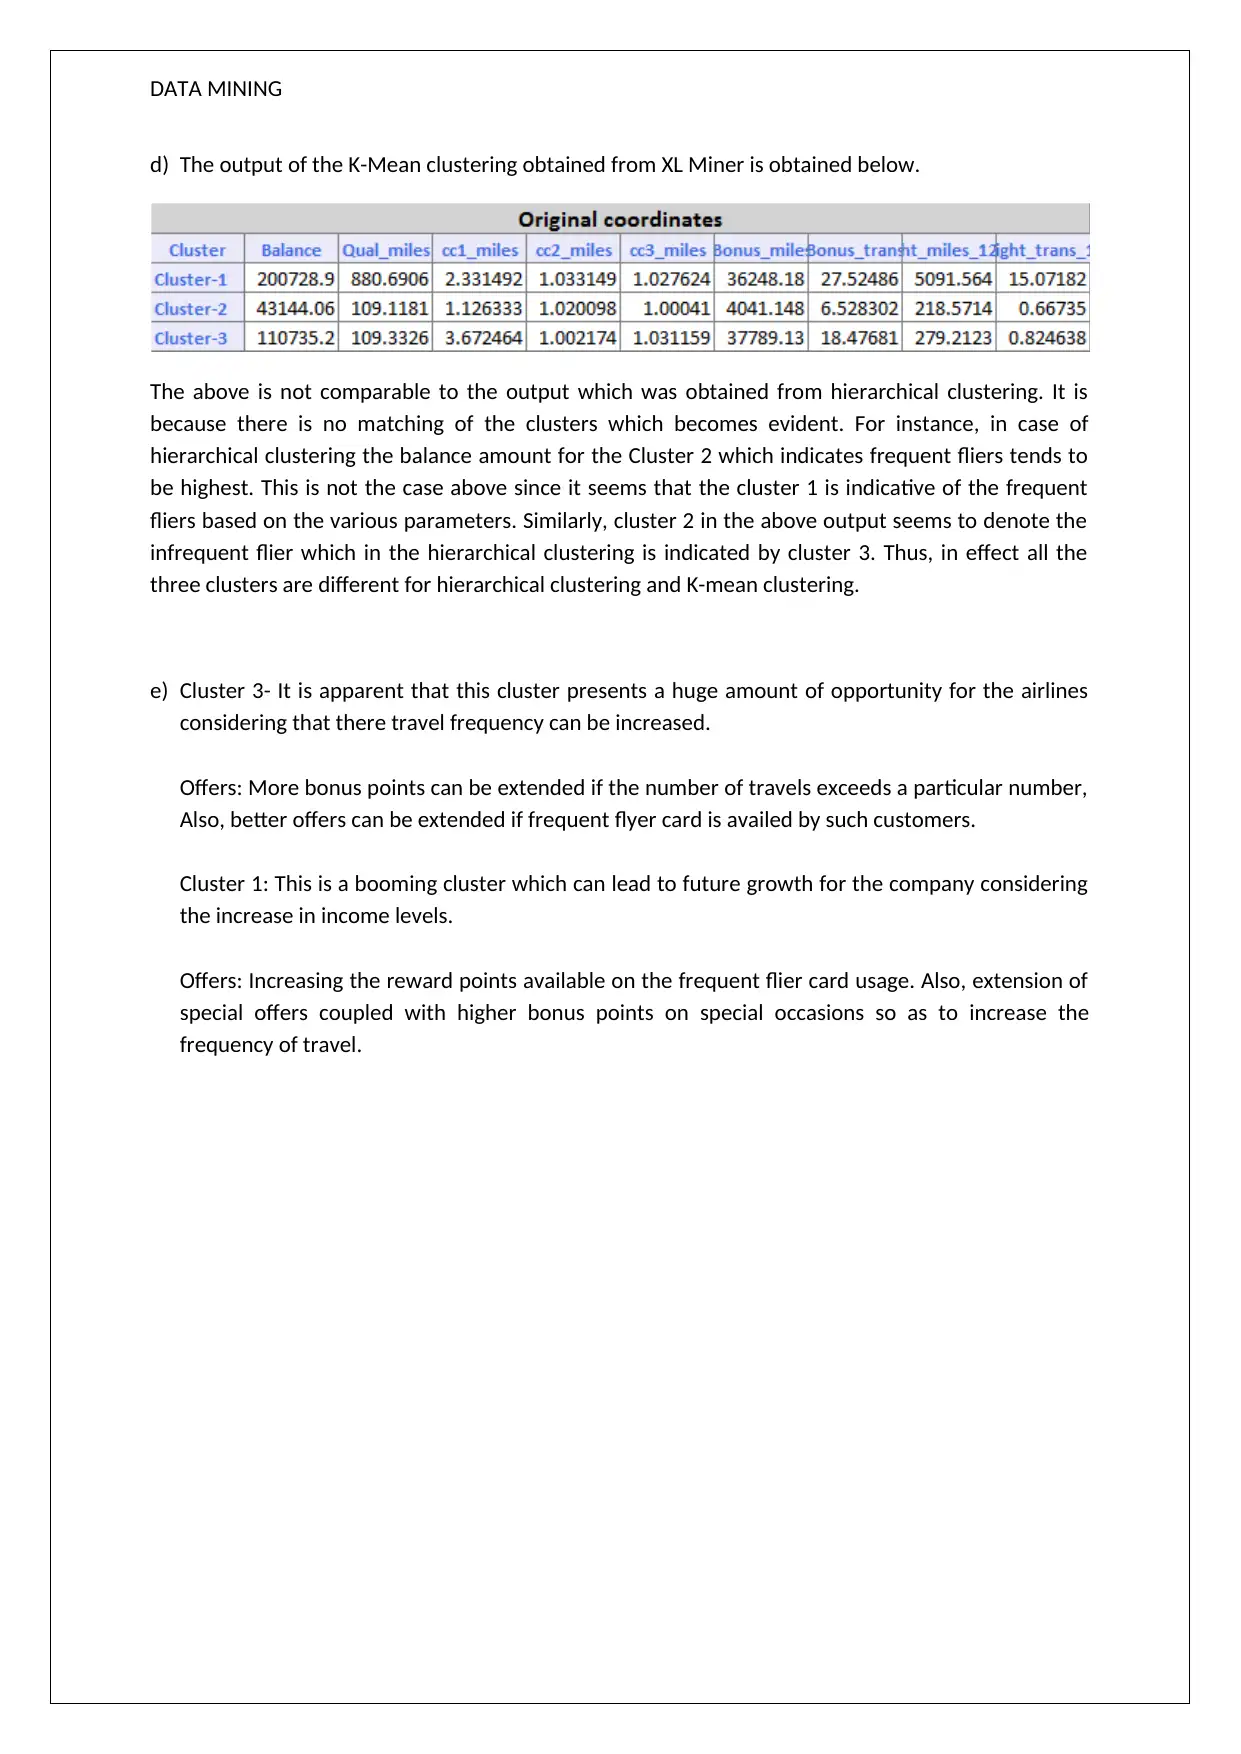
This data mining assignment explores association rules and clustering techniques using XL Miner. The solution analyzes three pivotal association rules, discussing their confidence and redundancy. It then delves into hierarchical clustering, interpreting a dendrogram to identify three clusters base...

DATA MINING
STUDENT ID:
[Pick the date]
STUDENT ID:
[Pick the date]
Paraphrase This Document
Need a fresh take? Get an instant paraphrase of this document with our AI Paraphraser

DATA MINING
Question 1 (Association Rules)
The relevant output from XL Miner is indicated below.
i) The most pivotal three rules that the above output refers to are outlined below.
Rule 1- If the event of purchase of brushes happens, there would be the purchase of nail
polish also. The associated confidence with this rule is 100% which implies that the
underlying probability for the same is essentially 1.
Rule 2- If the event of purchase of nail polish happens, there would be the purchase of
brushes also. The associated confidence with this rule is 63.22% which implies that the
underlying probability for the same is essentially 0.6322.
Rule 3: If the event of purchase of nail polish happens, there would be the purchase of
bronzer also. The associated confidence with this rule is 59.19% which implies that the
underlying probability for the same is essentially 0.5919.
ii) It is pertinent to outline the underlying definition of the redundancy of a rule. A rule may be
termed as redundant in relation to the other rule if the confidence level and support is atleast the
same as the latter for each dataset. In relation to the given rules, a rule which can be termed as
redundant is rule 16 when compared with rule 17. Also, rule 2 has a similar redundancy situation
even though the underlying confidence level is different. For the first rule, the level amounts to
100% as compared to 63.22 for the second one.
The utility of the rules lies in the determination of conditional probabilities which may link at
patterns that often need to be complemented with the various theories and literature review.
Also, the various rules tend to provide complementary support to each other which can be used
in derivation of meaningful conclusions.
iii) When the minimum confidence level is raised to 75%, then the number of rules witnesses a
decrease. This is because only those rules would be highlighted where the underlying confidence
level is atleast 75%. Considering the output of the given case, it becomes apparent that there
would be only one rule highlighted if the confidence level is increased to 75% which is the Rule
#1. No other rule has this high confidence and hence no display of other rules.

DATA MINING
Question 2
a) The relevant output for clusters is represented in the form of dendrogram which is represented
below.
Based on the above, assuming a cutoff point at a distance of 1000, there are three clusters that are
visible in the dendrogram.
b) If the data normalisation is not carried out, then the following observations/issues may come into
prominence.
In case the weights corresponding to all the variables is not the same, then the
measurement of distance would be wrong as certain variables would be given
prominence over the others on the basis of their underlying magnitude.
The measure would be dominated by the largest scale and thus, the results obtained
would be highly influenced by the effect of the scale.
c) By comparing the centroid of the three clusters derived, the following conclusion may be drawn.
Cluster 1 - This can be labelled as middle class travellers on account of the centroid distance
characteristics. Noticeable amongst this is that the spending for this tends to lie between
cluster 2 and cluster 3.
Cluster 2- This can be labelled as high networth flyers who are regulars. These tend to have
been associated with the company since long which is also indicated from the time enrolled
which is the highest for this cluster. Also, their balance seems to be highest amongst the
three clusters. Besides, these tend to lead the other clusters in terms of flying frequency,
point collected and balance remaining.
Cluster 3- This can be labelled as non-frequent fliers which is primarily indicated from their
flying frequency particularly in the last twelve months. As a result, most of their
characteristics tend to be lower than the other two clusters. This is primarily on account of
lesser frequency of travelling.
⊘ This is a preview!⊘
Do you want full access?
Subscribe today to unlock all pages.

Trusted by 1+ million students worldwide

DATA MINING
d) The output of the K-Mean clustering obtained from XL Miner is obtained below.
The above is not comparable to the output which was obtained from hierarchical clustering. It is
because there is no matching of the clusters which becomes evident. For instance, in case of
hierarchical clustering the balance amount for the Cluster 2 which indicates frequent fliers tends to
be highest. This is not the case above since it seems that the cluster 1 is indicative of the frequent
fliers based on the various parameters. Similarly, cluster 2 in the above output seems to denote the
infrequent flier which in the hierarchical clustering is indicated by cluster 3. Thus, in effect all the
three clusters are different for hierarchical clustering and K-mean clustering.
e) Cluster 3- It is apparent that this cluster presents a huge amount of opportunity for the airlines
considering that there travel frequency can be increased.
Offers: More bonus points can be extended if the number of travels exceeds a particular number,
Also, better offers can be extended if frequent flyer card is availed by such customers.
Cluster 1: This is a booming cluster which can lead to future growth for the company considering
the increase in income levels.
Offers: Increasing the reward points available on the frequent flier card usage. Also, extension of
special offers coupled with higher bonus points on special occasions so as to increase the
frequency of travel.
1 out of 4
Related Documents

Your All-in-One AI-Powered Toolkit for Academic Success.
+13062052269
info@desklib.com
Available 24*7 on WhatsApp / Email
Unlock your academic potential
© 2024 | Zucol Services PVT LTD | All rights reserved.