Data Mining and Visualization Assignment II - Data Analysis and Report
VerifiedAdded on 2020/04/01
|10
|789
|188
Homework Assignment
AI Summary
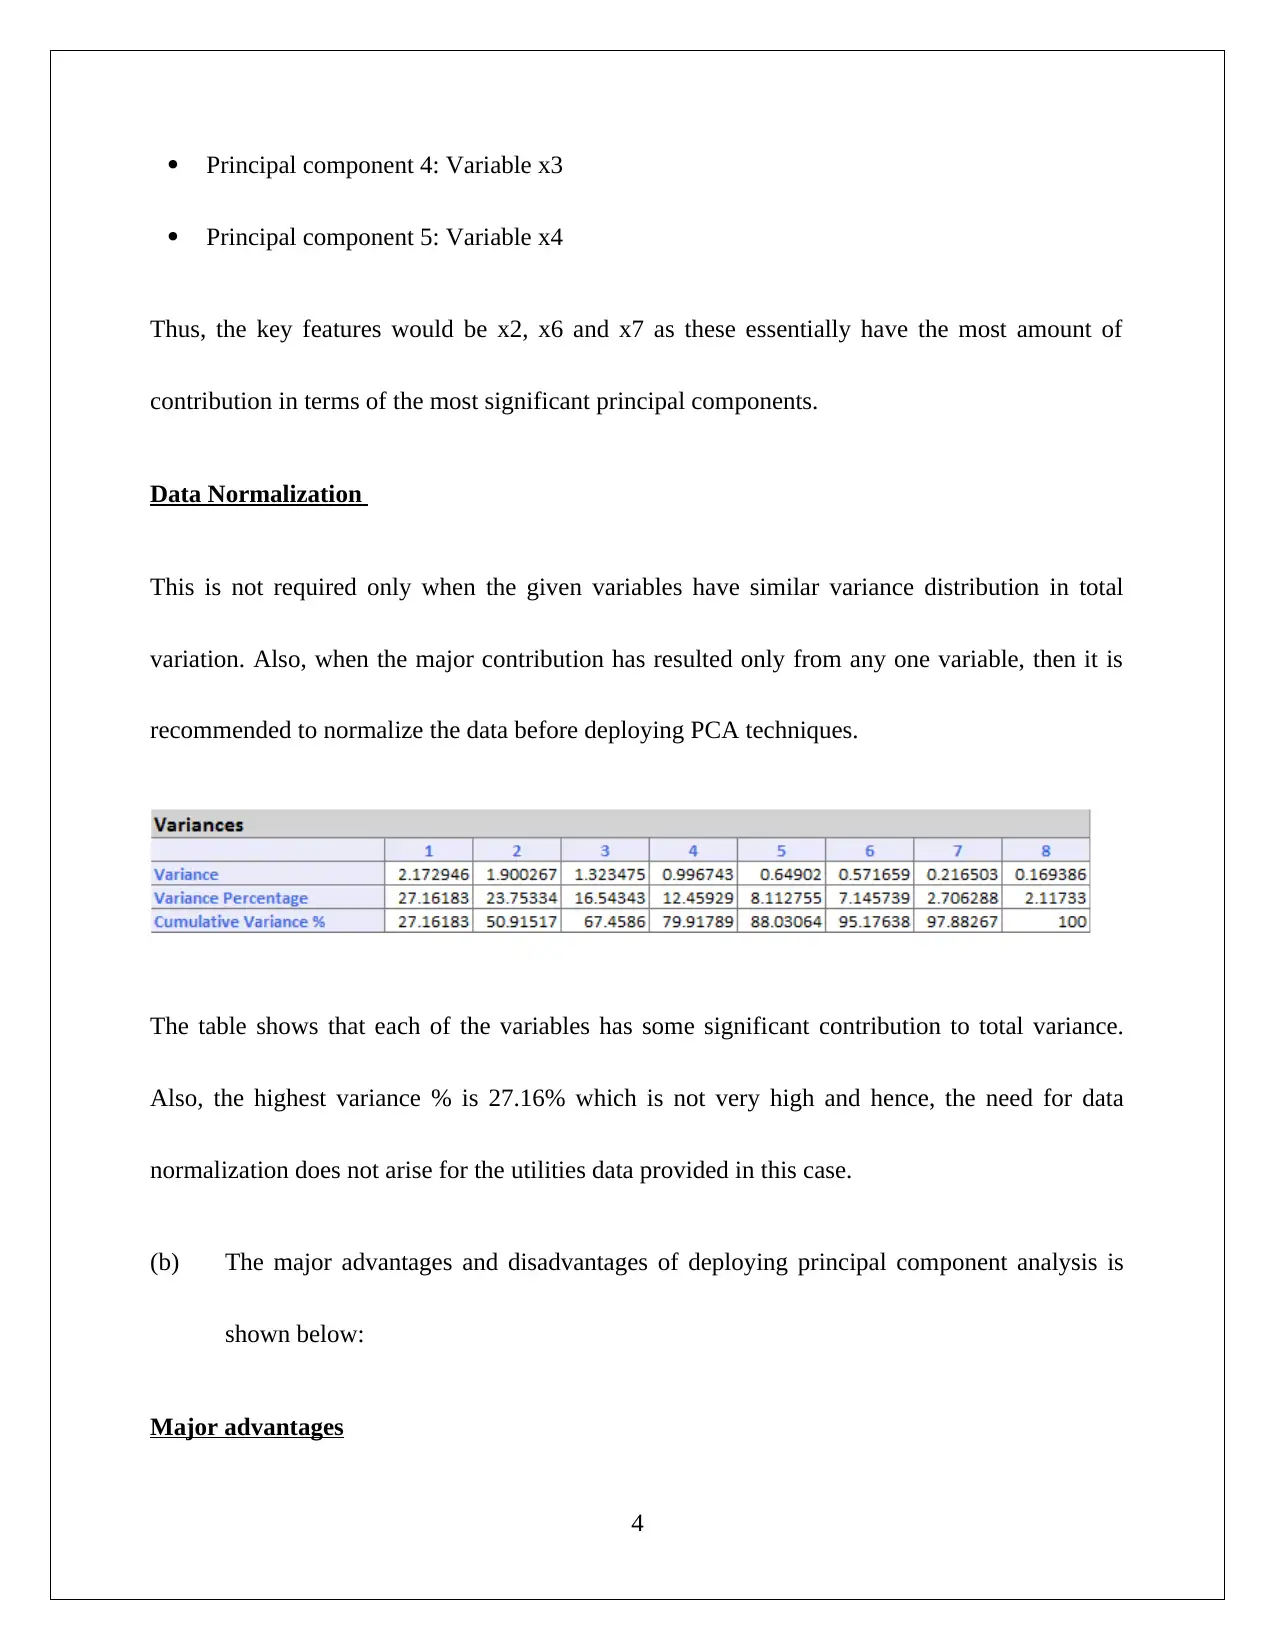
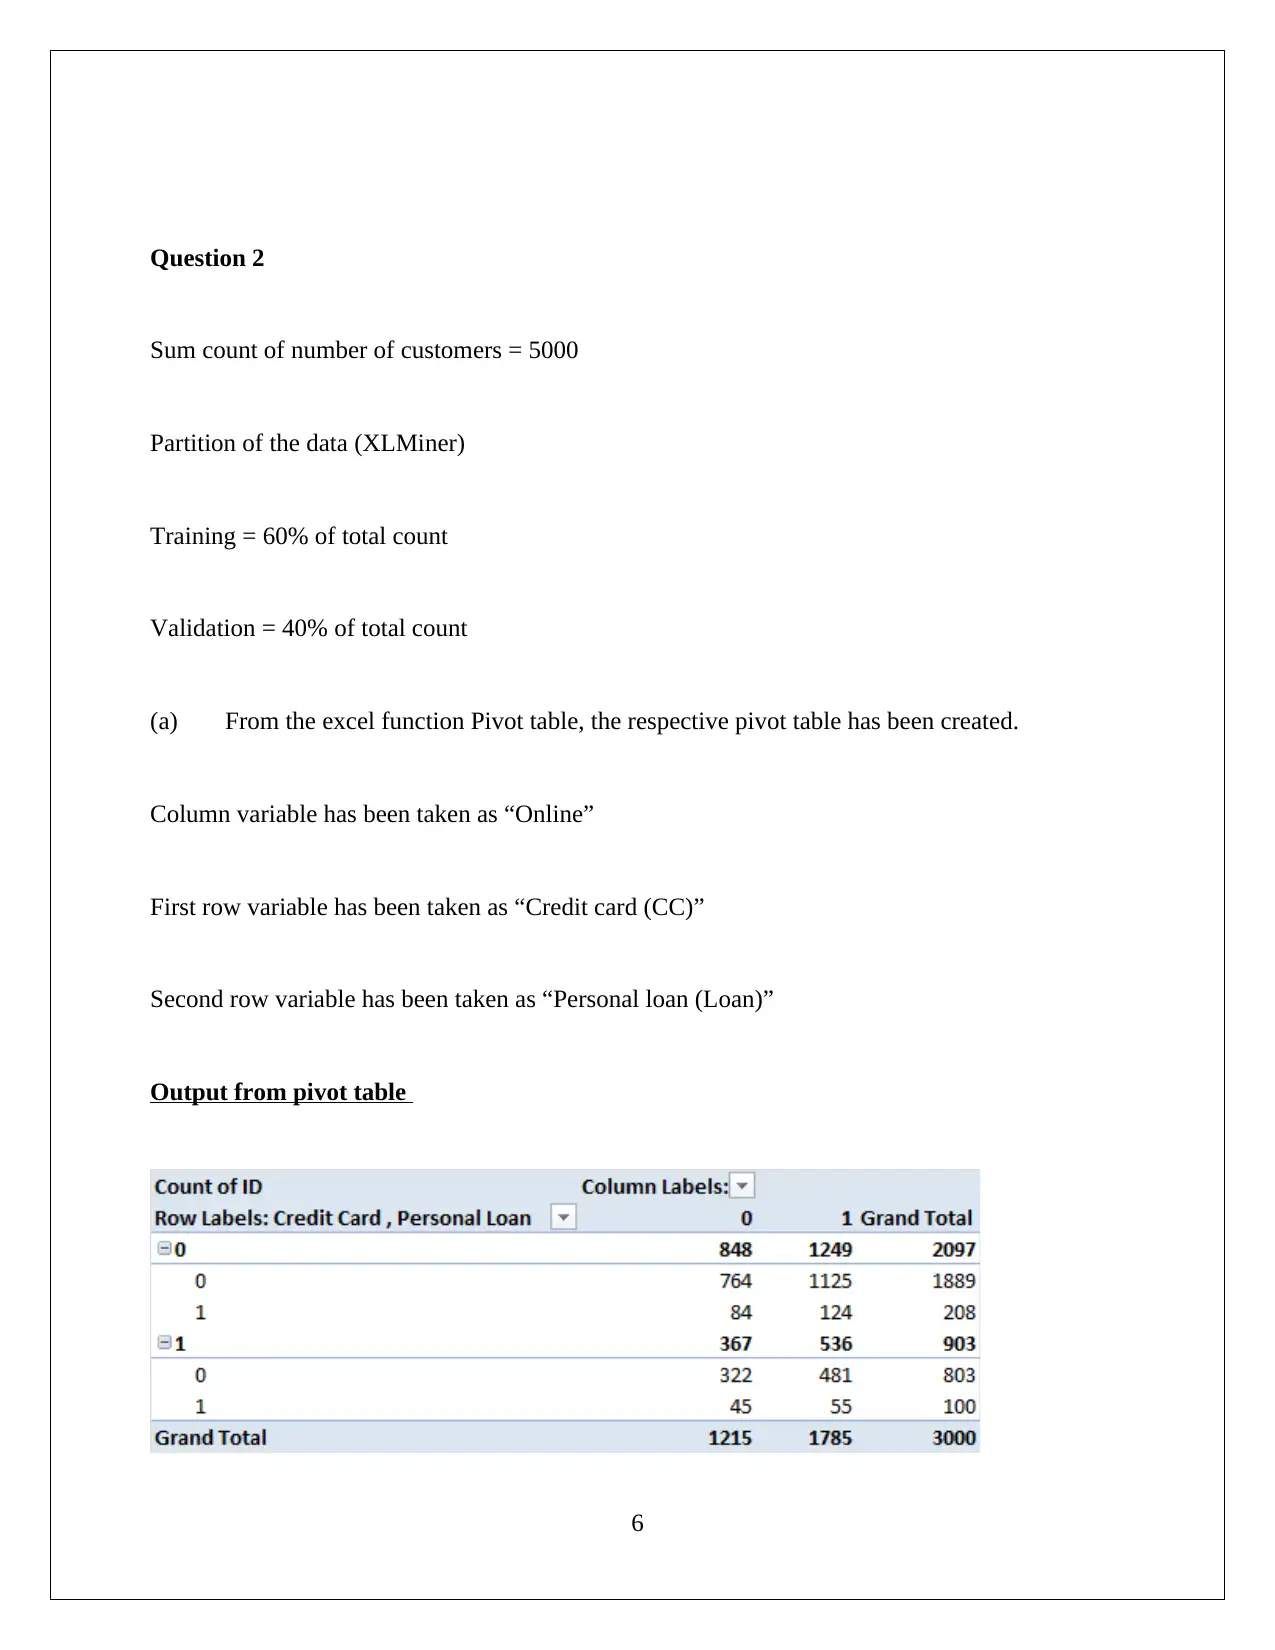
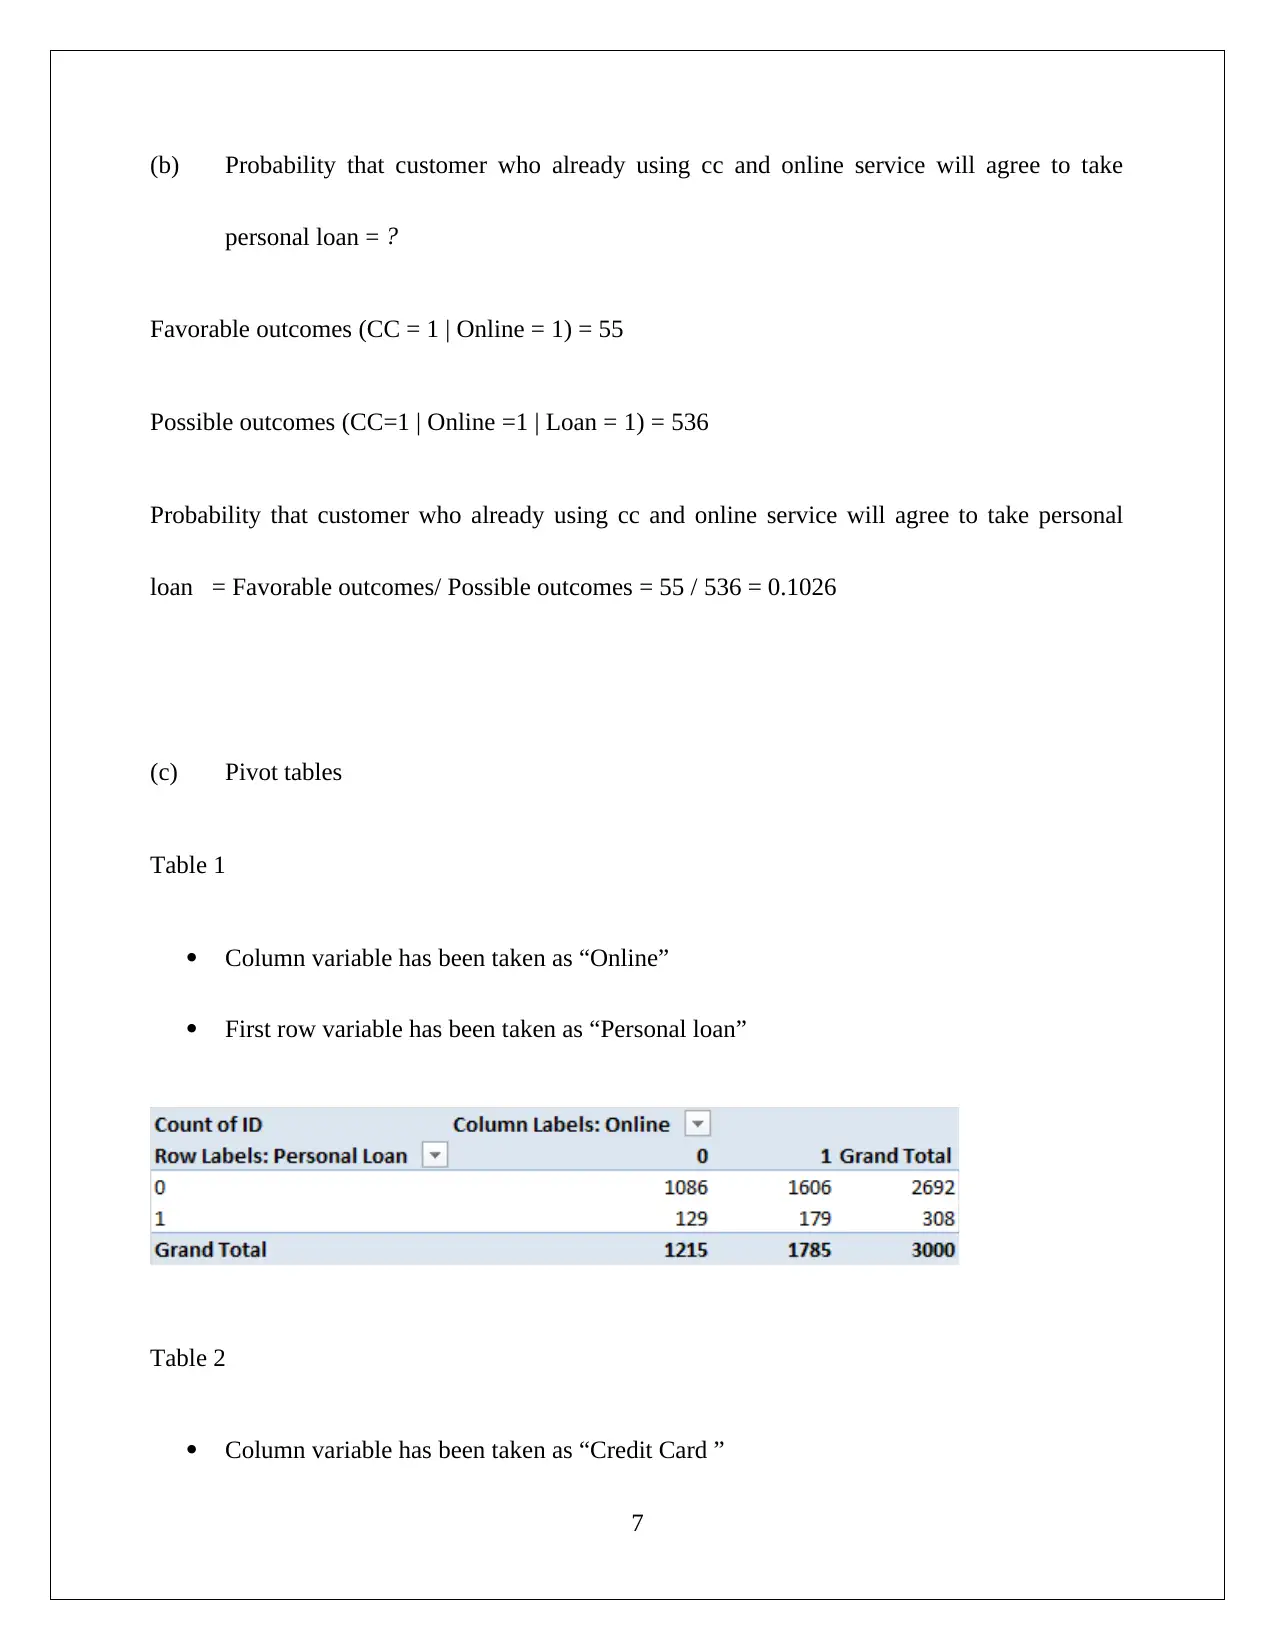
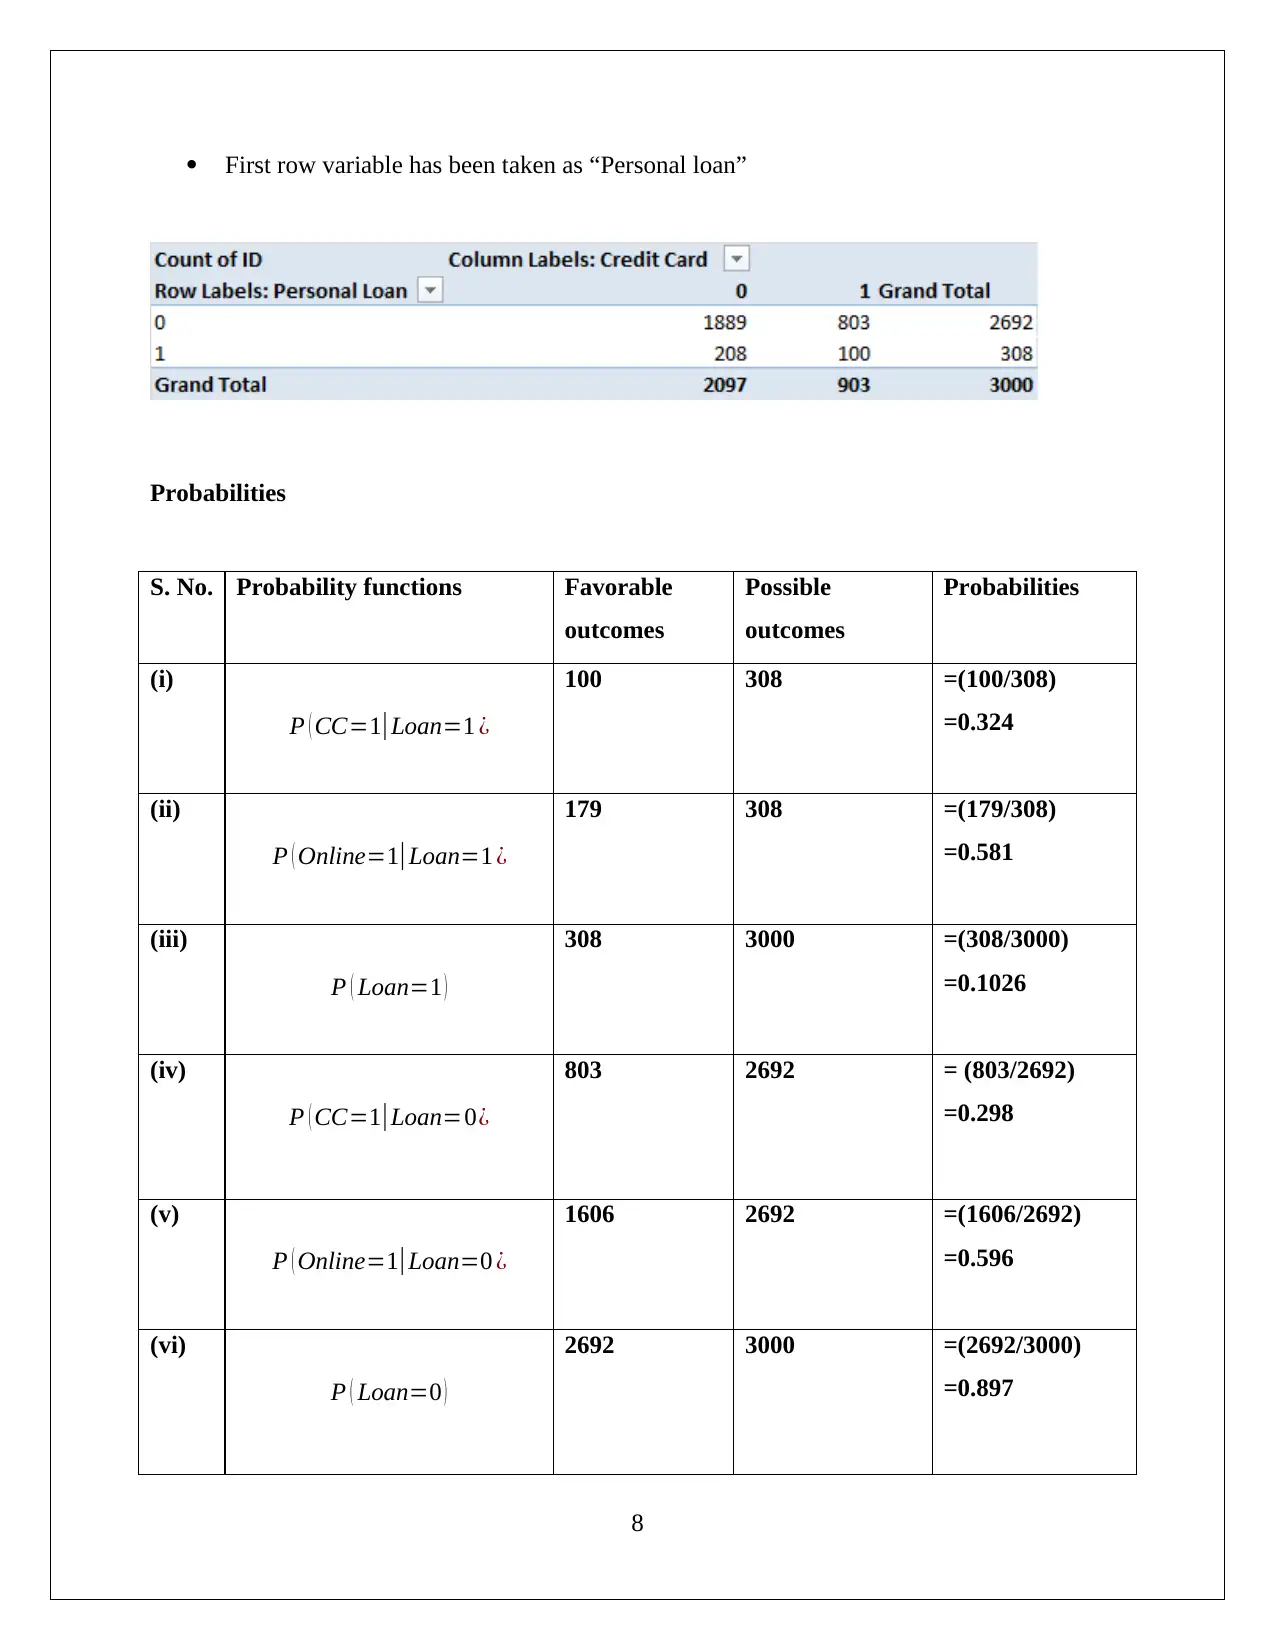
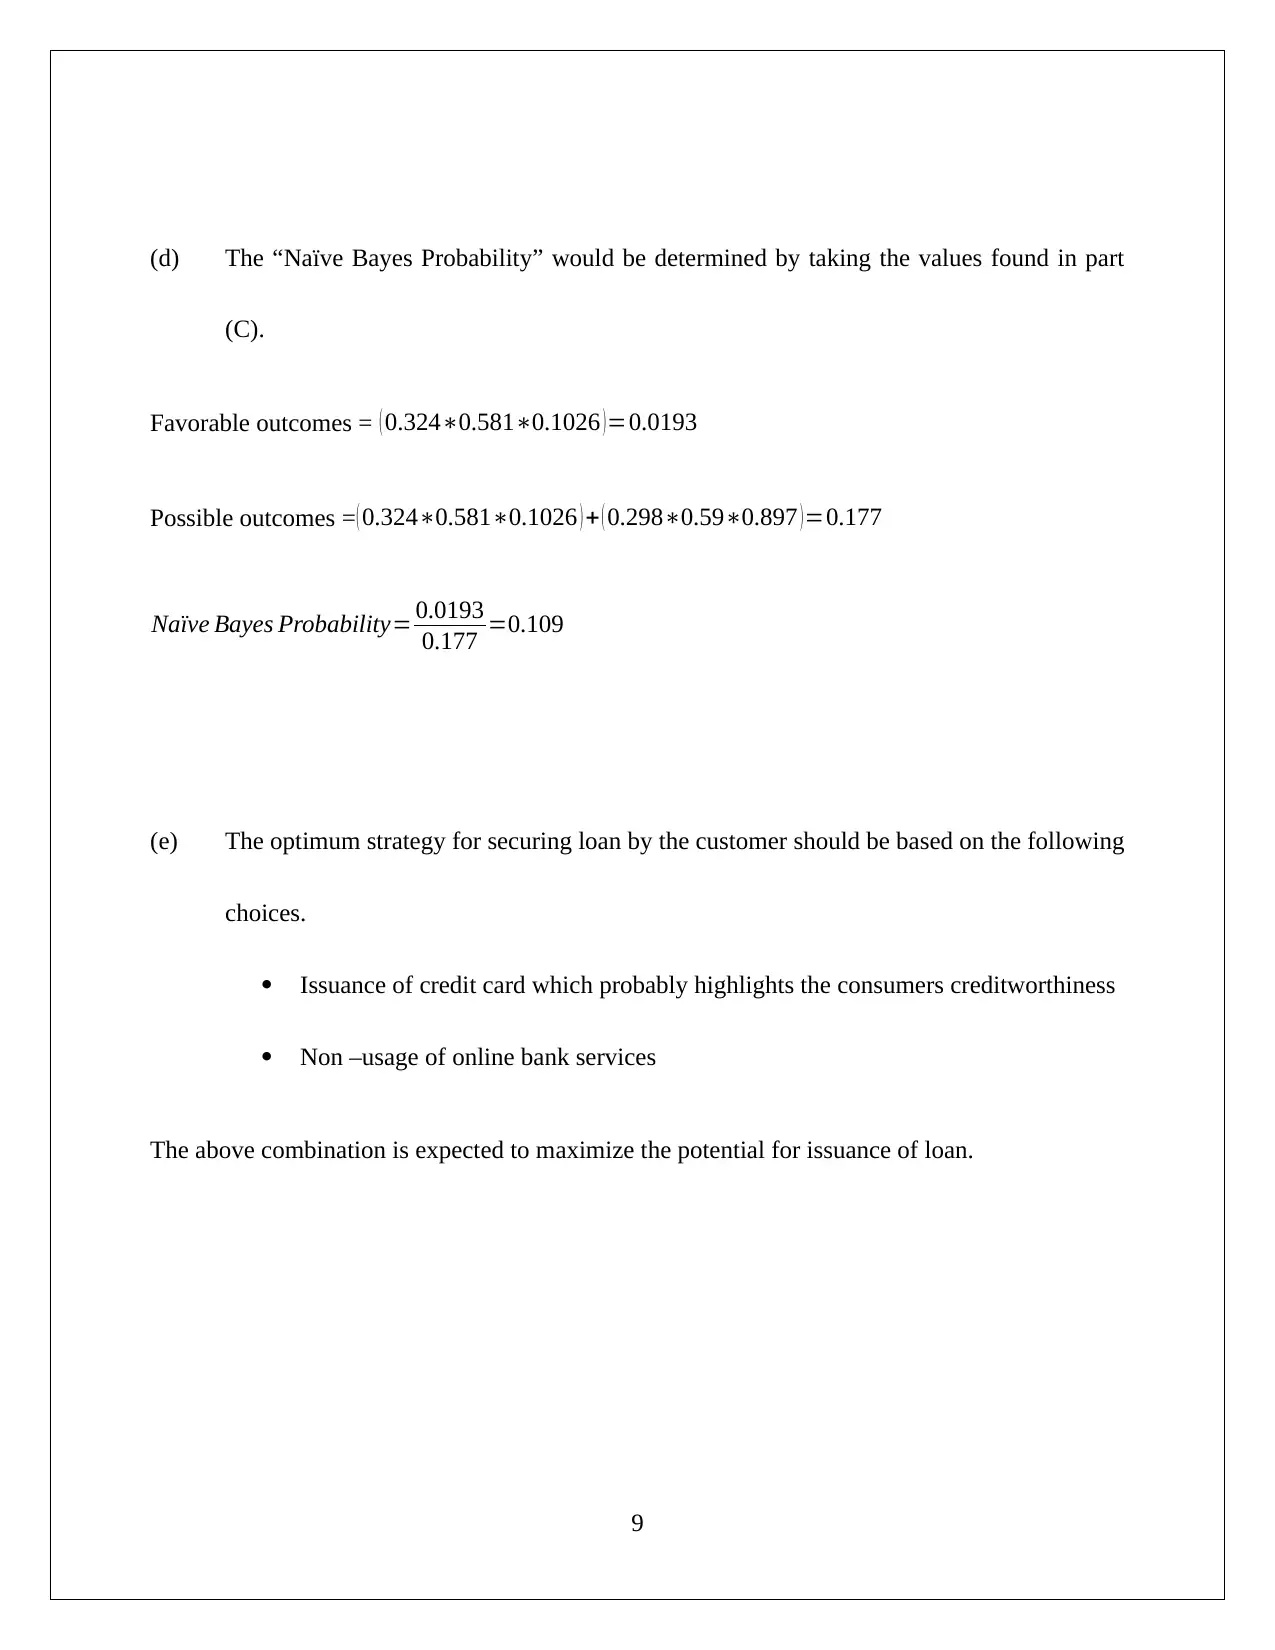
This data mining and visualization assignment solution addresses two key questions. The first question focuses on Principal Component Analysis (PCA) applied to eight variables, analyzing variance, selecting key variables (x2, x6, and x7), and discussing the need for data normalization along with advantages and disadvantages of PCA. The second question involves customer data, calculating probabilities using pivot tables and the Naive Bayes method to determine the likelihood of customers taking personal loans based on credit card usage and online banking. The solution concludes with strategic recommendations for maximizing loan issuance, emphasizing credit card issuance and non-usage of online banking services. The solution uses XLMiner and Excel pivot tables for analysis and probability calculations.

DATA MINING AND VISUALIZATION
ASSIGNMENT –II
Student Id & Name
[Pick the date]
ASSIGNMENT –II
Student Id & Name
[Pick the date]
Paraphrase This Document
Need a fresh take? Get an instant paraphrase of this document with our AI Paraphraser

Question 1
Data
Variable description
(a) The principal component analysis for the given eight variables has been accomplished by
XLMiner.
1
Data
Variable description
(a) The principal component analysis for the given eight variables has been accomplished by
XLMiner.
1

Comment on Result
After considering the values of variances of all the eight principal components, it would be fair
to say that nearly 88% of the variance has derived from the top initial five principal components.
Therefore, it is required to ignore the noise principal components i.e. the components which have
low variances. These are the principal components denoted by 6, 7, and 8.
2
⊘ This is a preview!⊘
Do you want full access?
Subscribe today to unlock all pages.

Trusted by 1+ million students worldwide

The new PCA matrix
Selection of key variables
By considering the variances of the principal components, the key features have been determined
and are shown below:
Principal component 1: Variable x2
Principal component 2: Variable x6
Principal component 3: Variable x7
3
Selection of key variables
By considering the variances of the principal components, the key features have been determined
and are shown below:
Principal component 1: Variable x2
Principal component 2: Variable x6
Principal component 3: Variable x7
3
Paraphrase This Document
Need a fresh take? Get an instant paraphrase of this document with our AI Paraphraser

Principal component 4: Variable x3
Principal component 5: Variable x4
Thus, the key features would be x2, x6 and x7 as these essentially have the most amount of
contribution in terms of the most significant principal components.
Data Normalization
This is not required only when the given variables have similar variance distribution in total
variation. Also, when the major contribution has resulted only from any one variable, then it is
recommended to normalize the data before deploying PCA techniques.
The table shows that each of the variables has some significant contribution to total variance.
Also, the highest variance % is 27.16% which is not very high and hence, the need for data
normalization does not arise for the utilities data provided in this case.
(b) The major advantages and disadvantages of deploying principal component analysis is
shown below:
Major advantages
4

Highly complex set of data can be simplified through the transformation into coordinates
Visualization can be done easily because the data set can be expressed in the m- dimensional
space
Easy to analyze the result because the data is in the form of orthogonal structure
Major disadvantages
It has very limited use for understanding and analyzing non-linear associations
It cannot be applied when the data distribution does not have definite variances and mean
values
PCA usages the high variances components only and rejects the components which has low
variances. However, sometimes rejected components has imperative role in the analysis.
At times, PCA cannot determine direction of the actual maximum variances and thus,
Independent Component Analysis (ICA) would be taken into account.
5
⊘ This is a preview!⊘
Do you want full access?
Subscribe today to unlock all pages.

Trusted by 1+ million students worldwide

Question 2
Sum count of number of customers = 5000
Partition of the data (XLMiner)
Training = 60% of total count
Validation = 40% of total count
(a) From the excel function Pivot table, the respective pivot table has been created.
Column variable has been taken as “Online”
First row variable has been taken as “Credit card (CC)”
Second row variable has been taken as “Personal loan (Loan)”
Output from pivot table
6
Paraphrase This Document
Need a fresh take? Get an instant paraphrase of this document with our AI Paraphraser

(b) Probability that customer who already using cc and online service will agree to take
personal loan = ?
Favorable outcomes (CC = 1 | Online = 1) = 55
Possible outcomes (CC=1 | Online =1 | Loan = 1) = 536
Probability that customer who already using cc and online service will agree to take personal
loan = Favorable outcomes/ Possible outcomes = 55 / 536 = 0.1026
(c) Pivot tables
Table 1
Column variable has been taken as “Online”
First row variable has been taken as “Personal loan”
Table 2
Column variable has been taken as “Credit Card ”
7

First row variable has been taken as “Personal loan”
Probabilities
S. No. Probability functions Favorable
outcomes
Possible
outcomes
Probabilities
(i)
P ( CC=1| Loan=1 ¿
100 308 =(100/308)
=0.324
(ii)
P ( Online=1|Loan=1 ¿
179 308 =(179/308)
=0.581
(iii)
P ( Loan=1 )
308 3000 =(308/3000)
=0.1026
(iv)
P ( CC=1|Loan=0¿
803 2692 = (803/2692)
=0.298
(v)
P ( Online=1|Loan=0 ¿
1606 2692 =(1606/2692)
=0.596
(vi)
P ( Loan=0 )
2692 3000 =(2692/3000)
=0.897
8
Probabilities
S. No. Probability functions Favorable
outcomes
Possible
outcomes
Probabilities
(i)
P ( CC=1| Loan=1 ¿
100 308 =(100/308)
=0.324
(ii)
P ( Online=1|Loan=1 ¿
179 308 =(179/308)
=0.581
(iii)
P ( Loan=1 )
308 3000 =(308/3000)
=0.1026
(iv)
P ( CC=1|Loan=0¿
803 2692 = (803/2692)
=0.298
(v)
P ( Online=1|Loan=0 ¿
1606 2692 =(1606/2692)
=0.596
(vi)
P ( Loan=0 )
2692 3000 =(2692/3000)
=0.897
8
⊘ This is a preview!⊘
Do you want full access?
Subscribe today to unlock all pages.

Trusted by 1+ million students worldwide

(d) The “Naïve Bayes Probability” would be determined by taking the values found in part
(C).
Favorable outcomes = ( 0.324∗0.581∗0.1026 )=0.0193
Possible outcomes =( 0.324∗0.581∗0.1026 ) + ( 0.298∗0.59∗0.897 )=0.177
Naïve Bayes Probability= 0.0193
0.177 =0.109
(e) The optimum strategy for securing loan by the customer should be based on the following
choices.
Issuance of credit card which probably highlights the consumers creditworthiness
Non –usage of online bank services
The above combination is expected to maximize the potential for issuance of loan.
9
1 out of 10
Related Documents

Your All-in-One AI-Powered Toolkit for Academic Success.
+13062052269
info@desklib.com
Available 24*7 on WhatsApp / Email
Unlock your academic potential
Copyright © 2020–2025 A2Z Services. All Rights Reserved. Developed and managed by ZUCOL.