Data Mining Assignment: XL Miner, Association Rules, and Clustering

Verified

Added on  2020/03/16

|9
|1131
|109
Homework Assignment
AI Summary
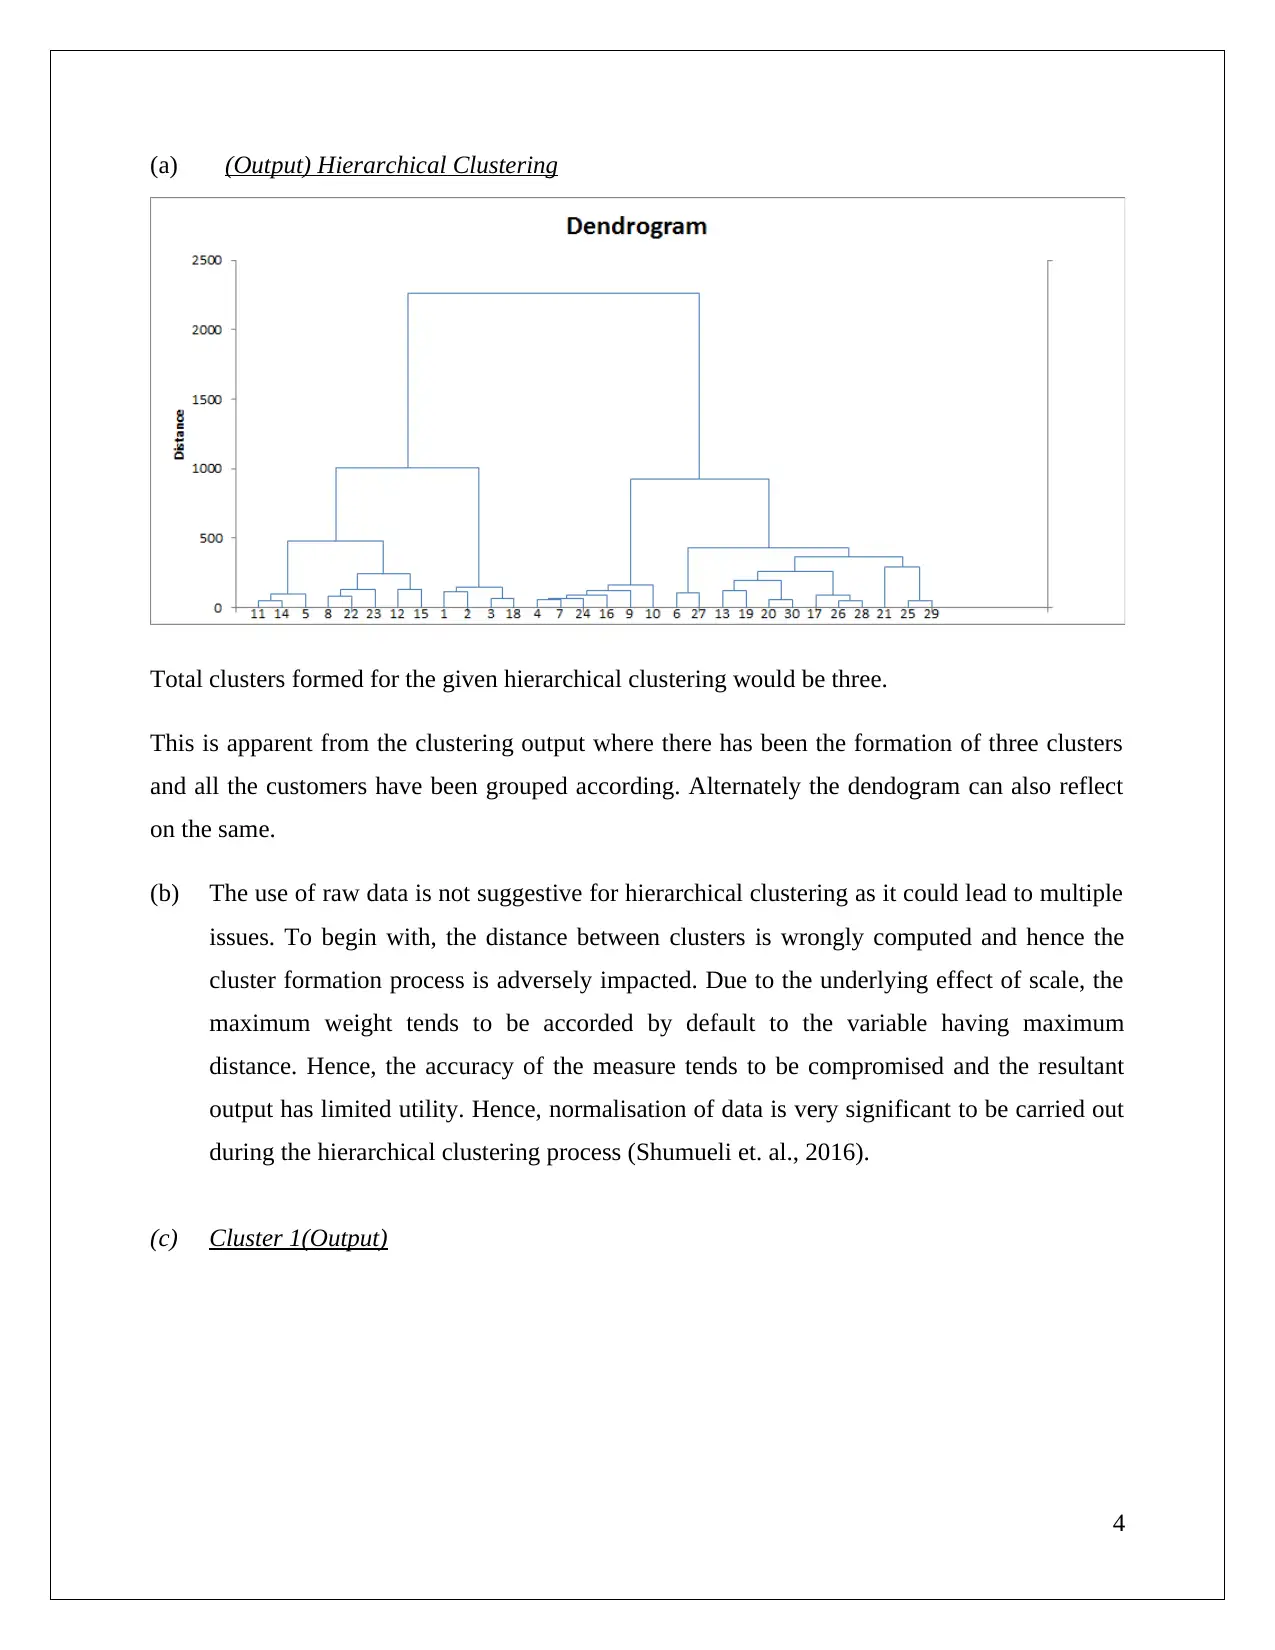
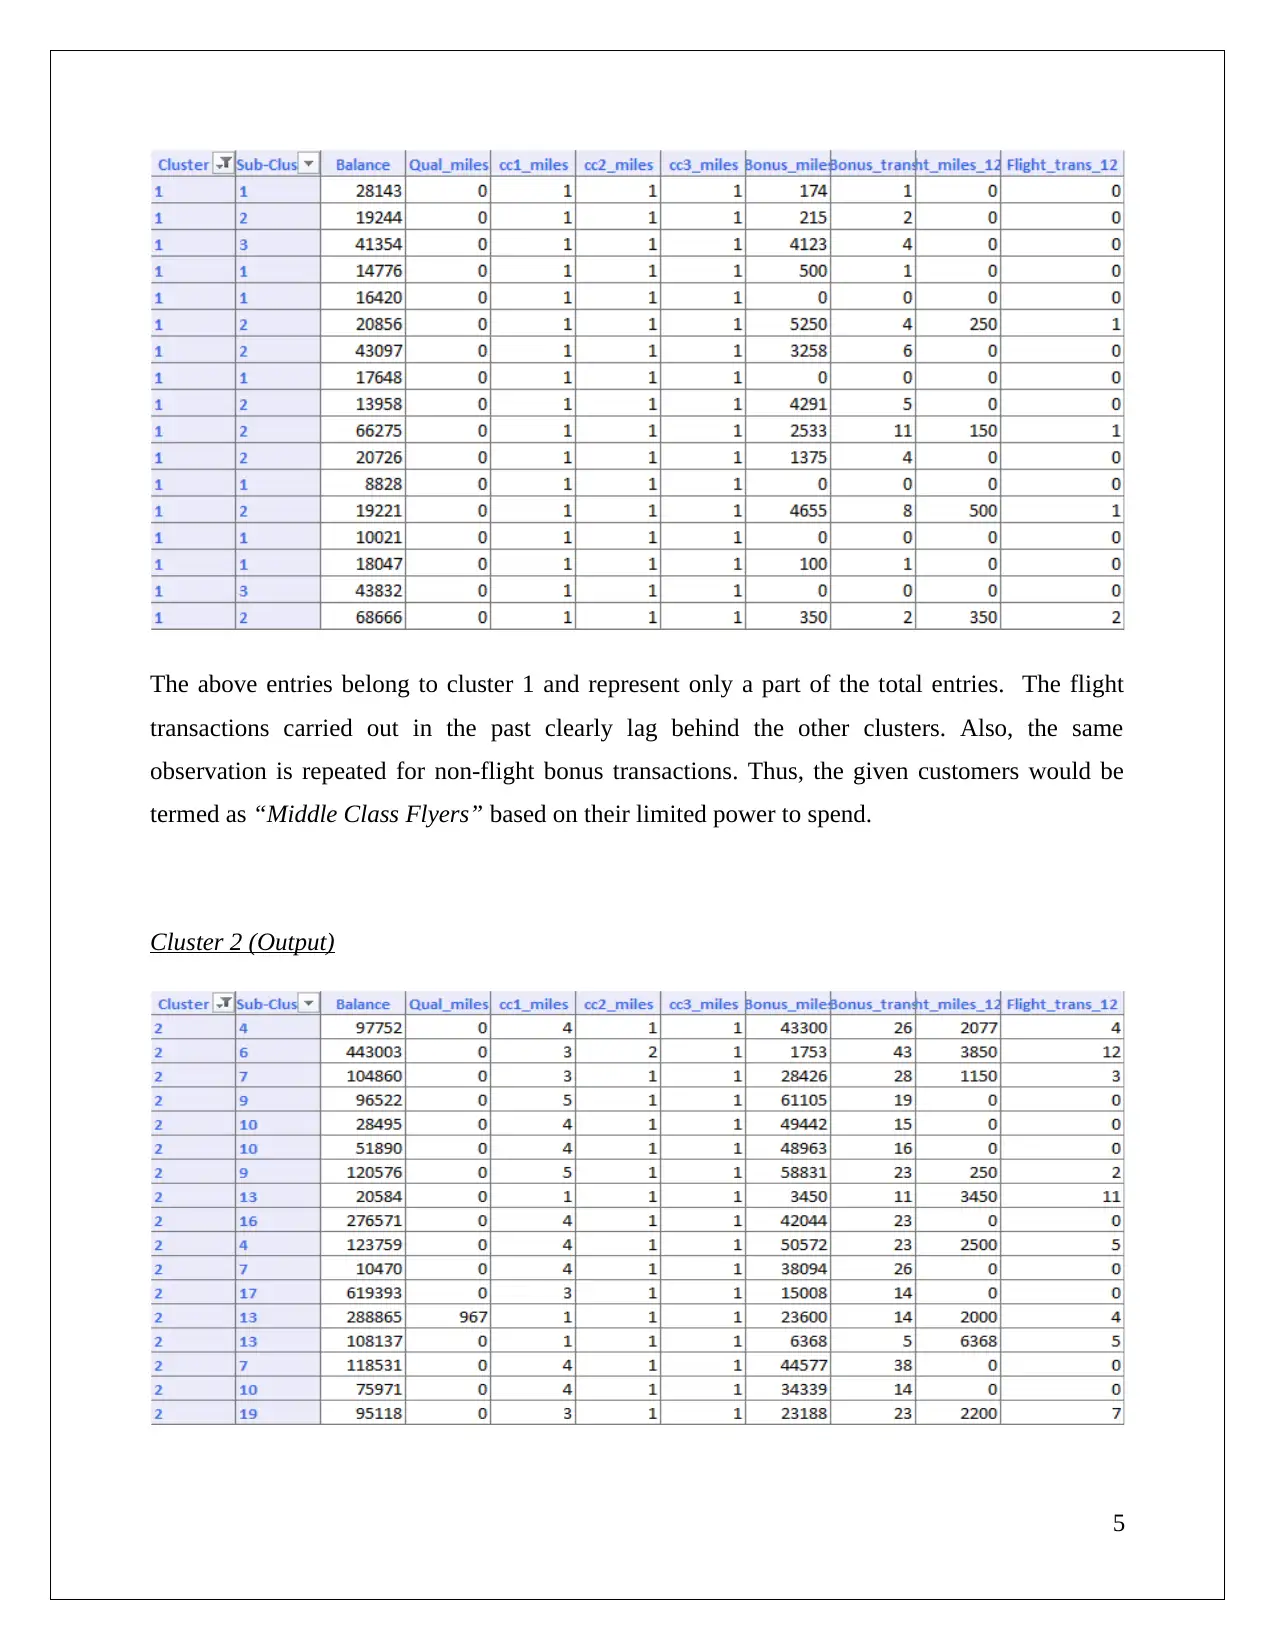
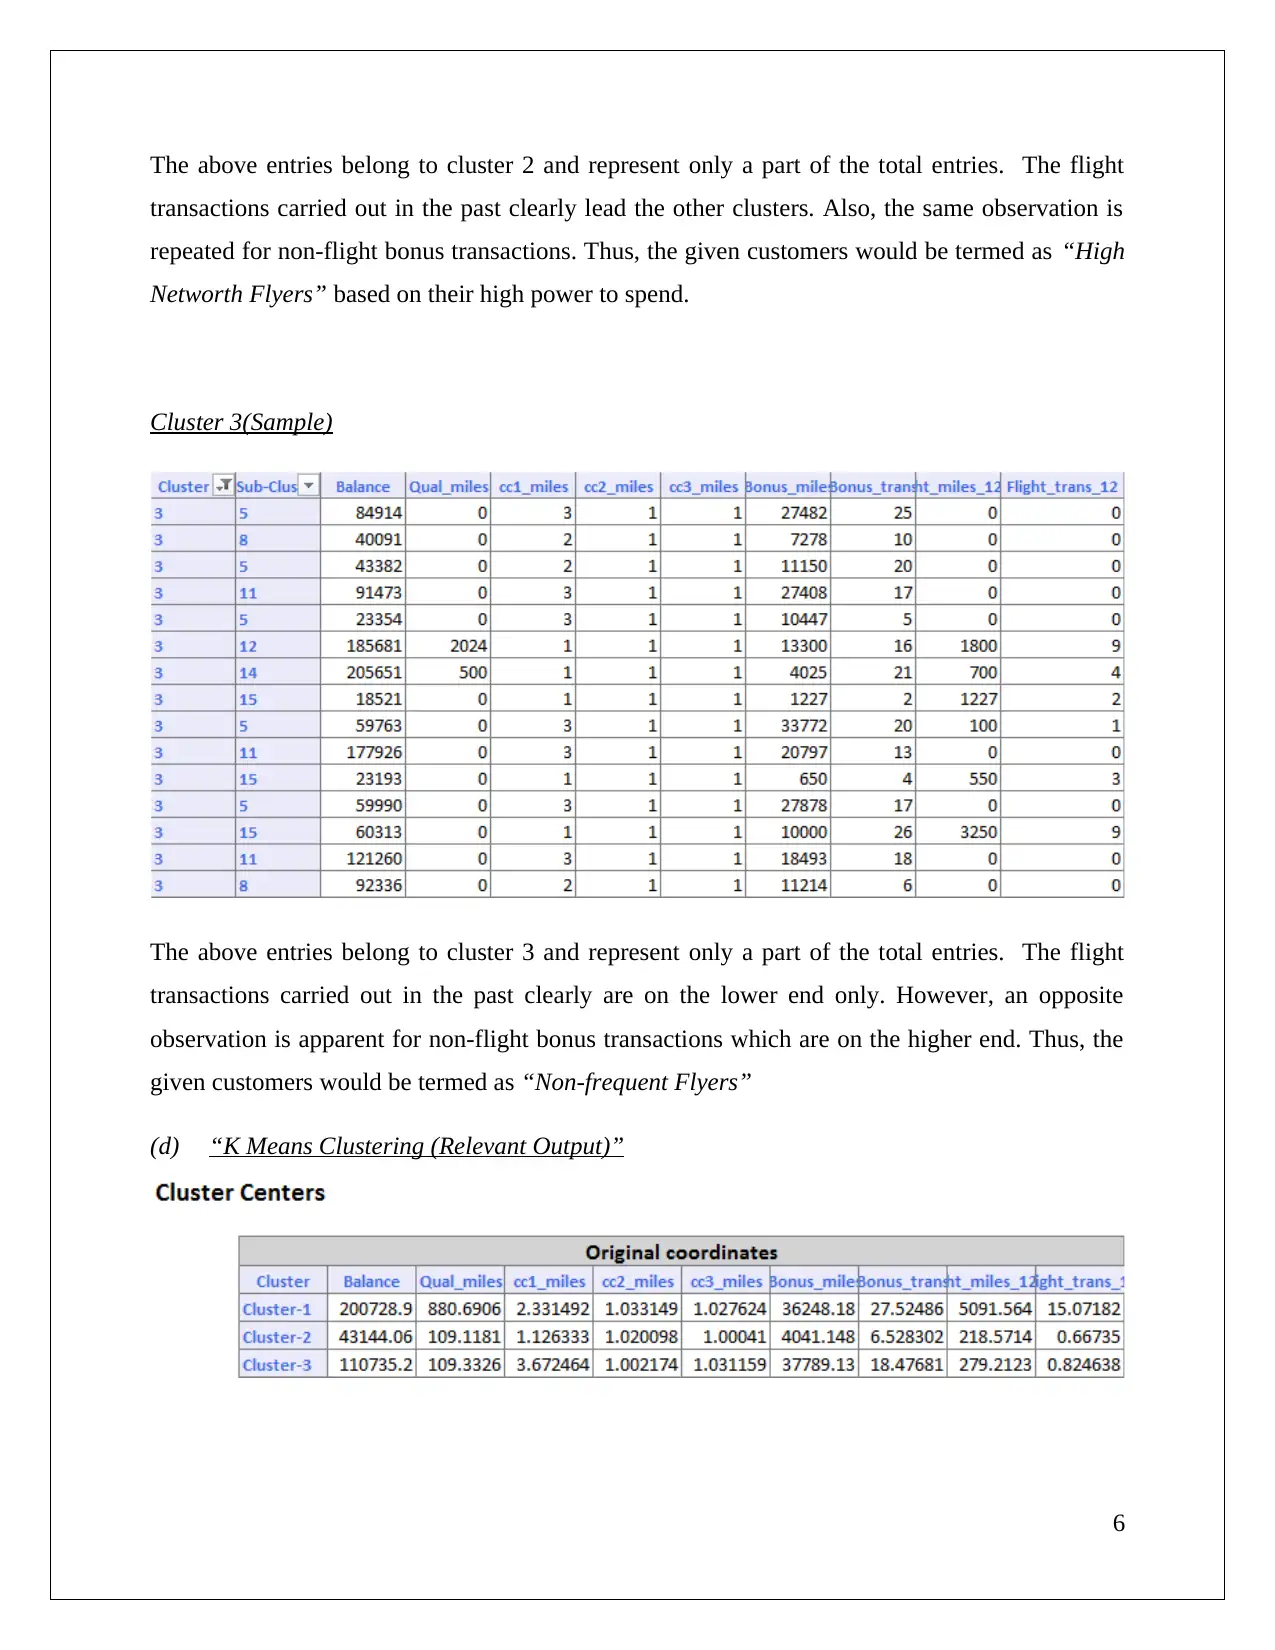
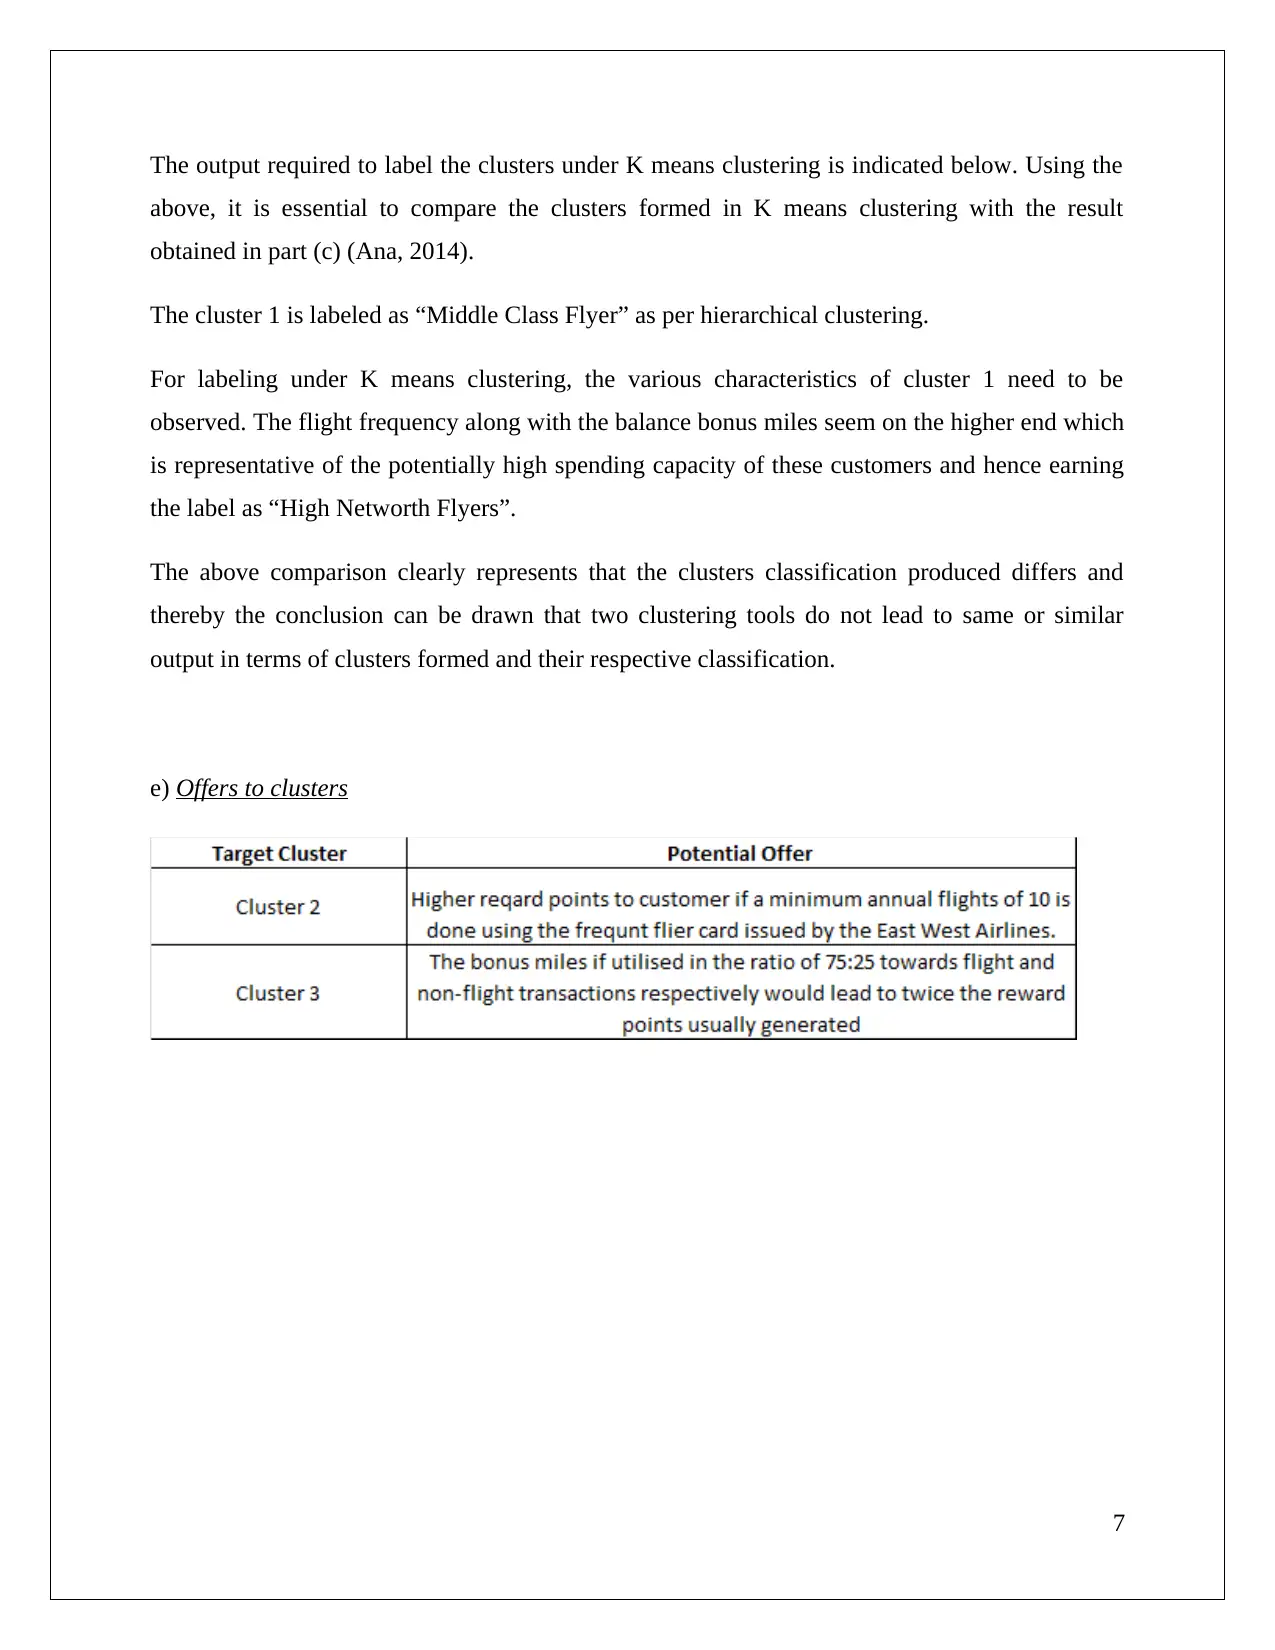
This document presents a comprehensive solution to a data mining assignment focusing on association rules and clustering techniques applied to cosmetic data using XL Miner. The assignment explores the application of association rules, including the identification of rule redundancy and the impact of minimum confidence levels. It also delves into hierarchical and K-means clustering, analyzing customer data to segment them into distinct groups such as "Middle Class Flyers," "High Networth Flyers," and "Non-frequent Flyers." The solution provides detailed outputs, comparisons between clustering methods, and discussions on the importance of data normalization and the interpretation of cluster characteristics. References to relevant academic sources are also included to support the analysis and findings.
Document Page
Data Mining
Student Id and Name
[Pick the date]
tabler-icon-diamond-filled.svg

Paraphrase This Document

Need a fresh take? Get an instant paraphrase of this document with our AI Paraphraser
Document Page
Question 1
The given task deals with association rules based on the given binary cosmetic data using XL
miner as the analysis tool.
(i) Rule #1: If a brushes purchase is done by the customers, then with 100% likelihood, the
nail polish purchase would also be made.
Rule #2: If a nail polish purchase is done by the customers, then with 63.22% likelihood,
the brushes purchase would also be made.
Rule #3: If a nail polish purchase is done by the customers, then with 59.20% likelihood,
the bronzer purchase would also be made..
1
Document Page
(ii) When association rules are used, there is a common occurrence of rule redundancy. This is
the case when the observed support level of a particular rule of association is predictable
on the basis of the earlier rule which is immediate more significant rule and also is labeled
as ancestor. For the given case, the redundancy is observed for Rule 2.
Rule 1 (Support or lift ratio) = Rule 2 (Support or lift ratio)
Rule 1(Confidence Level) > Rule 2 (Confidence Level)
Thus, when viewed in the context of Rule 1, the Rule 2 would be deemed as redundant and
hence may be ignored from the output (Leibowitz, 2015).
For assessment of the underlying utility of the association rules, it is critical that these rules
must be considered collectively rather than individually. This is because collective
consideration allows for a unified picture to exist which can disseminate critical
information. However, the attributes of these association rules can also be judged
independently through consideration to two main aspects namely confidence and support.
Having higher value in atleast one aspect tends to lead to potential use of the given
association rule (Zaki, 2000).
.
(iii) Revised association rule (minimum confidence level 75%)
.
2
Document Page
It becomes evident from the above output that the number of association rules has witnessed a
drastic reduction and hence only one rule is being displayed. This is a sharp fall in comparison to
the original output but can be justified on the failure on the other rules to comply with the
minimum confidence interval to list which is not being fulfilled here. A key consideration while
choosing the minimum confidence level is that it should not be maintained at a very high level or
certain rules having significance in the form of high lift ratio can get ignored which is not
desirable (Ana, 2014).
Question 2
3
tabler-icon-diamond-filled.svg

Paraphrase This Document

Need a fresh take? Get an instant paraphrase of this document with our AI Paraphraser
Document Page
(a) (Output) Hierarchical Clustering
Total clusters formed for the given hierarchical clustering would be three.
This is apparent from the clustering output where there has been the formation of three clusters
and all the customers have been grouped according. Alternately the dendogram can also reflect
on the same.
(b) The use of raw data is not suggestive for hierarchical clustering as it could lead to multiple
issues. To begin with, the distance between clusters is wrongly computed and hence the
cluster formation process is adversely impacted. Due to the underlying effect of scale, the
maximum weight tends to be accorded by default to the variable having maximum
distance. Hence, the accuracy of the measure tends to be compromised and the resultant
output has limited utility. Hence, normalisation of data is very significant to be carried out
during the hierarchical clustering process (Shumueli et. al., 2016).
(c) Cluster 1(Output)
4
Document Page
The above entries belong to cluster 1 and represent only a part of the total entries. The flight
transactions carried out in the past clearly lag behind the other clusters. Also, the same
observation is repeated for non-flight bonus transactions. Thus, the given customers would be
termed as “Middle Class Flyers” based on their limited power to spend.
Cluster 2 (Output)
5
Document Page
The above entries belong to cluster 2 and represent only a part of the total entries. The flight
transactions carried out in the past clearly lead the other clusters. Also, the same observation is
repeated for non-flight bonus transactions. Thus, the given customers would be termed as “High
Networth Flyers” based on their high power to spend.
Cluster 3(Sample)
The above entries belong to cluster 3 and represent only a part of the total entries. The flight
transactions carried out in the past clearly are on the lower end only. However, an opposite
observation is apparent for non-flight bonus transactions which are on the higher end. Thus, the
given customers would be termed as “Non-frequent Flyers”
(d) “K Means Clustering (Relevant Output)”
6
tabler-icon-diamond-filled.svg

Paraphrase This Document

Need a fresh take? Get an instant paraphrase of this document with our AI Paraphraser
Document Page
The output required to label the clusters under K means clustering is indicated below. Using the
above, it is essential to compare the clusters formed in K means clustering with the result
obtained in part (c) (Ana, 2014).
The cluster 1 is labeled as “Middle Class Flyer” as per hierarchical clustering.
For labeling under K means clustering, the various characteristics of cluster 1 need to be
observed. The flight frequency along with the balance bonus miles seem on the higher end which
is representative of the potentially high spending capacity of these customers and hence earning
the label as “High Networth Flyers”.
The above comparison clearly represents that the clusters classification produced differs and
thereby the conclusion can be drawn that two clustering tools do not lead to same or similar
output in terms of clusters formed and their respective classification.
e) Offers to clusters
7
Document Page
References
Ana, A. (2014) Integration of Data Mining in Business Intelligence System (4th ed.). Sydney:
IGA Global
Liebowitz, J. (2015) Business Analytics: An Introduction (2nd ed.). New York: CRC Press.
Shumueli, G., Bruce, C.P., Yahav, I., Patel, R. N., Kenneth, C., & Lichtendahl, J. (2016) Data
Mining For Business Analytics: Concepts Techniques and Application (2nd ed.).London:
John Wiley & Sons.
Zaki, M.J.(2000), Generating non-redundant association rules. In: Proceeding of the ACM
SIGKDD, pp. 34–43
8
chevron_up_icon
1 out of 9
circle_padding
hide_on_mobile
zoom_out_icon
[object Object]