Data Mining Assignment: Analysis of Association Rule and Clustering

Verified

Added on  2020/03/16

|12
|1914
|306
Homework Assignment
AI Summary
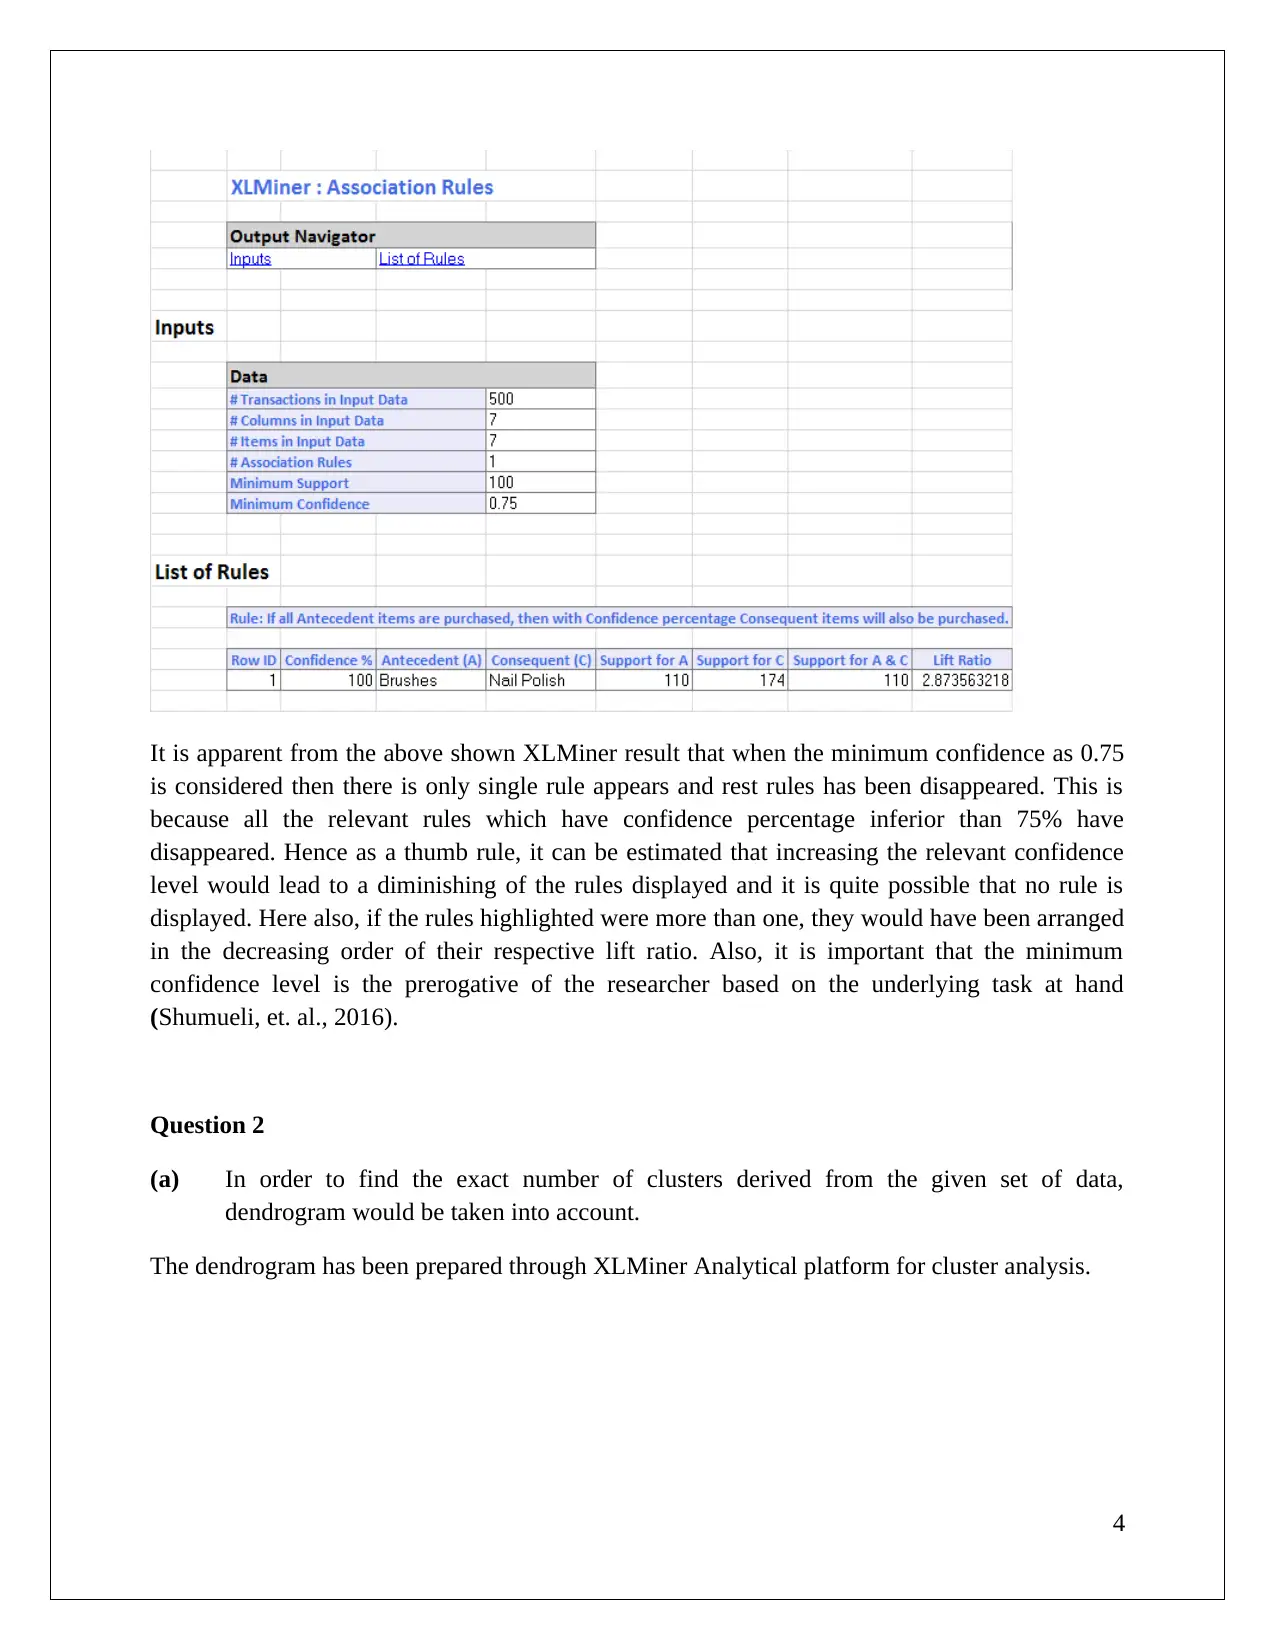
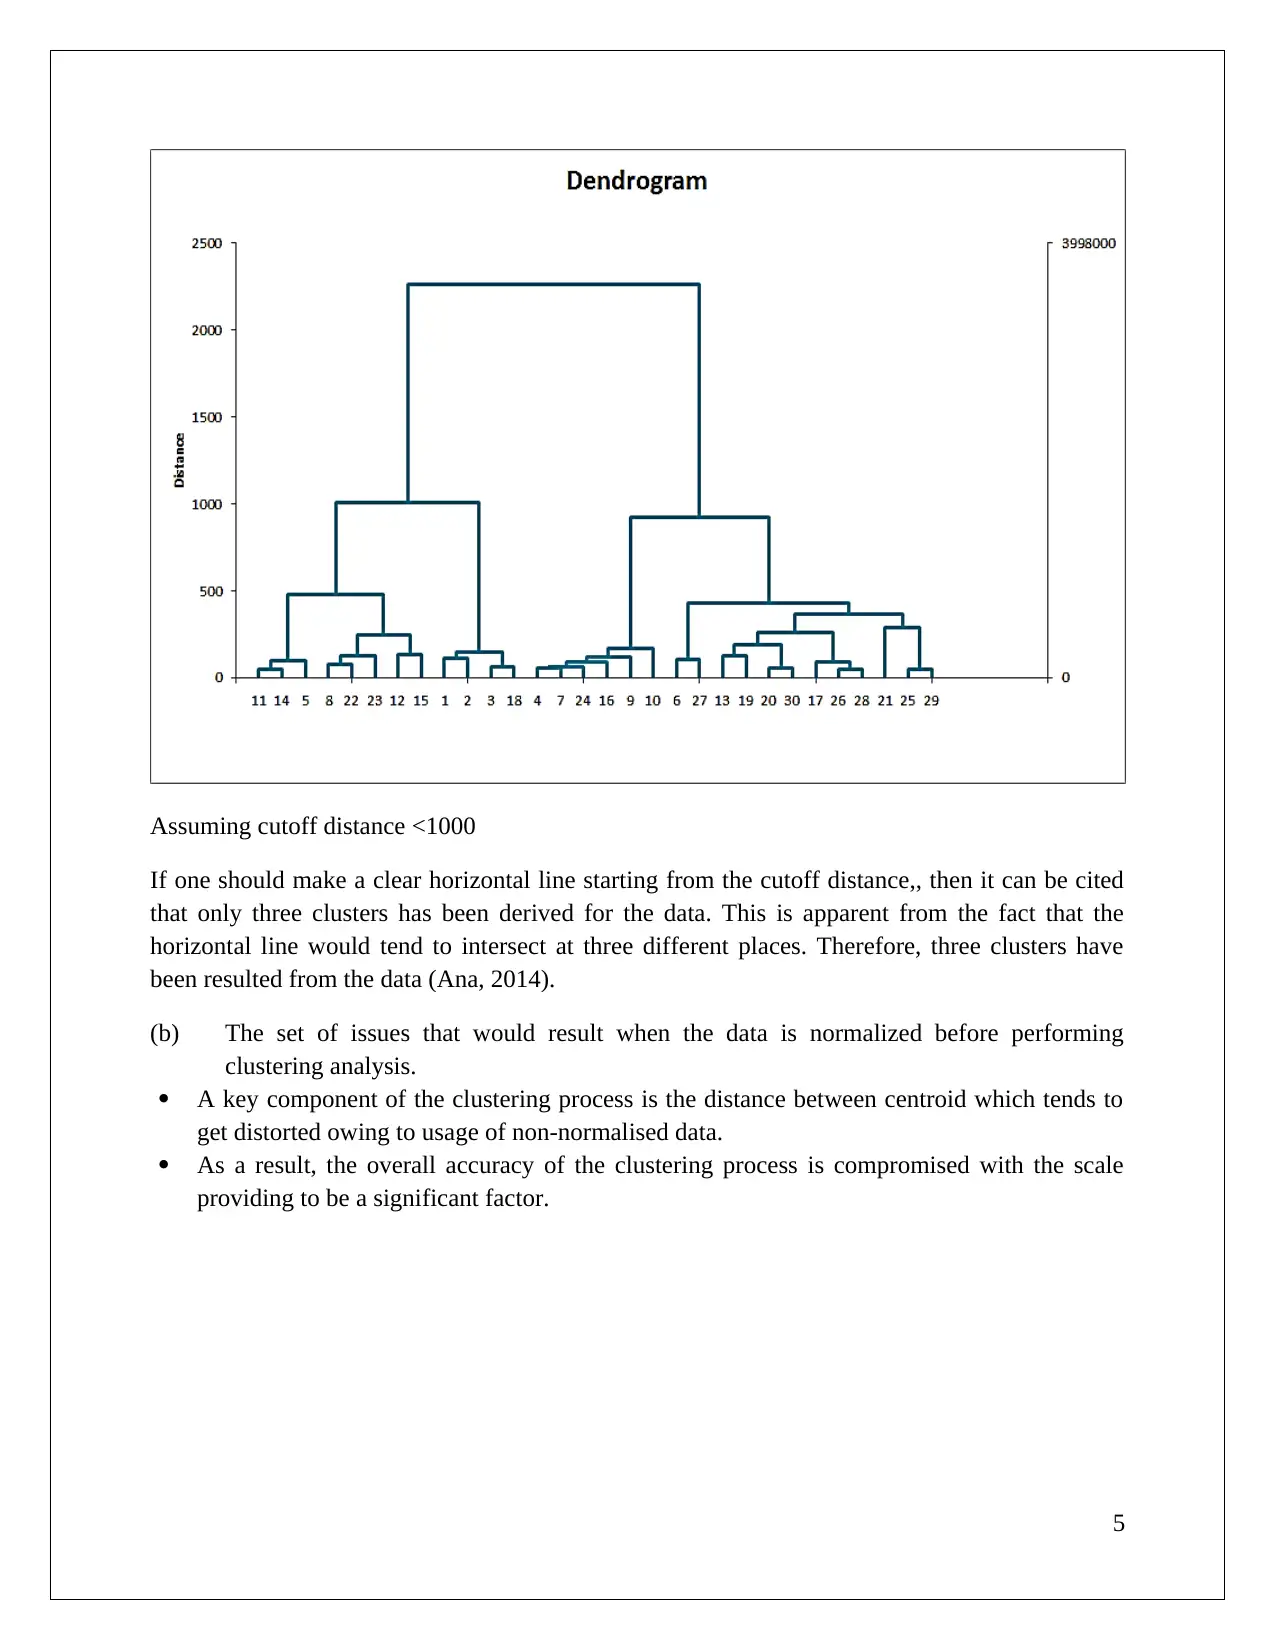
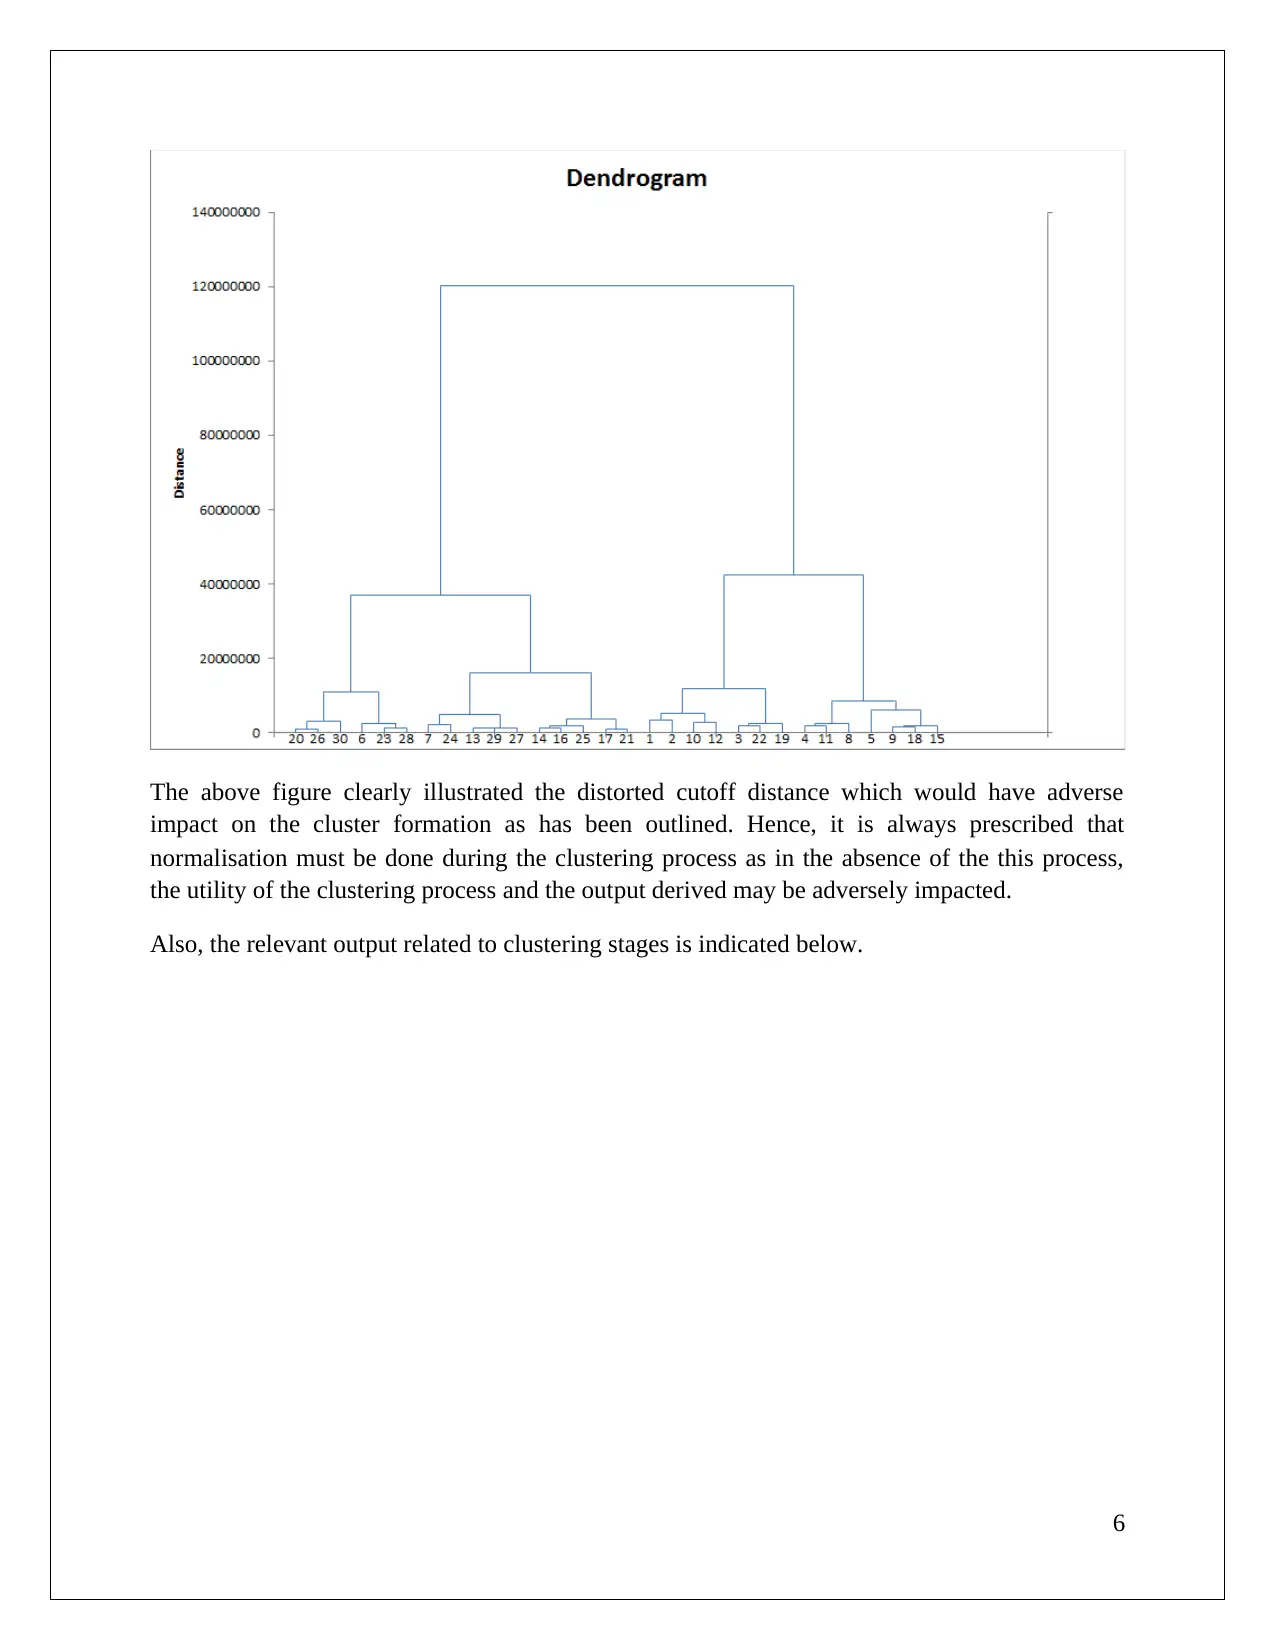
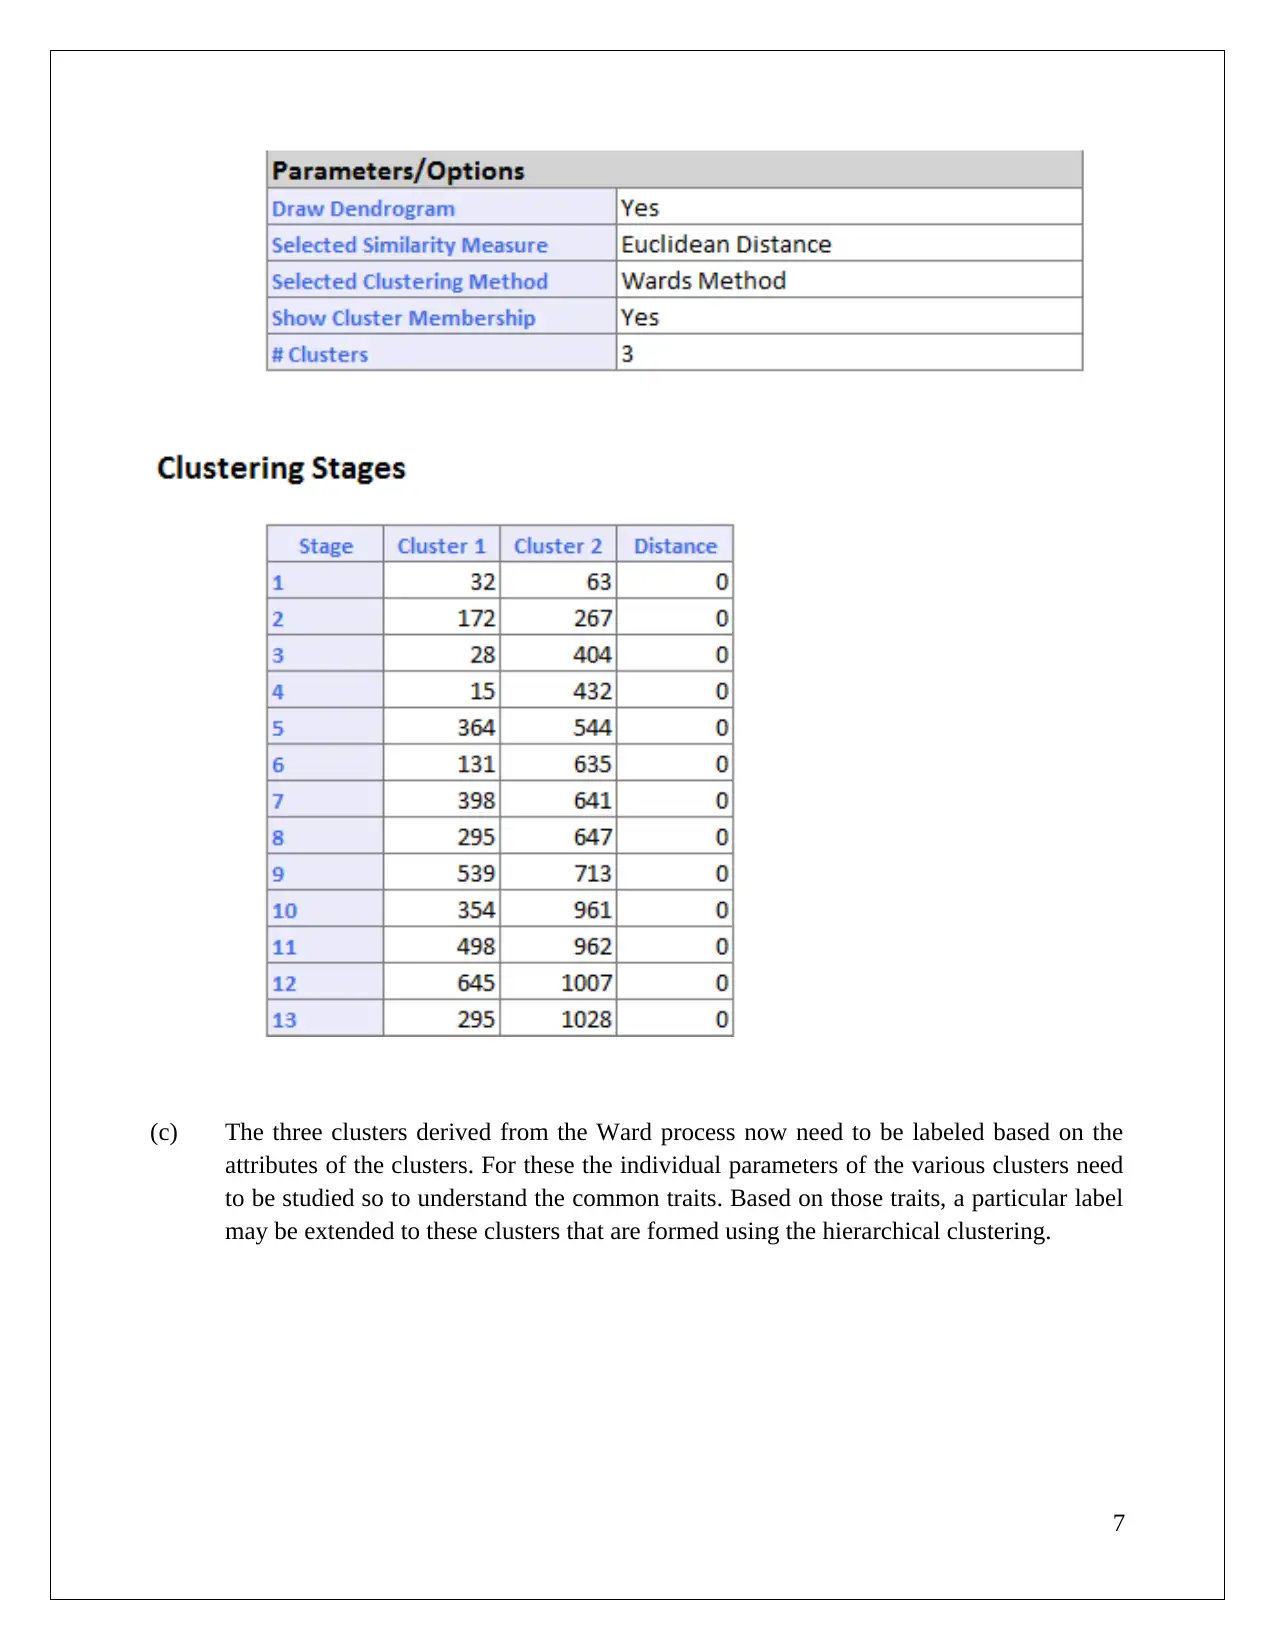
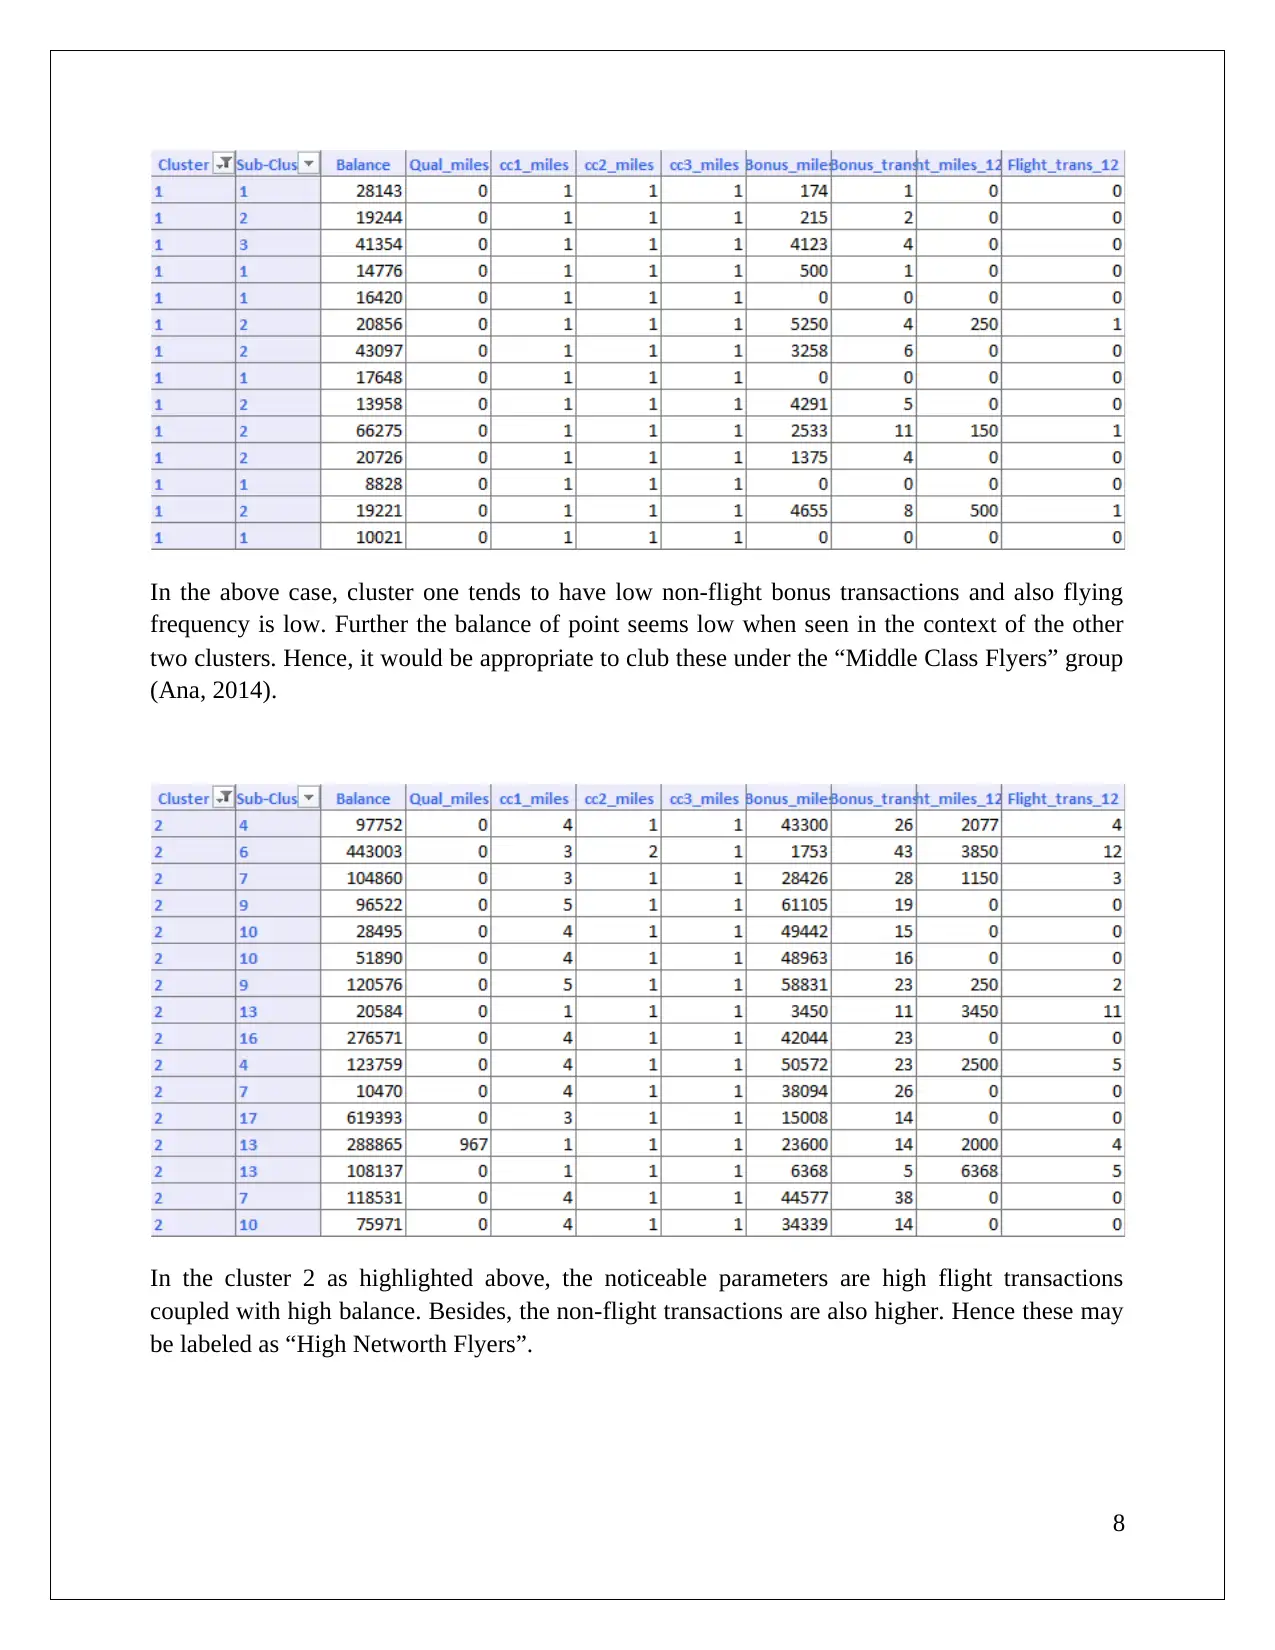
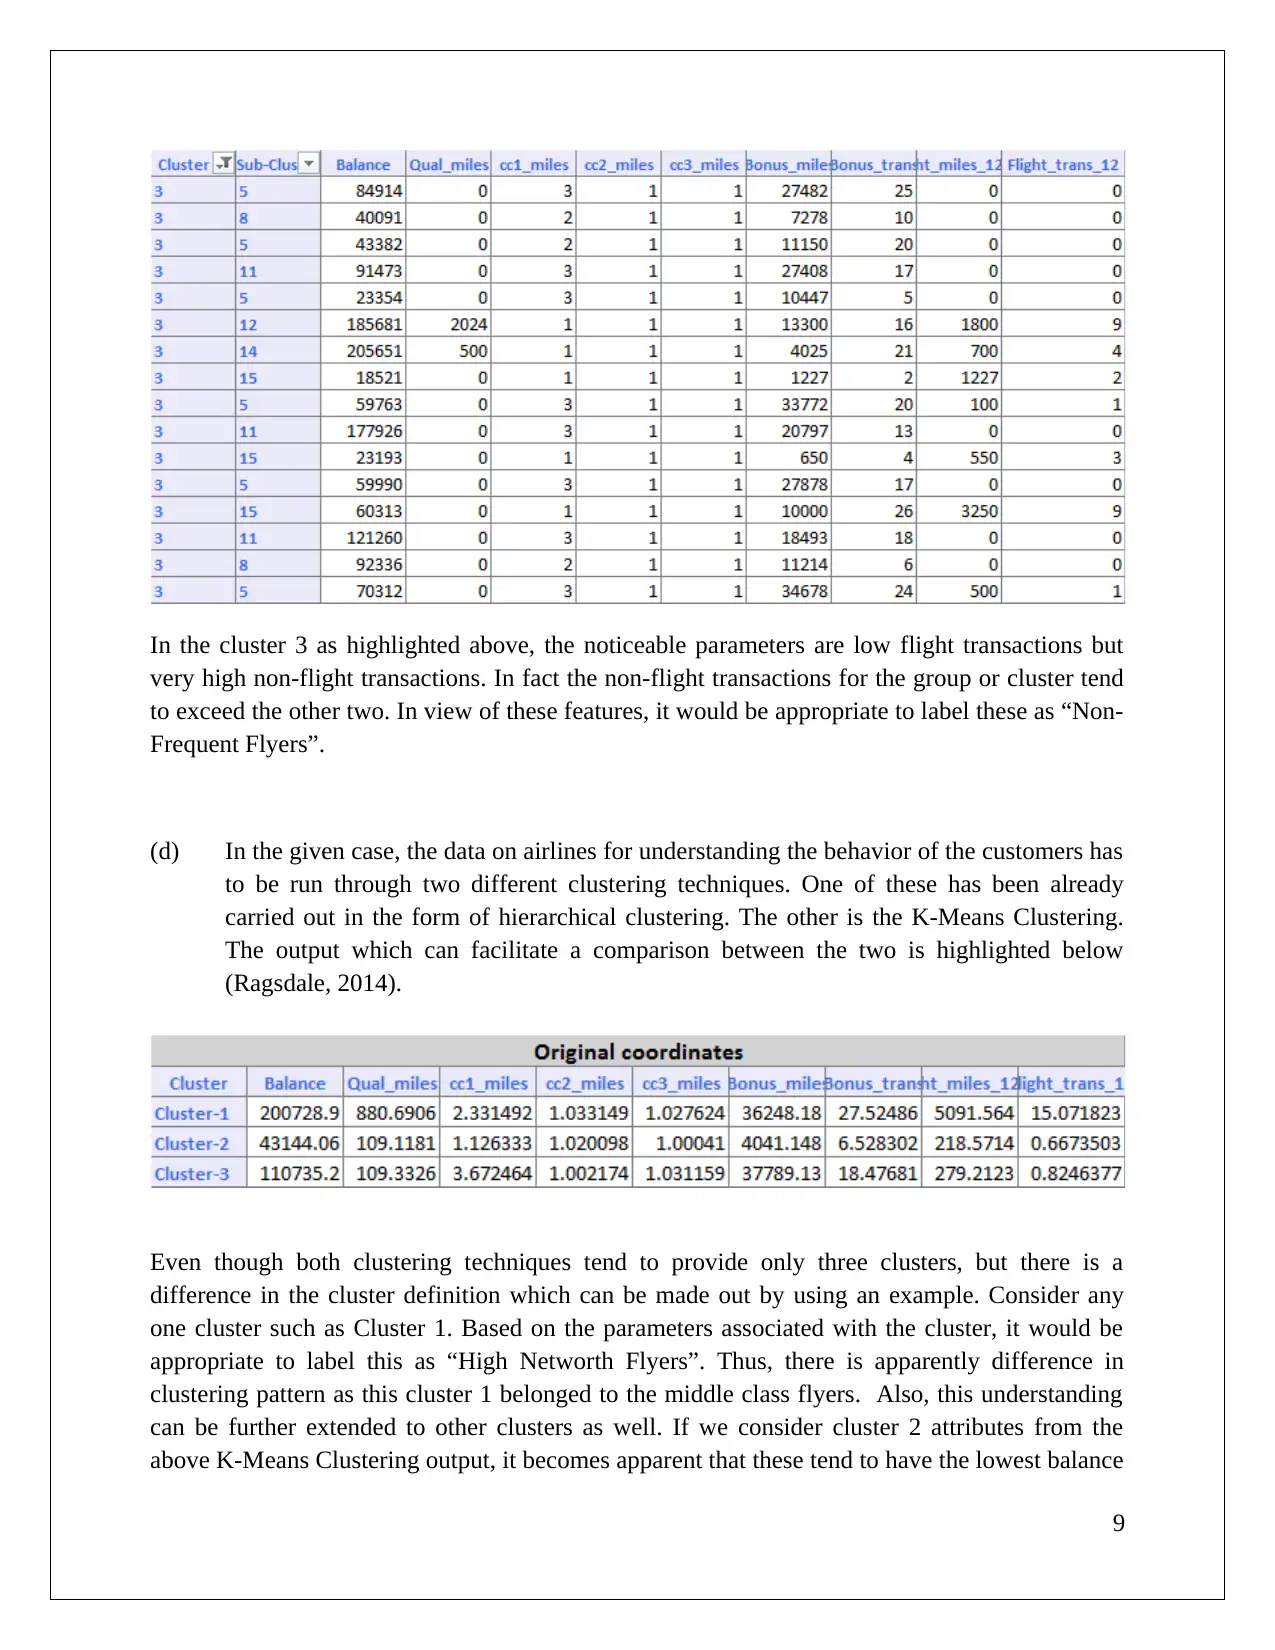
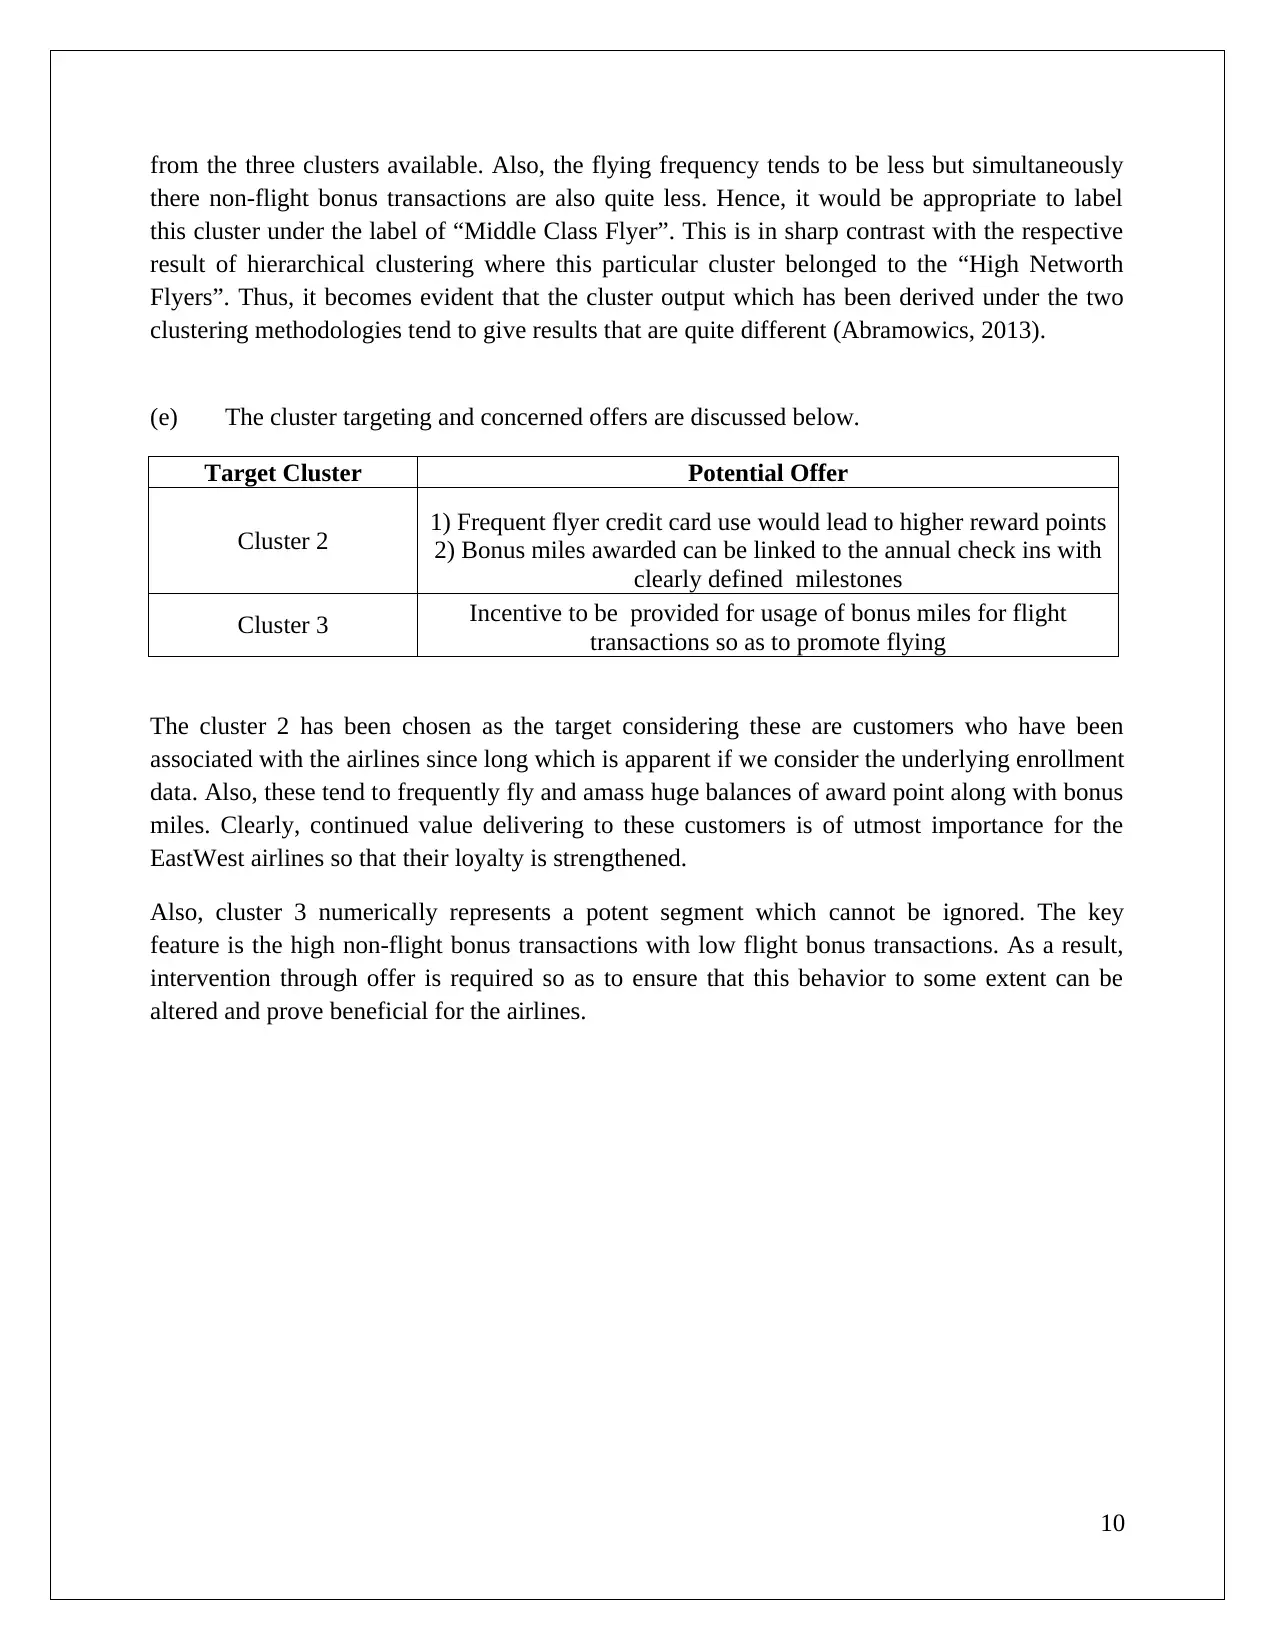
This data mining assignment utilizes the XLMiner analytical platform to explore association rules and clustering techniques. The analysis focuses on a cosmetic dataset, examining association rules with varying confidence levels and identifying redundant rules. The assignment delves into the concepts of lift ratio and confidence level, highlighting their significance in understanding consumer buying behavior. Furthermore, the assignment explores clustering analysis using dendrograms to determine the number of clusters and discusses the impact of data normalization on clustering accuracy. It also compares hierarchical and K-Means clustering methods, labeling clusters based on their attributes and proposing targeted offers to different customer segments. This document, available on Desklib, provides a comprehensive overview of the analysis, including the identification of key customer traits and actionable insights for business decision-making.
Document Page
Data Mining
[Pick the date]
Student Id and Name
tabler-icon-diamond-filled.svg

Paraphrase This Document

Need a fresh take? Get an instant paraphrase of this document with our AI Paraphraser
Document Page
1. Association rule
For the issued data set the association rule has been applied through XLMiner Analytical
platform. The generated output from XLMiner is furnished below:
It is apparent from the inputs that minimum confidence is considered as 50%.
(i) Comment on the primary three rules as per the list of rules table resulted through
XLMiner is shown below (Ana, 2014).
Rule 1
It is apparent from the first row of the list of rules table that there is 100% confidence that a
person who is going to buy brush item will also buy nail polish item.
Rule 2
It is apparent from the second row of the list of rules table that there is 63.22 % confidence that a
person who is going to buy nail polish item will also buy brush item.
1
Document Page
Rule 3
It is apparent from the third row of the list of rules table that there is 59.20 % confidence
percentage that a person who is going to buy nail polish item will also buy bronzer item.
In this context, it is essential to note that there are two key characteristics of any association rule
namely the lift ratio and also confidence level. The importance or support of an underlying rule
is characterized by the lift ratio which ideally should be higher as association rules are arranged
in decreasing order. Also, the confidence level is indicative of the conditional probability of the
consequent purchase happening assuming antecedent purchase has happened.
(i) In order to analyze the first 24 rules, the support level is decreased to 50 which leads to the
following rules.
Redundancy of association rules is often a common problem and hence rectifications need
to be made in the form of deleting such rules whose incremental value is lacking as they
2
Document Page
tend to communicate the same information as has been communicated through a separate
rule. In case of given cosmetic data and the associated output indicated above, there are a
number of redundant rules that are identified below (Ragsdale, 2014).
Rule 2 (with respect to Rule 1 as same lift ratio and predictable output)
Rule 4(with respect to Rule 3 as same lift ratio and predictable output)
Rule 6(with respect to Rule 5 as same lift ratio and predictable output)
Rule 8(with respect to Rule 7 as same lift ratio and predictable output)
Rule 10(with respect to Rule 9 as same lift ratio and predictable output)
Rule 12(with respect to Rule 11 as same lift ratio and predictable output)
Rule 14(with respect to Rule 13 as same lift ratio and predictable output)
Rule 16(with respect to Rule 15 as same lift ratio and predictable output)
It needs to be understood that association rules are derived so that key insights into the consumer
buying behavior needs to be understood. Hence, any redundant rules need to be deleted. Further,
In the interpretation of the remaining rules, two critical parameters essentially relate to the lift
ratio and the confidence level which essentially determine the significance and support to the
underlying rule. In this manner, vital information may be communicated with respect to the
expected buying behavior of the customer which then can be used for decision making. For
instance, items such as brush and nail polish may be placed on closed proximity so as to facilitate
customer buying. Also, specific consumer traits that are most profitable to a given company
related to purchase of cosmetics can be encouraged (Shumulei et. al., 2016).
(ii) Now, the confidence percentage has been changed and become 75% from 50%. The
change in the result can be viewed as shown below:
3
tabler-icon-diamond-filled.svg

Paraphrase This Document

Need a fresh take? Get an instant paraphrase of this document with our AI Paraphraser
Document Page
It is apparent from the above shown XLMiner result that when the minimum confidence as 0.75
is considered then there is only single rule appears and rest rules has been disappeared. This is
because all the relevant rules which have confidence percentage inferior than 75% have
disappeared. Hence as a thumb rule, it can be estimated that increasing the relevant confidence
level would lead to a diminishing of the rules displayed and it is quite possible that no rule is
displayed. Here also, if the rules highlighted were more than one, they would have been arranged
in the decreasing order of their respective lift ratio. Also, it is important that the minimum
confidence level is the prerogative of the researcher based on the underlying task at hand
(Shumueli, et. al., 2016).
Question 2
(a) In order to find the exact number of clusters derived from the given set of data,
dendrogram would be taken into account.
The dendrogram has been prepared through XLMiner Analytical platform for cluster analysis.
4
Document Page
Assuming cutoff distance <1000
If one should make a clear horizontal line starting from the cutoff distance,, then it can be cited
that only three clusters has been derived for the data. This is apparent from the fact that the
horizontal line would tend to intersect at three different places. Therefore, three clusters have
been resulted from the data (Ana, 2014).
(b) The set of issues that would result when the data is normalized before performing
clustering analysis.
A key component of the clustering process is the distance between centroid which tends to
get distorted owing to usage of non-normalised data.
As a result, the overall accuracy of the clustering process is compromised with the scale
providing to be a significant factor.
5
Document Page
The above figure clearly illustrated the distorted cutoff distance which would have adverse
impact on the cluster formation as has been outlined. Hence, it is always prescribed that
normalisation must be done during the clustering process as in the absence of the this process,
the utility of the clustering process and the output derived may be adversely impacted.
Also, the relevant output related to clustering stages is indicated below.
6
tabler-icon-diamond-filled.svg

Paraphrase This Document

Need a fresh take? Get an instant paraphrase of this document with our AI Paraphraser
Document Page
(c) The three clusters derived from the Ward process now need to be labeled based on the
attributes of the clusters. For these the individual parameters of the various clusters need
to be studied so to understand the common traits. Based on those traits, a particular label
may be extended to these clusters that are formed using the hierarchical clustering.
7
Document Page
In the above case, cluster one tends to have low non-flight bonus transactions and also flying
frequency is low. Further the balance of point seems low when seen in the context of the other
two clusters. Hence, it would be appropriate to club these under the “Middle Class Flyers” group
(Ana, 2014).
In the cluster 2 as highlighted above, the noticeable parameters are high flight transactions
coupled with high balance. Besides, the non-flight transactions are also higher. Hence these may
be labeled as “High Networth Flyers”.
8
Document Page
In the cluster 3 as highlighted above, the noticeable parameters are low flight transactions but
very high non-flight transactions. In fact the non-flight transactions for the group or cluster tend
to exceed the other two. In view of these features, it would be appropriate to label these as “Non-
Frequent Flyers”.
(d) In the given case, the data on airlines for understanding the behavior of the customers has
to be run through two different clustering techniques. One of these has been already
carried out in the form of hierarchical clustering. The other is the K-Means Clustering.
The output which can facilitate a comparison between the two is highlighted below
(Ragsdale, 2014).
Even though both clustering techniques tend to provide only three clusters, but there is a
difference in the cluster definition which can be made out by using an example. Consider any
one cluster such as Cluster 1. Based on the parameters associated with the cluster, it would be
appropriate to label this as “High Networth Flyers”. Thus, there is apparently difference in
clustering pattern as this cluster 1 belonged to the middle class flyers. Also, this understanding
can be further extended to other clusters as well. If we consider cluster 2 attributes from the
above K-Means Clustering output, it becomes apparent that these tend to have the lowest balance
9
tabler-icon-diamond-filled.svg

Paraphrase This Document

Need a fresh take? Get an instant paraphrase of this document with our AI Paraphraser
Document Page
from the three clusters available. Also, the flying frequency tends to be less but simultaneously
there non-flight bonus transactions are also quite less. Hence, it would be appropriate to label
this cluster under the label of “Middle Class Flyer”. This is in sharp contrast with the respective
result of hierarchical clustering where this particular cluster belonged to the “High Networth
Flyers”. Thus, it becomes evident that the cluster output which has been derived under the two
clustering methodologies tend to give results that are quite different (Abramowics, 2013).
(e) The cluster targeting and concerned offers are discussed below.
Target Cluster Potential Offer
Cluster 2 1) Frequent flyer credit card use would lead to higher reward points
2) Bonus miles awarded can be linked to the annual check ins with
clearly defined milestones
Cluster 3 Incentive to be provided for usage of bonus miles for flight
transactions so as to promote flying
The cluster 2 has been chosen as the target considering these are customers who have been
associated with the airlines since long which is apparent if we consider the underlying enrollment
data. Also, these tend to frequently fly and amass huge balances of award point along with bonus
miles. Clearly, continued value delivering to these customers is of utmost importance for the
EastWest airlines so that their loyalty is strengthened.
Also, cluster 3 numerically represents a potent segment which cannot be ignored. The key
feature is the high non-flight bonus transactions with low flight bonus transactions. As a result,
intervention through offer is required so as to ensure that this behavior to some extent can be
altered and prove beneficial for the airlines.
10
Document Page
Reference
Abramowics, W. (2013) Business Information Systems Workshops: BIS 2013 International
Workshops (5th ed.). New York: Springer.
Ana, A. (2014) Integration of Data Mining in Business Intelligence System (4th ed.). Sydney:
IGA Global
Ragsdale, C. (2014) Spread sheet Modelling and Decision Analysis: A Practical Introduction to
Business Analytics (7th ed.). London: Cengage Learning.
Shumueli, G., Bruce, C.P., Yahav, I., Patel, R. N., Kenneth, C., & Lichtendahl, J. (2016) Data
Mining For Business Analytics: Concepts Techniques and Application (2nd ed.).London:
John Wiley & Sons.
11
chevron_up_icon
1 out of 12
circle_padding
hide_on_mobile
zoom_out_icon
[object Object]