Data Mining Assignment - Association Rules and Cluster Analysis
VerifiedAdded on 2020/03/16
|7
|745
|39
Homework Assignment
AI Summary
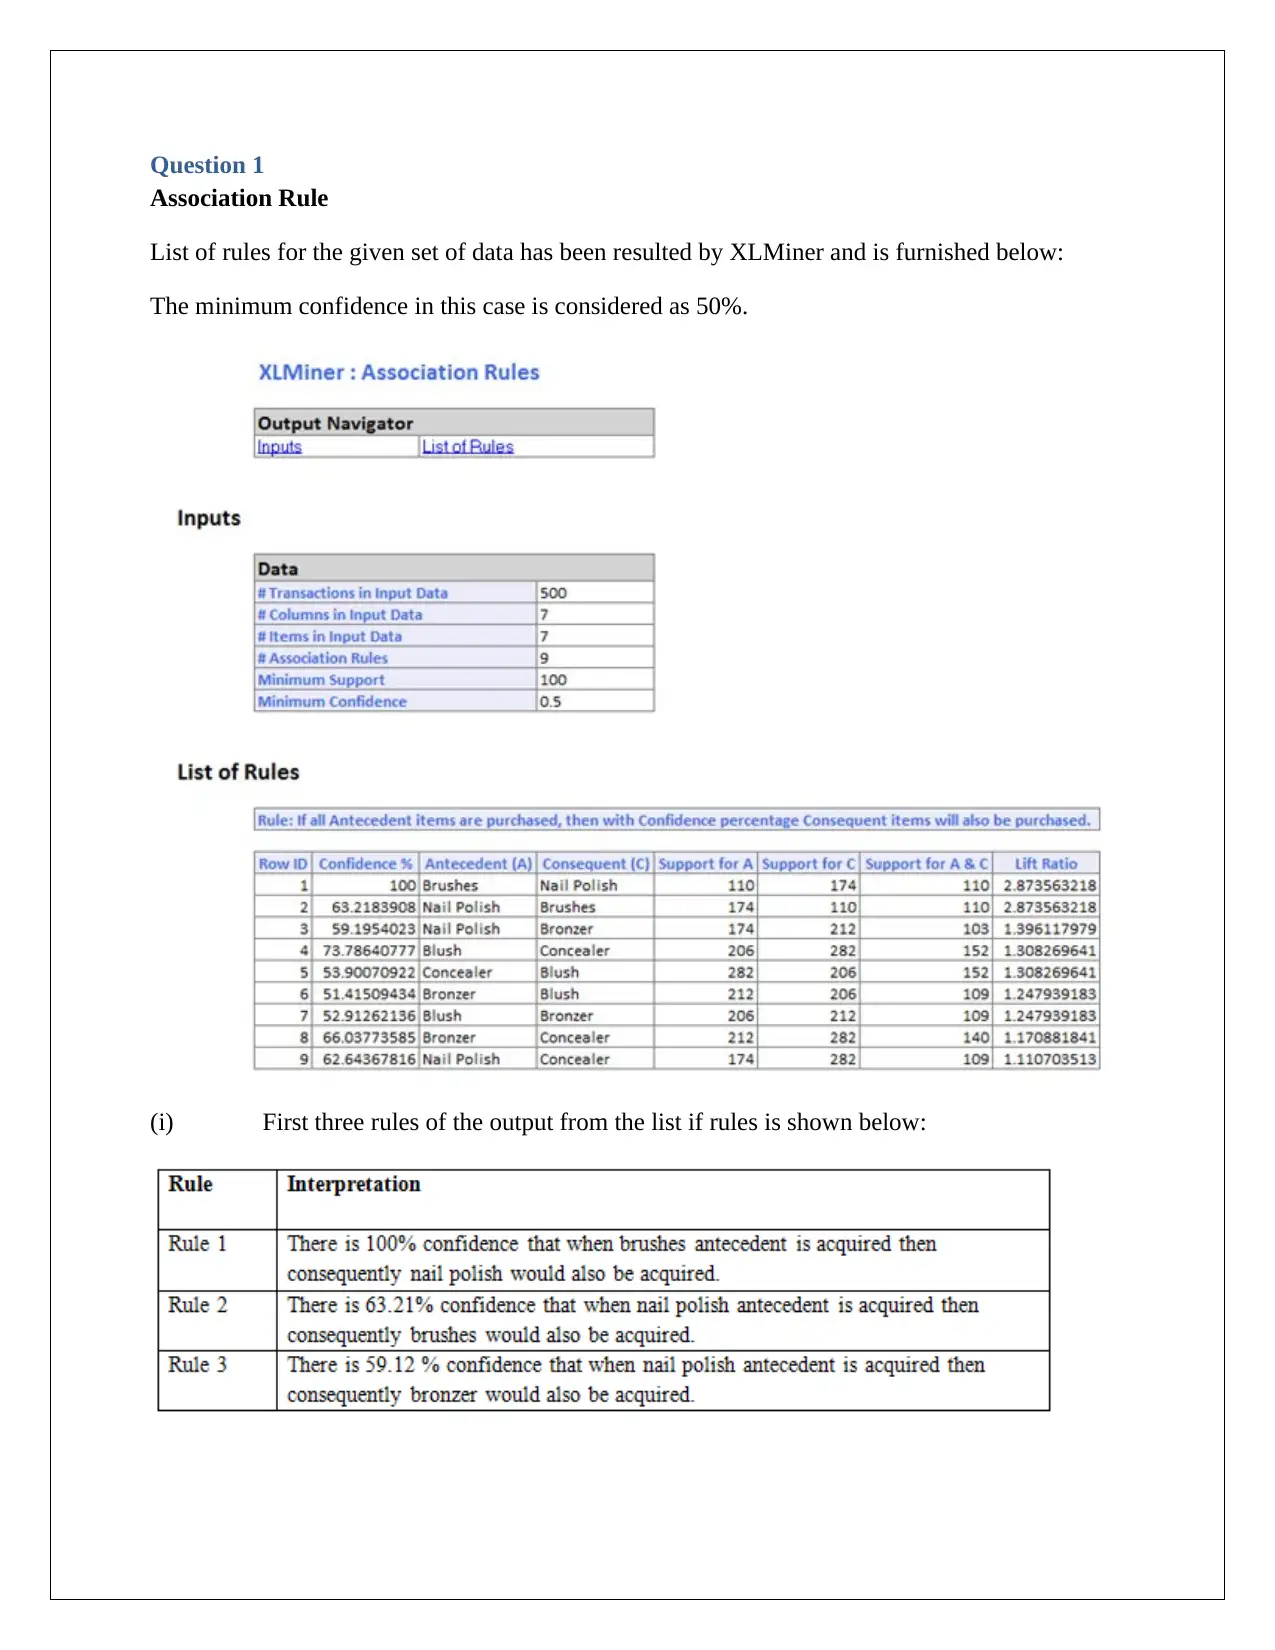
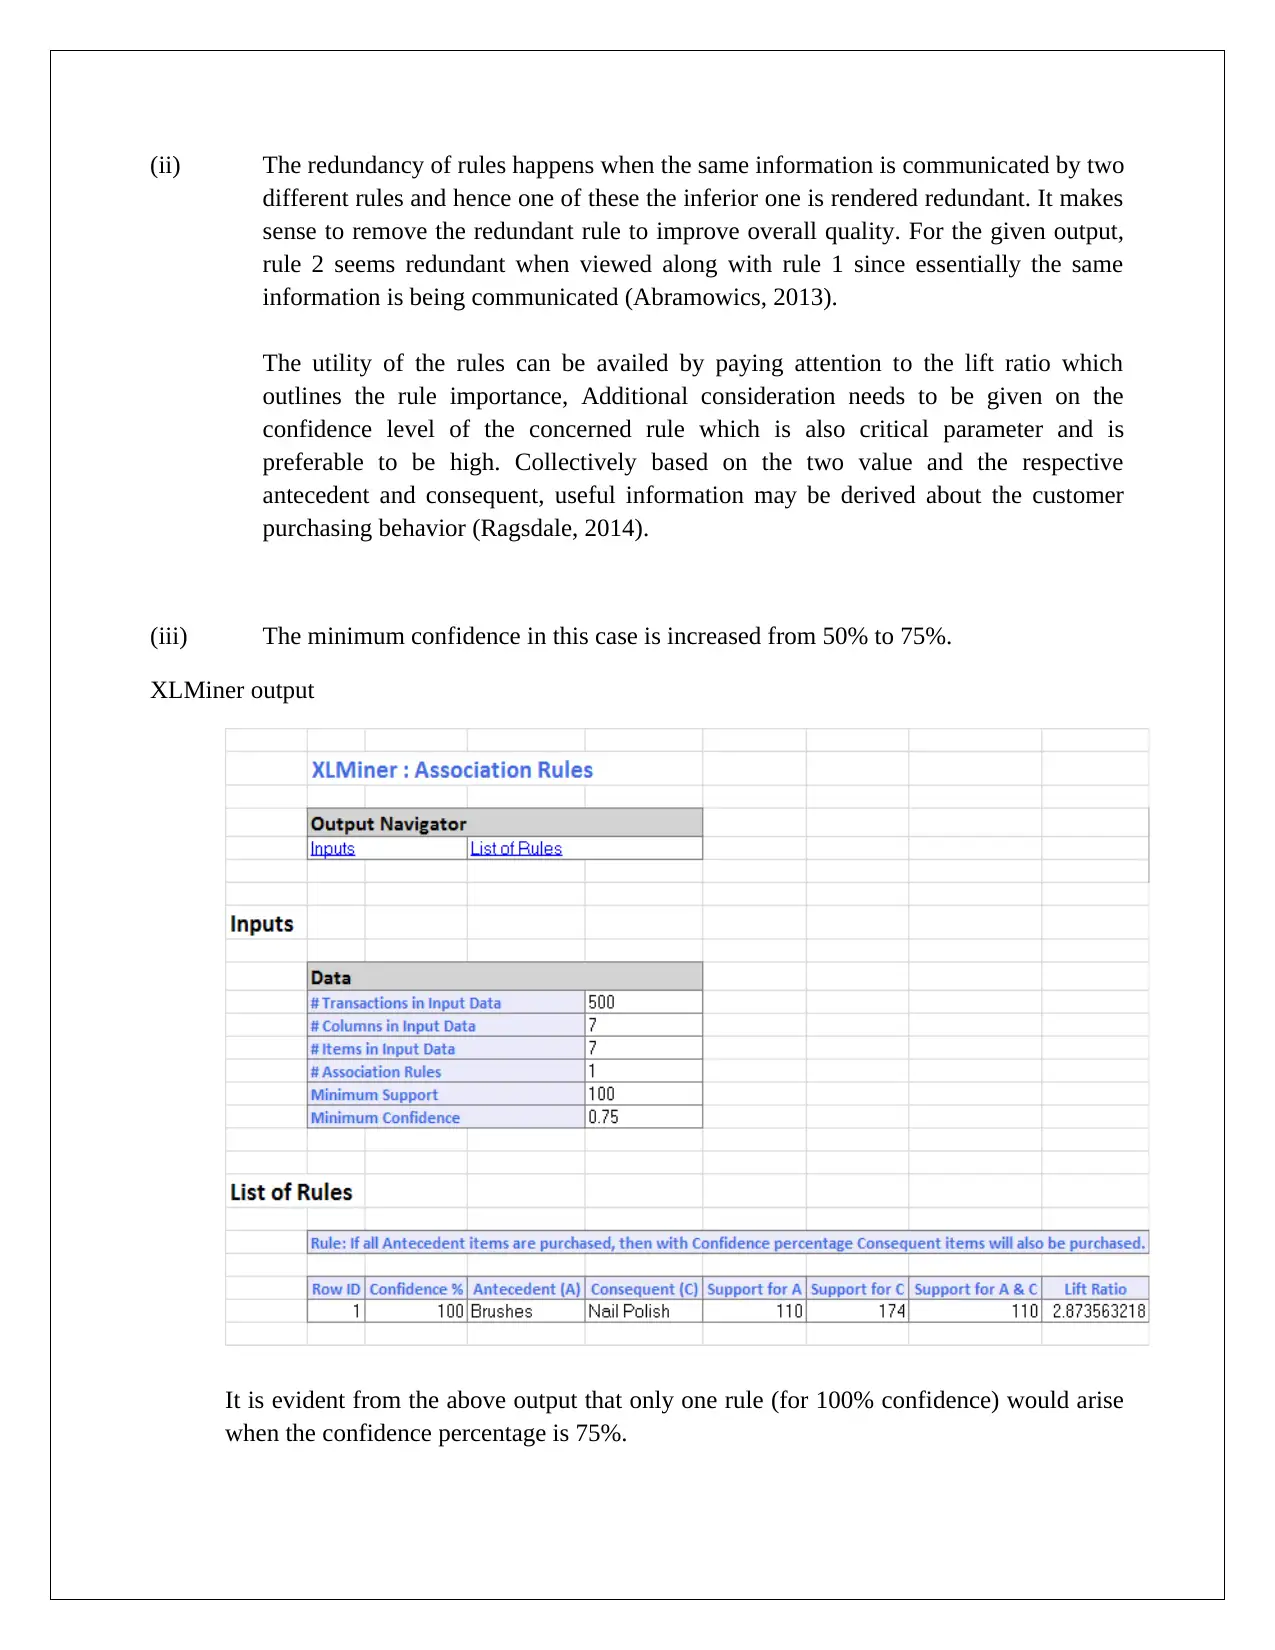
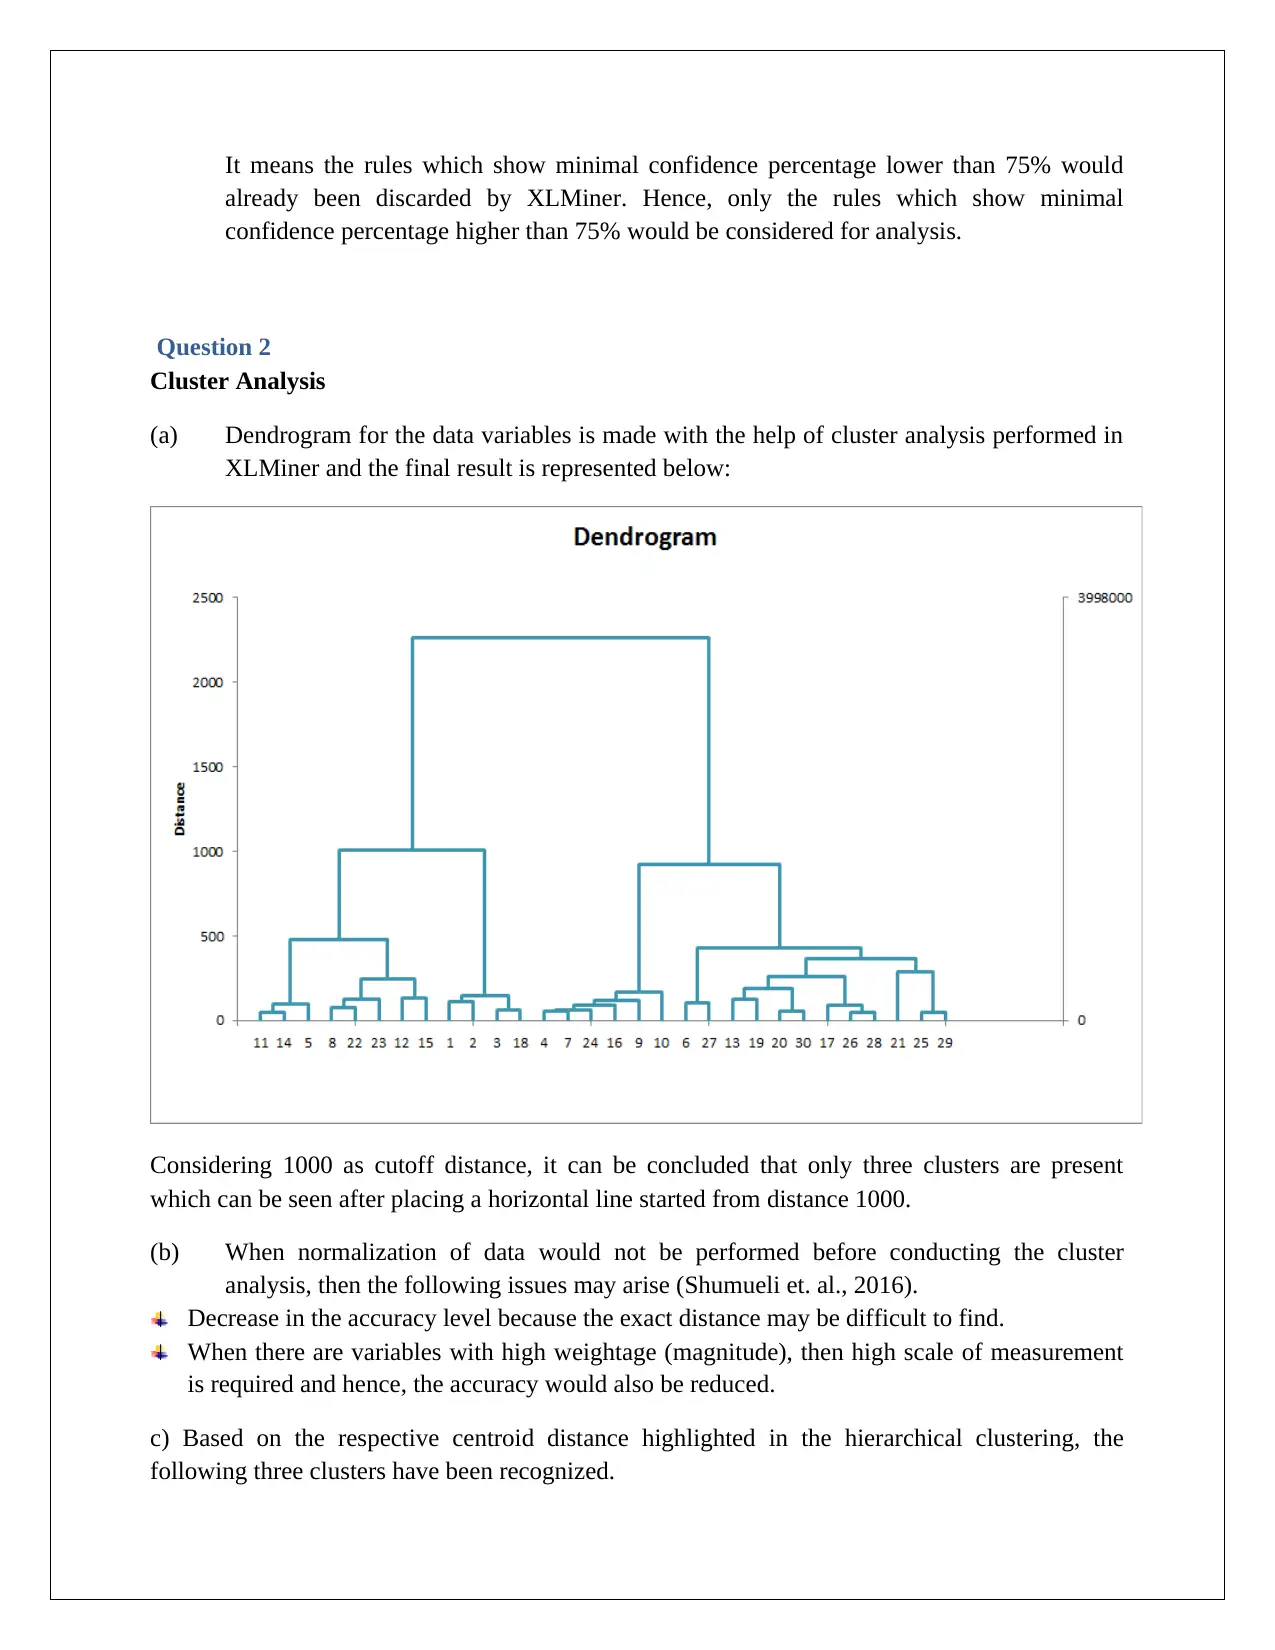
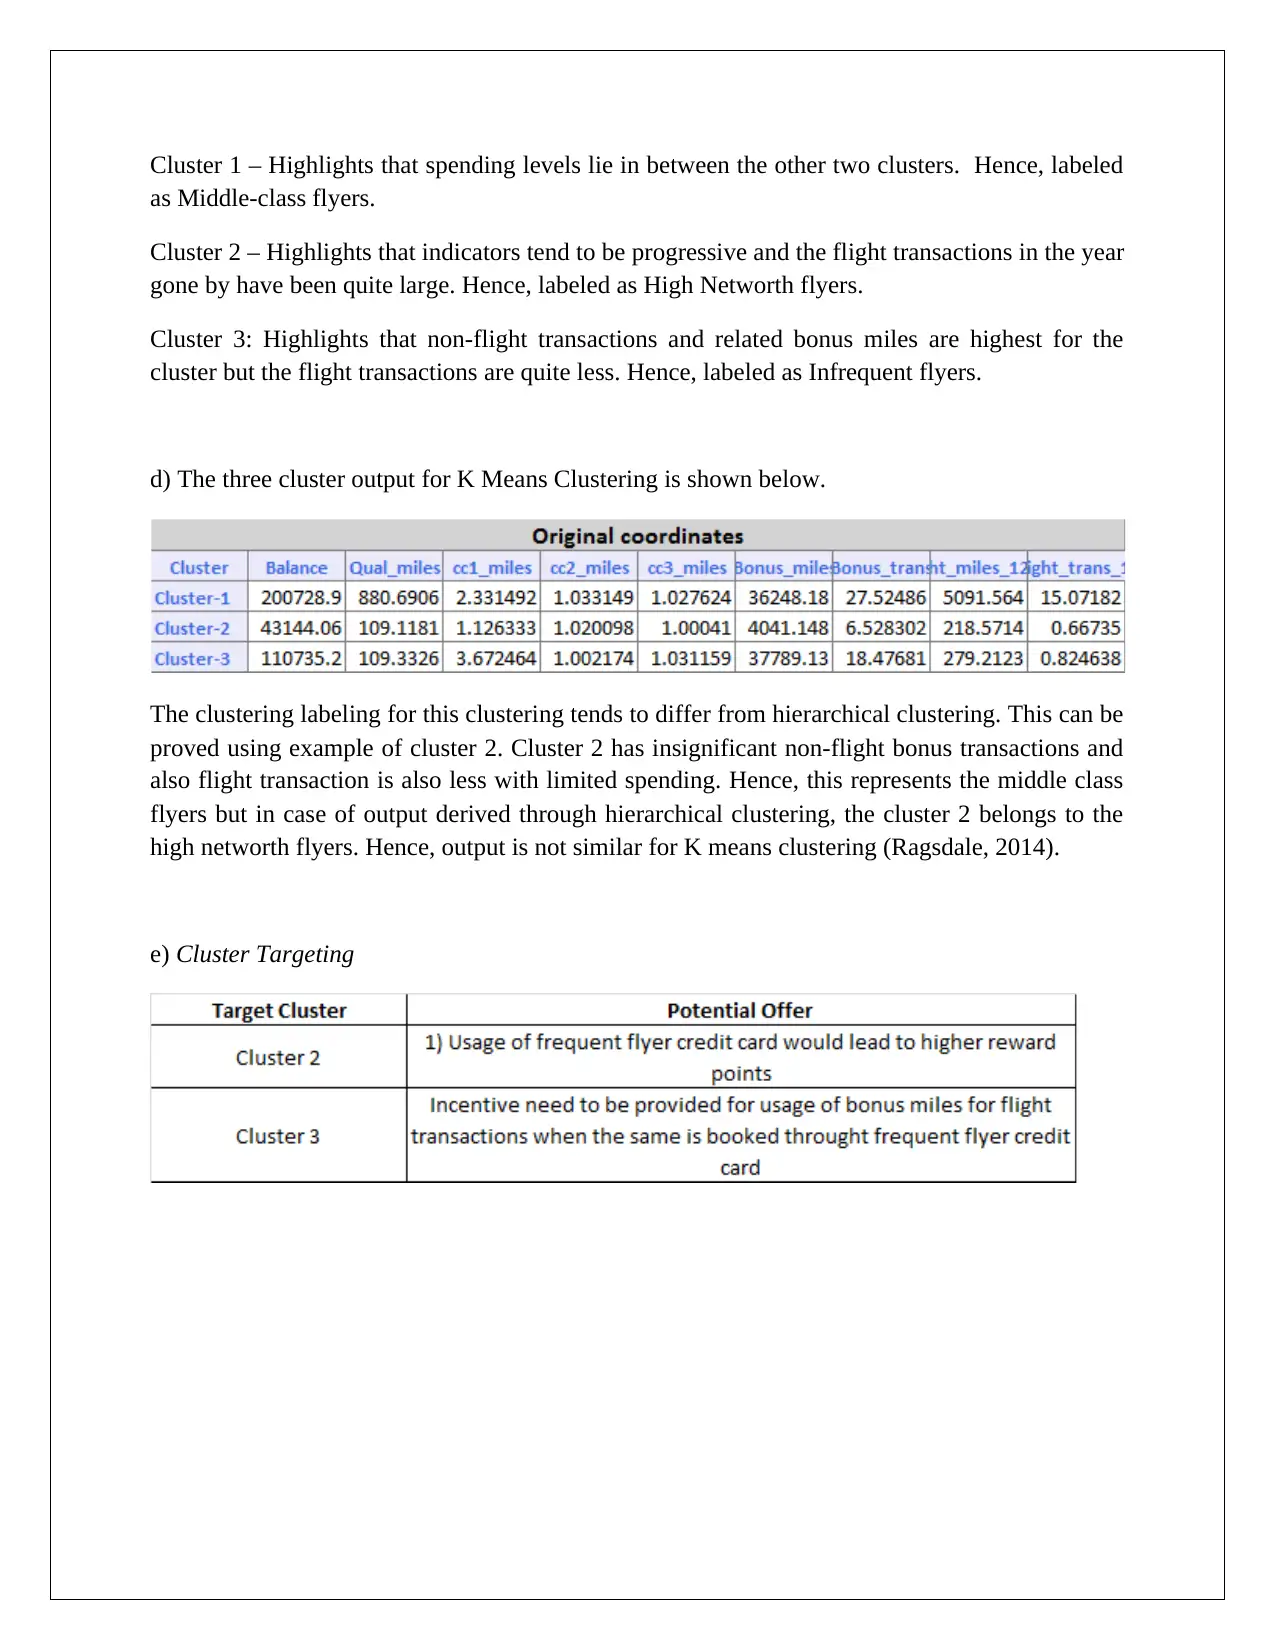
This data mining assignment solution addresses two primary questions: association rule mining and cluster analysis. The first part analyzes association rules generated by XLMiner, discussing rule redundancy, lift ratio, and confidence levels. It examines how increasing the minimum confidence affects rule generation. The second part focuses on cluster analysis, presenting a dendrogram and the impact of data normalization. It identifies and labels three clusters based on hierarchical clustering (Middle-class flyers, High Networth flyers, and Infrequent flyers) and compares these findings with K-means clustering results, highlighting differences in cluster labeling. The assignment also touches upon cluster targeting and provides relevant references.

DATA MINING
[Pick the date]
Student id
[Pick the date]
Student id
Paraphrase This Document
Need a fresh take? Get an instant paraphrase of this document with our AI Paraphraser

Table of Contents
Question 1........................................................................................................................................1
Question 2........................................................................................................................................4
Reference.........................................................................................................................................5

Question 1
Association Rule
List of rules for the given set of data has been resulted by XLMiner and is furnished below:
The minimum confidence in this case is considered as 50%.
(i) First three rules of the output from the list if rules is shown below:
Association Rule
List of rules for the given set of data has been resulted by XLMiner and is furnished below:
The minimum confidence in this case is considered as 50%.
(i) First three rules of the output from the list if rules is shown below:
⊘ This is a preview!⊘
Do you want full access?
Subscribe today to unlock all pages.

Trusted by 1+ million students worldwide

(ii) The redundancy of rules happens when the same information is communicated by two
different rules and hence one of these the inferior one is rendered redundant. It makes
sense to remove the redundant rule to improve overall quality. For the given output,
rule 2 seems redundant when viewed along with rule 1 since essentially the same
information is being communicated (Abramowics, 2013).
The utility of the rules can be availed by paying attention to the lift ratio which
outlines the rule importance, Additional consideration needs to be given on the
confidence level of the concerned rule which is also critical parameter and is
preferable to be high. Collectively based on the two value and the respective
antecedent and consequent, useful information may be derived about the customer
purchasing behavior (Ragsdale, 2014).
(iii) The minimum confidence in this case is increased from 50% to 75%.
XLMiner output
It is evident from the above output that only one rule (for 100% confidence) would arise
when the confidence percentage is 75%.
Paraphrase This Document
Need a fresh take? Get an instant paraphrase of this document with our AI Paraphraser

It means the rules which show minimal confidence percentage lower than 75% would
already been discarded by XLMiner. Hence, only the rules which show minimal
confidence percentage higher than 75% would be considered for analysis.
Question 2
Cluster Analysis
(a) Dendrogram for the data variables is made with the help of cluster analysis performed in
XLMiner and the final result is represented below:
Considering 1000 as cutoff distance, it can be concluded that only three clusters are present
which can be seen after placing a horizontal line started from distance 1000.
(b) When normalization of data would not be performed before conducting the cluster
analysis, then the following issues may arise (Shumueli et. al., 2016).
Decrease in the accuracy level because the exact distance may be difficult to find.
When there are variables with high weightage (magnitude), then high scale of measurement
is required and hence, the accuracy would also be reduced.
c) Based on the respective centroid distance highlighted in the hierarchical clustering, the
following three clusters have been recognized.

Cluster 1 – Highlights that spending levels lie in between the other two clusters. Hence, labeled
as Middle-class flyers.
Cluster 2 – Highlights that indicators tend to be progressive and the flight transactions in the year
gone by have been quite large. Hence, labeled as High Networth flyers.
Cluster 3: Highlights that non-flight transactions and related bonus miles are highest for the
cluster but the flight transactions are quite less. Hence, labeled as Infrequent flyers.
d) The three cluster output for K Means Clustering is shown below.
The clustering labeling for this clustering tends to differ from hierarchical clustering. This can be
proved using example of cluster 2. Cluster 2 has insignificant non-flight bonus transactions and
also flight transaction is also less with limited spending. Hence, this represents the middle class
flyers but in case of output derived through hierarchical clustering, the cluster 2 belongs to the
high networth flyers. Hence, output is not similar for K means clustering (Ragsdale, 2014).
e) Cluster Targeting
⊘ This is a preview!⊘
Do you want full access?
Subscribe today to unlock all pages.

Trusted by 1+ million students worldwide

Reference
Abramowics, W. (2013) Business Information Systems Workshops: BIS 2013 International
Workshops (5th ed.). New York: Springer.
Ragsdale, C. (2014) Spread sheet Modeling and Decision Analysis: A Practical Introduction to
Business Analytics (7th ed.). London: Cengage Learning.
Shumueli, G., Bruce, C.P., Yahav, I., Patel, R. N., Kenneth, C., & Lichtendahl, J. (2016) Data
Mining For Business Analytics: Concepts Techniques and Application (2nd ed.).London:
John Wiley & Sons.
1 out of 7
Related Documents

Your All-in-One AI-Powered Toolkit for Academic Success.
+13062052269
info@desklib.com
Available 24*7 on WhatsApp / Email
Unlock your academic potential
Copyright © 2020–2025 A2Z Services. All Rights Reserved. Developed and managed by ZUCOL.