ITC516: Data Mining and Visualization Business Case Analysis I
VerifiedAdded on 2020/03/23
|12
|1608
|142
Homework Assignment
AI Summary
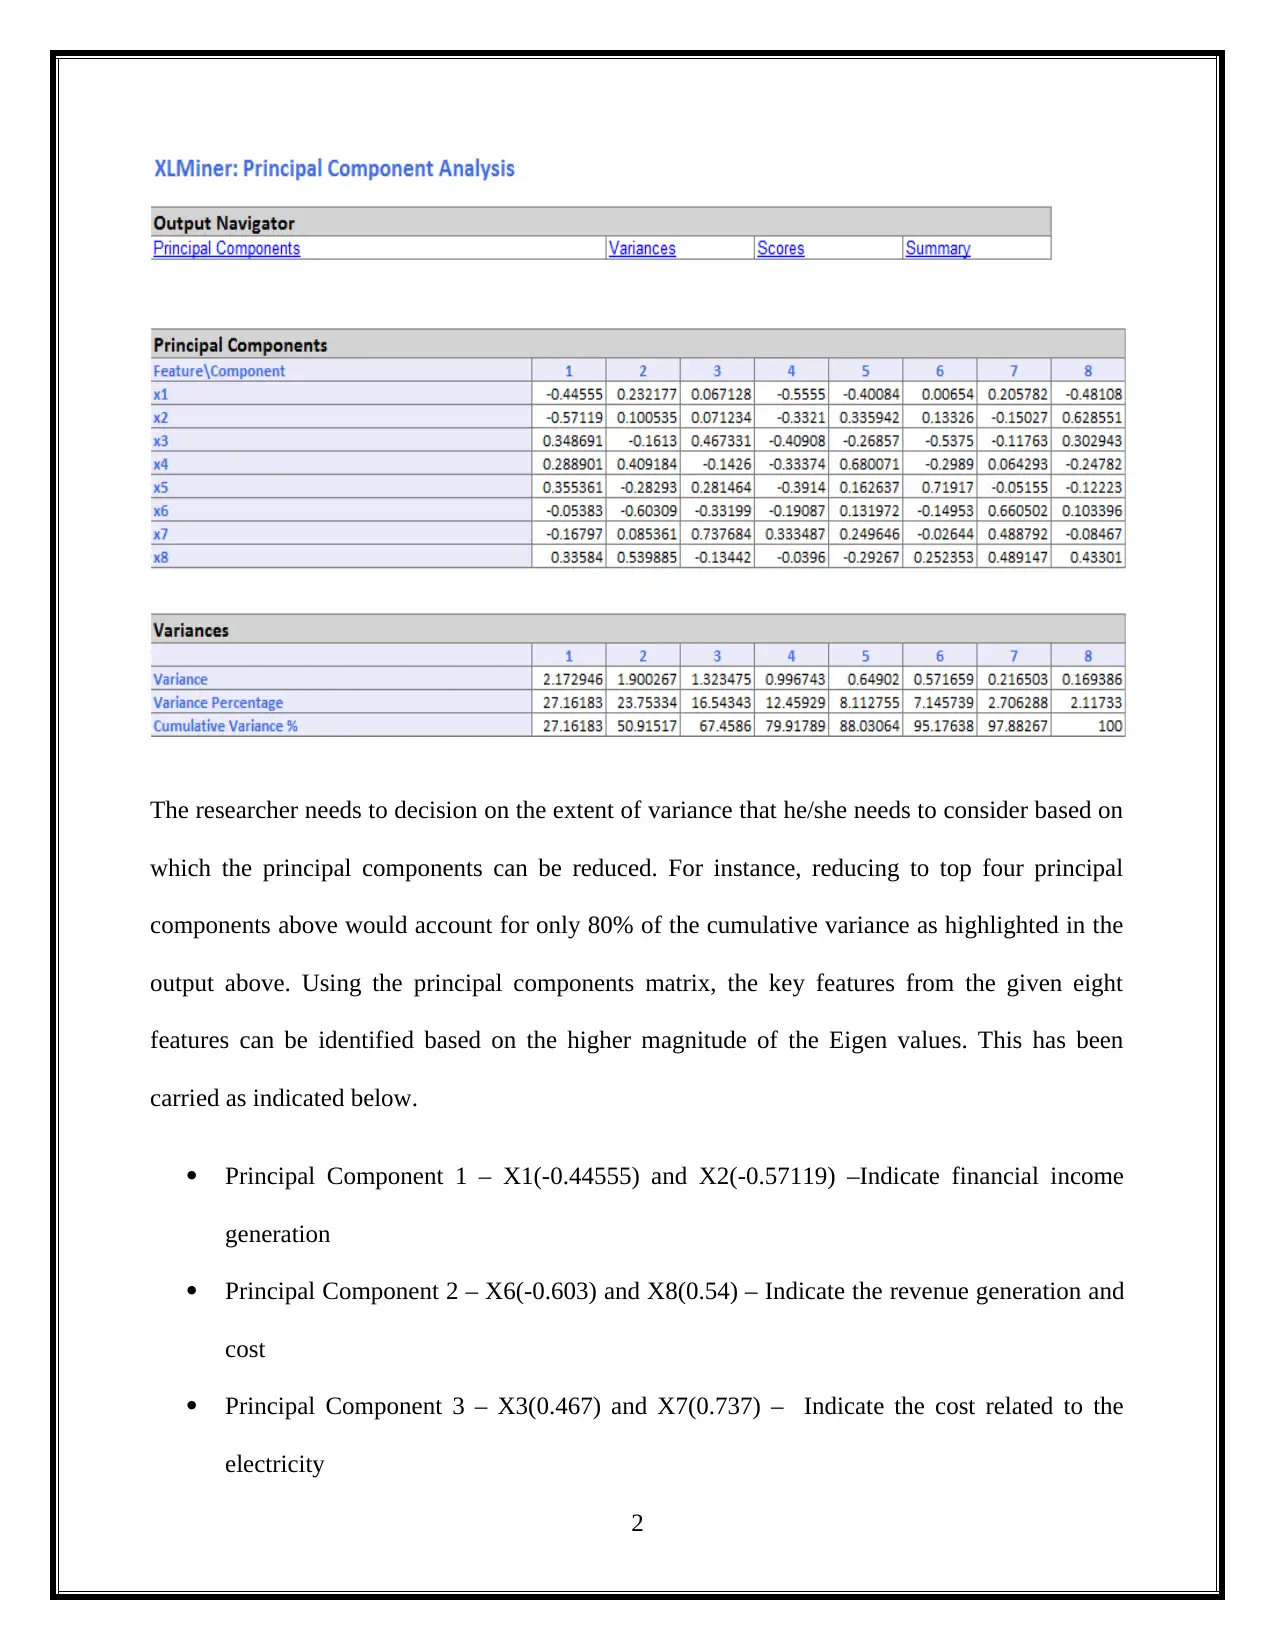
This document provides a comprehensive solution to a data mining assignment, addressing key concepts in business intelligence. It begins with an analysis of Principal Component Analysis (PCA), detailing the principal component matrix, variance, and feature selection for US utilities data. The solution explores the advantages and disadvantages of PCA. Subsequently, the assignment delves into a loan acceptance case study using a dataset of 5000 observations. It includes pivot table analysis to determine probabilities related to loan acceptance based on online banking usage and credit card ownership. The solution also calculates probabilities using Naive Bayes and concludes with a strategy for customers to increase their chances of loan approval.

ITC516 – DATA MINING AND VISUALIZATION FOR BUSINESS INTELLIGENCE
BUSINESS CASE ANALYSIS I
STUDENT ID AND NAME
[Pick the date]
BUSINESS CASE ANALYSIS I
STUDENT ID AND NAME
[Pick the date]
Paraphrase This Document
Need a fresh take? Get an instant paraphrase of this document with our AI Paraphraser

Question 1
Part A
The most imperative component of Principal Component Analysis (PCA) is arguably the
principal component matrix. This essentially highlights the relevant eigen values which can be
used to derive the score through the coefficients in the matrix. Another key result obtained
through PCA is the total variance matrix which not only highlights the need for normalisation
but simultaneously also enables identification of critical principal components. In this regards,
preference would be given to those which tend to account for higher variance. On the other hand,
there are certain principal components where the variance contribution is quite limited which
leads to these being discarded and considered as noise. For the given data on 32 US utilities, the
PCA result as derived through the use of XL miner is indicated as follows.
1

The researcher needs to decision on the extent of variance that he/she needs to consider based on
which the principal components can be reduced. For instance, reducing to top four principal
components above would account for only 80% of the cumulative variance as highlighted in the
output above. Using the principal components matrix, the key features from the given eight
features can be identified based on the higher magnitude of the Eigen values. This has been
carried as indicated below.
Principal Component 1 – X1(-0.44555) and X2(-0.57119) –Indicate financial income
generation
Principal Component 2 – X6(-0.603) and X8(0.54) – Indicate the revenue generation and
cost
Principal Component 3 – X3(0.467) and X7(0.737) – Indicate the cost related to the
electricity
2
⊘ This is a preview!⊘
Do you want full access?
Subscribe today to unlock all pages.

Trusted by 1+ million students worldwide

Principal Component 4 – X1(-0.56) and X3(-0.41) – Indicate the cost structure with
emphasis on fixed costs
Further reduction of the above features may also be done considering the exact magnitude
corresponding to the various features and the respective significance of the principal components
obtained above.
Need for normalisation
A key drawback of PCA is that the variables on account of different scale of measurement may
require normalisation before PCA can be initiated. This is especially the case for the variables
when the scale of data of some variable tends to be very different from others. For instance
assume one variable varies between 0 and 1, while the other variable varies between 0 and 100.
Obviously, the variance of the variable having a larger range would be higher and hence it would
impact the PCA as the importance of this variable would be overwhelmingly high. For the data
on US utilities even though there are variables such as x3 and x6 for whom the variance would
be significantly higher in comparison to other variables such as x1 and x5 and hence it would be
advisable that normalisation would be done for better accuracy.
PART (B)
Advantages of principal component analysis
Low noise sensitivity technique
This covers the main factors i.e. standard deviation, eigenvectors and covariance of
original data into the new formed principal component.
3
Paraphrase This Document
Need a fresh take? Get an instant paraphrase of this document with our AI Paraphraser

It provides detailed information regarding the structural distribution of data
Lowers down the large number dimensions into smaller dimensions
Disadvantages of principal component analysis
Seems not appropriate technique to use for variable set while they are related by non-
linear relation. For example, PCA fails to analyze the “complex biological system”
When the principal components numbers are significant,then the evaluation of covariance
matrix is difficult.
It is considered as “Unsupervised technique” because it cannot be used for distribution
other than Gaussian distribution and for images which has no class labels.
Question 2
The aim is to compute the measurement for the personal loan acceptance based on the analysis
performed on the selected trainee set.
Total data set observation = 5000
Total number of variables = 14
Partition into training = 60%
Partition into validation = 40%
Standard partition of the XLMiner Analytical Tool has been used in excel add in to determine the
partition training data.
4

PART (A)
Description
Training data has been taken into account to create the pivot table which represents the relations
among the three variables.
Variable 1 - Online “Whether or not the customer is an active user of the online net banking
service of universal bank.” The value 0 says “No” and the value 1 says “Yes.” (Column Label)
Variable 2 – Credit Card “Whether or not the customer holds credit card of universal bank.” The
value 0 says “No” and the value 1 says “Yes.” (First Row Label)
Variable 3 - Loan “Whether or not the customer would accept loan offer of universal bank.” The
value 0 says “No” and the value 1 says “Yes.” (Second Row Label)
Pivot Table
PART (B)
Calculation of probability that this customer (who owns credit card and actively utilizing online
net banking service of universal bank) will accept the loan offer extended by universal bank is
show below:
5
⊘ This is a preview!⊘
Do you want full access?
Subscribe today to unlock all pages.

Trusted by 1+ million students worldwide

Favorable case:
Number of universal bank customers who owns credit card and actively utilizing online net
banking service of universal bank.
It can be determined by taking (CC =1∨Online=1) in the pivot table shown below = 51
Total possible cases:
Number of universal bank customers who owns credit card and actively utilizing online net
banking service of universal bank would also accepted loan offer extended by universal bank.
It can be determined by taking ( CC =1|Loan=1 ,Online=1 ¿ in the pivot table shown below =
522
Therefore, the probability = Favorable case / Total possible cases
¿ 51
522=0.0978∨9.78 %
6
Number of universal bank customers who owns credit card and actively utilizing online net
banking service of universal bank.
It can be determined by taking (CC =1∨Online=1) in the pivot table shown below = 51
Total possible cases:
Number of universal bank customers who owns credit card and actively utilizing online net
banking service of universal bank would also accepted loan offer extended by universal bank.
It can be determined by taking ( CC =1|Loan=1 ,Online=1 ¿ in the pivot table shown below =
522
Therefore, the probability = Favorable case / Total possible cases
¿ 51
522=0.0978∨9.78 %
6
Paraphrase This Document
Need a fresh take? Get an instant paraphrase of this document with our AI Paraphraser

Based on the above, it can be seen that only 9.78% of the customers of universal bank who owns
credit card and actively utilizing online net banking service of universal bank will accept the loan
offer extended by universal bank.
PART C
Description
In this part, the objective is to make two different pivot tables which would be used to find the
given quantities P (A|B) i.e. probability of A given B.
For pivot table 1:
Variable 1 - Online “Whether or not the customer is an active user of the online net banking
service of universal bank.” The value 0 says “No” and the value 1 says “Yes.” (Column Label)
Variable 3 - Loan “Whether or not the customer would accept loan offer of universal bank.” The
value 0 says “No” and the value 1 says “Yes.” (Row Label)
For pivot table 2:
Variable 1- Credit Card “Whether or not the customer holds credit card of universal bank.” The
value 0 says “No” and the value 1 says “Yes.” (Column Label)
Variable 3 - Loan “Whether or not the customer would accept loan offer of universal bank.” The
value 0 says “No” and the value 1 says “Yes.” (Row Label)
7

Probability determination
(i) P ( CC=1|Loan=1 ¿
Favorable case:
Number of universal bank customers who owns credit card and would accept loan offer of
universal bank.
It can be determined by taking (CC =1∨Loan=1) in the pivot table shown below = 93
Total case:
Total number of universal bank customers who owns credit card and would accept loan offer of
universal bank (CC=1∨Loan=1) total=304
P ( CC=1|Loan=1 ¿= 93
304 =0.305
(ii) P ( Online=1|Loan=1 ¿
Favorable case:
8
⊘ This is a preview!⊘
Do you want full access?
Subscribe today to unlock all pages.

Trusted by 1+ million students worldwide

Number of universal bank customers who usages online service and would accept loan offer of
universal bank.
It can be determined by taking (Online=1∨Loan=1) in the pivot table shown below = 183
Total case:
Total number of universal bank customers who owns credit card and would accept loan offer of
universal bank (Online=1∨Loan=1)total=304
P ( Online=1|Loan=1 ¿= ( 183
304 )=0.601
(iii) P ( Loan=1 )
Favorable case:
Number of universal bank customers who would accept loan offer of universal bank (total) =304
Total case:
Total number of observation = 3000
P ( Loan=1 ) = ( 304
3000 )=0.101
(iv) P ( CC=1|Loan=0¿
Favorable case:
Number of universal bank customers who would accept loan offer of universal bank but has
credit card = 800
9
Paraphrase This Document
Need a fresh take? Get an instant paraphrase of this document with our AI Paraphraser

Total case:
Total number of observation = 2696
P ( CC=1|Loan=0¿= ( 800
2696 )=0.296
(v) P ( Online=1|Loan=0 ¿
Favorable case:
Number of universal bank customers who would not accept loan offer of universal bank but has
online bank services. = 1586
Total case:
Total number of observation = 2696
P ( Online=1|Loan=0 ¿=( 1586
2696 )=0.588
(vi) P ( Loan=0 )
Favorable case:
Number of universal bank customers who would not accept loan offer of universal bank = 2696
Total case:
Total number of observation = 3000
P ( Loan=0 ) =( 2696
3000 )=0.898
10
Total number of observation = 2696
P ( CC=1|Loan=0¿= ( 800
2696 )=0.296
(v) P ( Online=1|Loan=0 ¿
Favorable case:
Number of universal bank customers who would not accept loan offer of universal bank but has
online bank services. = 1586
Total case:
Total number of observation = 2696
P ( Online=1|Loan=0 ¿=( 1586
2696 )=0.588
(vi) P ( Loan=0 )
Favorable case:
Number of universal bank customers who would not accept loan offer of universal bank = 2696
Total case:
Total number of observation = 3000
P ( Loan=0 ) =( 2696
3000 )=0.898
10

PART (D)
Naive Bayes probability calculation
In the calculation of Naive Bayes probability, the numerator contains the multiplication of
proportion of (Loan = 1) = ( 0.305∗0.601∗0.101 )=0.0185
Numerator of conditional probability would be multiplication of proportion of (Loan =0) =
( 0.296∗0.588∗0.898 )=0.156
Finally, the denominator of Naive Bayes probability is the sum of these two conditional
probabilities = ( 0.305∗0.601∗0.101 )+ ( 0.296∗0.588∗0.898 )=0.174
Probability P( Loan=1∨CC =1 ,Online=1) = 0.0185/0.174 = 0.106
Therefore, the Naive Bayes probability is 0.106.
PART E
In order for the customer to increase chances of loan offering, they must be frequent users of the
online banking services and simultaneously must also hold bank’s credit card. This combination
would form the optimum or best strategy for the customer.
11
⊘ This is a preview!⊘
Do you want full access?
Subscribe today to unlock all pages.

Trusted by 1+ million students worldwide
1 out of 12
Related Documents
Your All-in-One AI-Powered Toolkit for Academic Success.
+13062052269
info@desklib.com
Available 24*7 on WhatsApp / Email
Unlock your academic potential
Copyright © 2020–2026 A2Z Services. All Rights Reserved. Developed and managed by ZUCOL.


