Data Mining Business Case Analysis
VerifiedAdded on 2020/03/16
|10
|1041
|141
Report
AI Summary
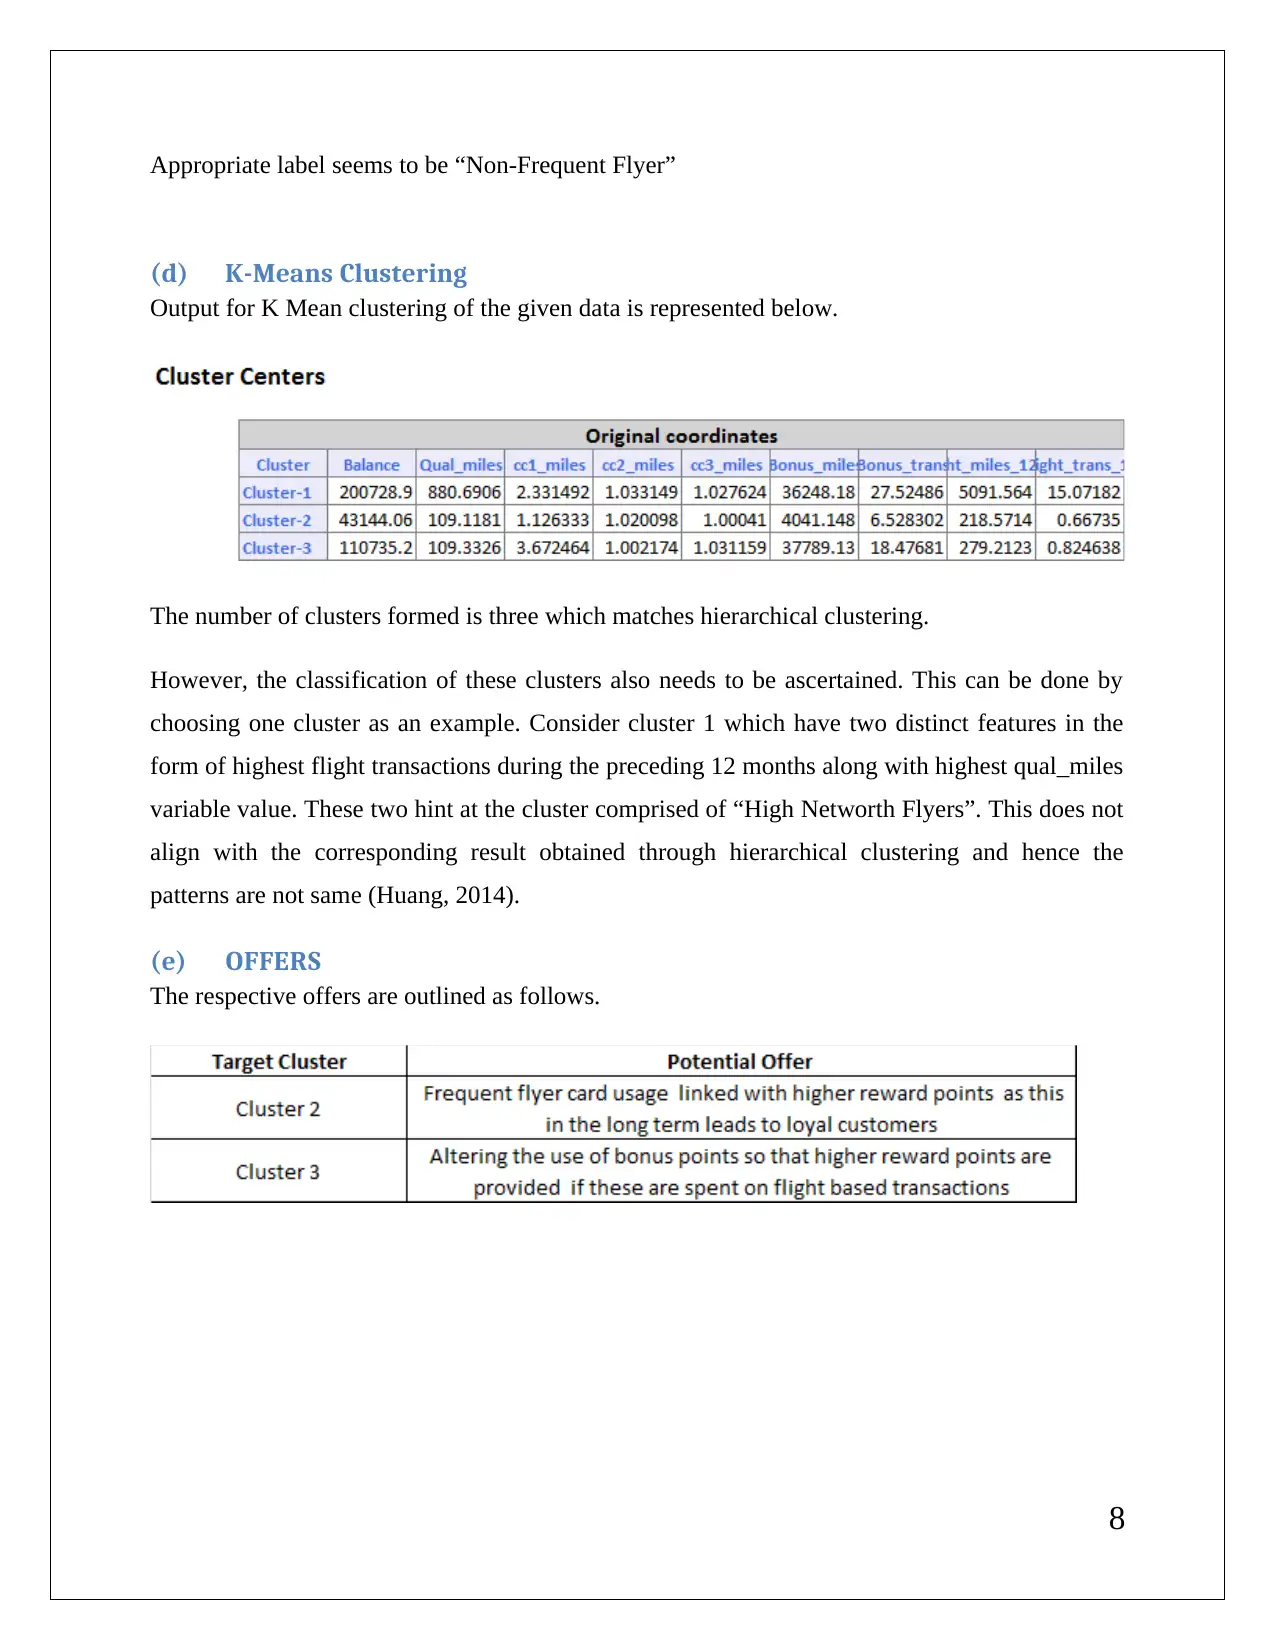
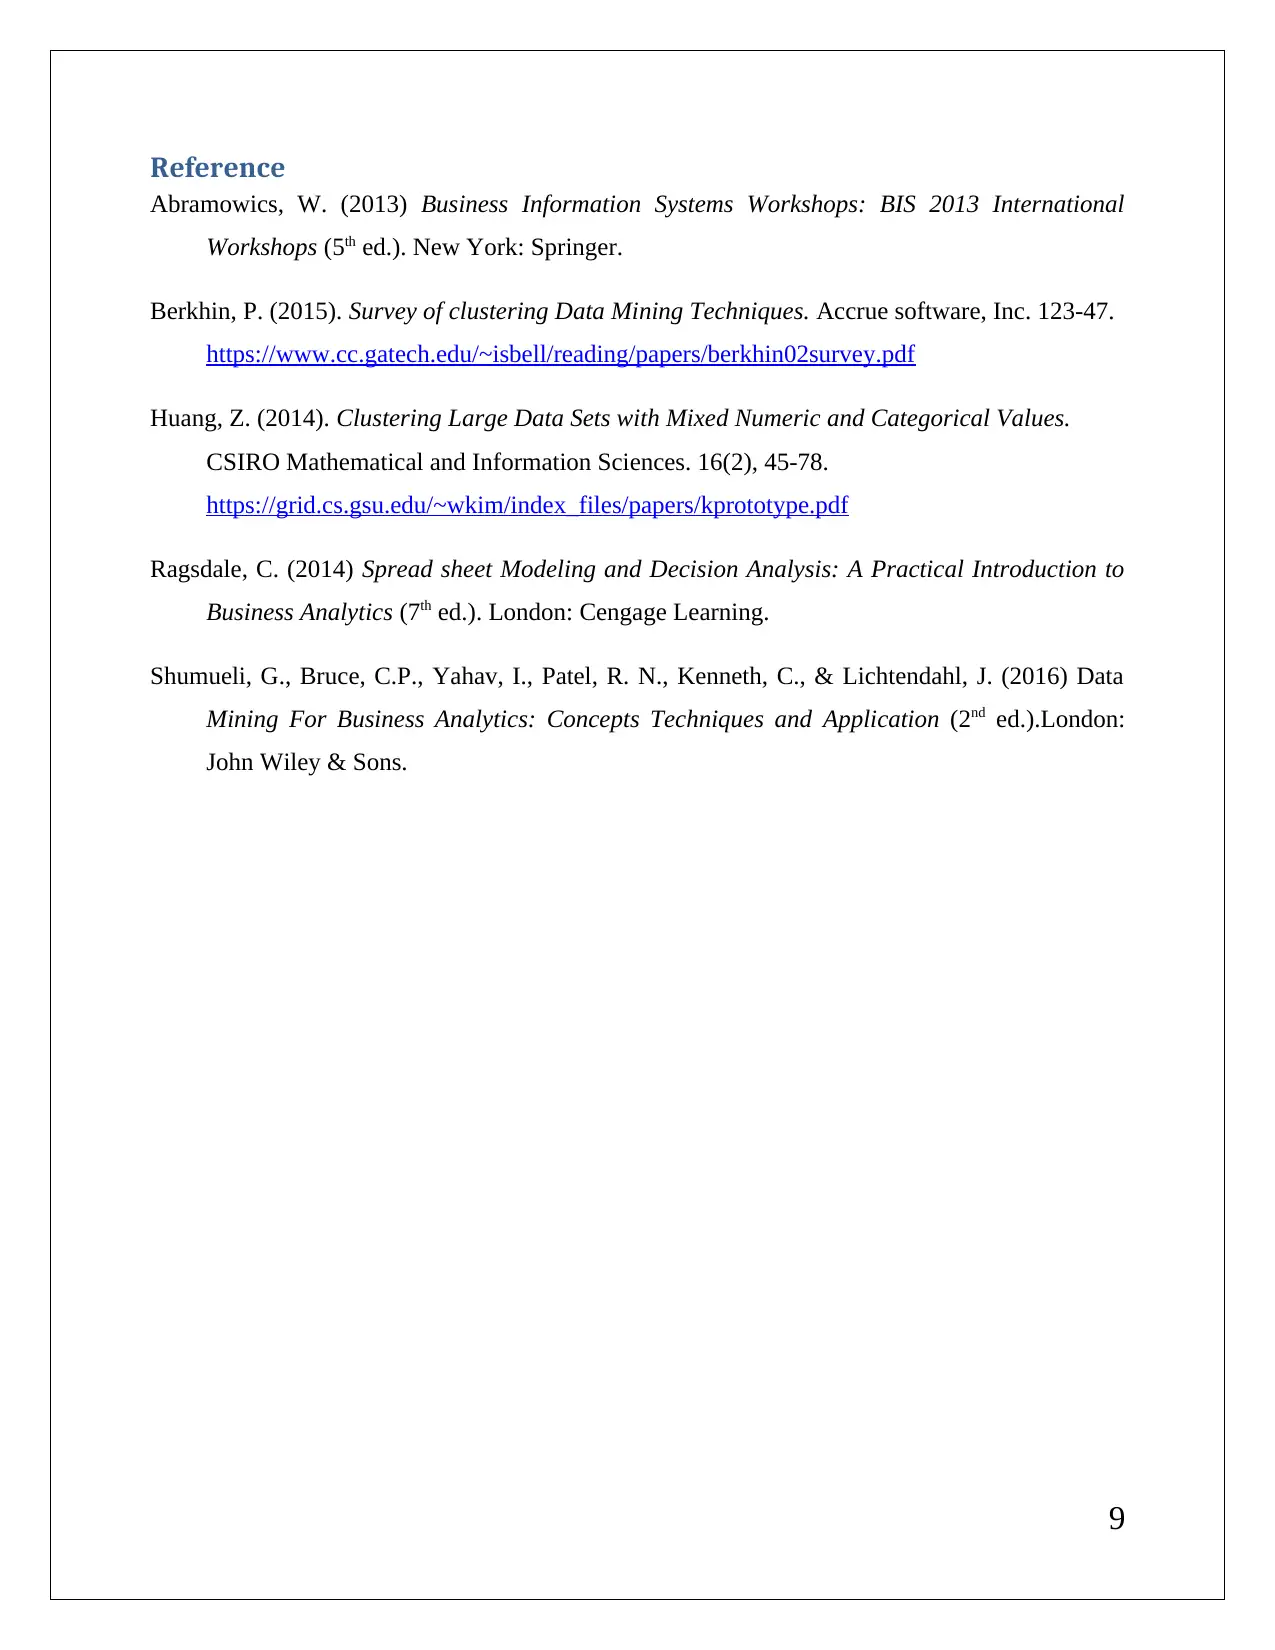
This report presents a comprehensive analysis of data mining techniques applied to a business case. It includes detailed interpretations of association rules, redundancy analysis, and clustering outputs using XLMiner. The report discusses the implications of minimum confidence intervals on rule utility and the necessity of data normalization in clustering. It also provides insights into cluster labeling and the results of K-Means clustering, highlighting the differences in patterns observed. References to relevant literature are included to support the findings.

DATA MINING
Business case Analysis
[Pick the date]
Student Name/ID
Business case Analysis
[Pick the date]
Student Name/ID
Paraphrase This Document
Need a fresh take? Get an instant paraphrase of this document with our AI Paraphraser

Table of Contents
Question 1........................................................................................................................................2
(i) Association Rule...................................................................................................................2
(ii) Redundancy of Association Rules....................................................................................3
(iii) Minimum Confidence Interval = 75%..............................................................................3
Question 2........................................................................................................................................4
(a) Hierarchical Clustering Output.........................................................................................4
(b) Need for normalisation......................................................................................................5
(c) Cluster Labeling................................................................................................................6
(d) K-Means Clustering..........................................................................................................8
(e) OFFERS............................................................................................................................8
Reference.........................................................................................................................................9
1

Question 1
XLMiner output for the given data set with 0.5 minimum confidence percentage.
(i) Association Rule
Interpretation of rule 1 - Confidence % is 100 for the fact if one has acquired antecedent item
brushes, then he/she will also acquire consequent item nail polish.
Interpretation of rule 2 - Confidence % is 63.21 for the fact if one has acquired antecedent item
nail polish, then he/she will also acquire consequent item brushes.
2
⊘ This is a preview!⊘
Do you want full access?
Subscribe today to unlock all pages.

Trusted by 1+ million students worldwide

Interpretation of rule 3 - Confidence % is 100 for the fact if one has acquired antecedent item
nail polish, then he/she will also acquire consequent item bronzer.
(ii) Redundancy of Association Rules
The given association rule is designated as redundant is the support observed in a particular rule
is as per the expected level which is derived from the rule that acts as the ancestor. In order to
understand this better, take for example rule 2 and compare it with rule 1. The lift ratio which is
representative of the support is the same for both the cases. Hence, rule 1 suffices and renders
rule 2 redundant (Abramowics, 2013).
The utility of the association rules can be commented on by considering their relative support
and confidence. The two properties essentially tend to determine the utility of a given rule in
understanding and presenting critical information about customer buying behavior. Further,
reasonable values of these two must be maintained when producing the output so that the end
objective can be achieved (Shumueli et. al., 2016).
(iii) Minimum Confidence Interval = 75%
Now, the confidence % becomes 0.75 rather than 0.50. The XLMiner output is shown below:
3
Paraphrase This Document
Need a fresh take? Get an instant paraphrase of this document with our AI Paraphraser

The effect of change in the confidence % is clearly visible in the XLMiner output because the
number of rules has been reduced by a significant number. Hence, only the association rule
which highlights more confidence % with respect to the minimum confidence % i.e. 75% would
present in the list of rules and rest of the rules would get diminished. However, increasing the
confidence interval may adversely impact the utility of the association rules as rules which are
significant may be ignored since they do not meet the threshold confidence interval (Ragsdale,
2014).
Question 2
(a) Hierarchical Clustering Output
4

Dendrogram for hierarchical clustering by using XLMiner is presented below:
Let the cutoff distance for determining number of clusters in the dendrogram be around 1000,
and then it would be fair to say that only three major clusters are visible which is consistent with
the choice made during the hierarchical clustering process.
(b) Need for normalisation
The set of issues rise when data normalization does not perform in clustering (Shumueli et. al.,
2014).
Reduction in accuracy of the output
Hard to find the number of cluster formed
Difficult to find the centroid distance accurately especially when data with large magnitude
is taken into account
5
⊘ This is a preview!⊘
Do you want full access?
Subscribe today to unlock all pages.

Trusted by 1+ million students worldwide

(c) Cluster Labeling
The cluster characteristics would essentially determine the label provided as is apparent from the
relevant output obtained in XL Miner (Berkhin, 2015).
Cluster 1 output is indicative of absence of any qual_miles indicating that these do not seem to
be frequent fliers. Also, the spending level seems to be on the lower side considering transactions
carried out in the past 12 months.
Appropriate label seems to be “Middle Class Flyer”
6
Paraphrase This Document
Need a fresh take? Get an instant paraphrase of this document with our AI Paraphraser

Cluster 2 output is indicative of high transactions being carried out which includes both flight
and non-flight. Also, the miles balance which can lead to awards are significantly high.
Appropriate label seems to be “High Networth Flyer”
Cluster 3 output is indicative of high transactions being carried out in non -flight but flight
transactions tend to lag behind based on the given data.
7
and non-flight. Also, the miles balance which can lead to awards are significantly high.
Appropriate label seems to be “High Networth Flyer”
Cluster 3 output is indicative of high transactions being carried out in non -flight but flight
transactions tend to lag behind based on the given data.
7

Appropriate label seems to be “Non-Frequent Flyer”
(d) K-Means Clustering
Output for K Mean clustering of the given data is represented below.
The number of clusters formed is three which matches hierarchical clustering.
However, the classification of these clusters also needs to be ascertained. This can be done by
choosing one cluster as an example. Consider cluster 1 which have two distinct features in the
form of highest flight transactions during the preceding 12 months along with highest qual_miles
variable value. These two hint at the cluster comprised of “High Networth Flyers”. This does not
align with the corresponding result obtained through hierarchical clustering and hence the
patterns are not same (Huang, 2014).
(e) OFFERS
The respective offers are outlined as follows.
8
⊘ This is a preview!⊘
Do you want full access?
Subscribe today to unlock all pages.

Trusted by 1+ million students worldwide

Reference
Abramowics, W. (2013) Business Information Systems Workshops: BIS 2013 International
Workshops (5th ed.). New York: Springer.
Berkhin, P. (2015). Survey of clustering Data Mining Techniques. Accrue software, Inc. 123-47.
https://www.cc.gatech.edu/~isbell/reading/papers/berkhin02survey.pdf
Huang, Z. (2014). Clustering Large Data Sets with Mixed Numeric and Categorical Values.
CSIRO Mathematical and Information Sciences. 16(2), 45-78.
https://grid.cs.gsu.edu/~wkim/index_files/papers/kprototype.pdf
Ragsdale, C. (2014) Spread sheet Modeling and Decision Analysis: A Practical Introduction to
Business Analytics (7th ed.). London: Cengage Learning.
Shumueli, G., Bruce, C.P., Yahav, I., Patel, R. N., Kenneth, C., & Lichtendahl, J. (2016) Data
Mining For Business Analytics: Concepts Techniques and Application (2nd ed.).London:
John Wiley & Sons.
9
1 out of 10
Related Documents

Your All-in-One AI-Powered Toolkit for Academic Success.
+13062052269
info@desklib.com
Available 24*7 on WhatsApp / Email
Unlock your academic potential
Copyright © 2020–2025 A2Z Services. All Rights Reserved. Developed and managed by ZUCOL.