NIT3171 ICT Business Analysis & Data Visualization: Case Study Report
VerifiedAdded on 2023/04/25
|12
|1562
|270
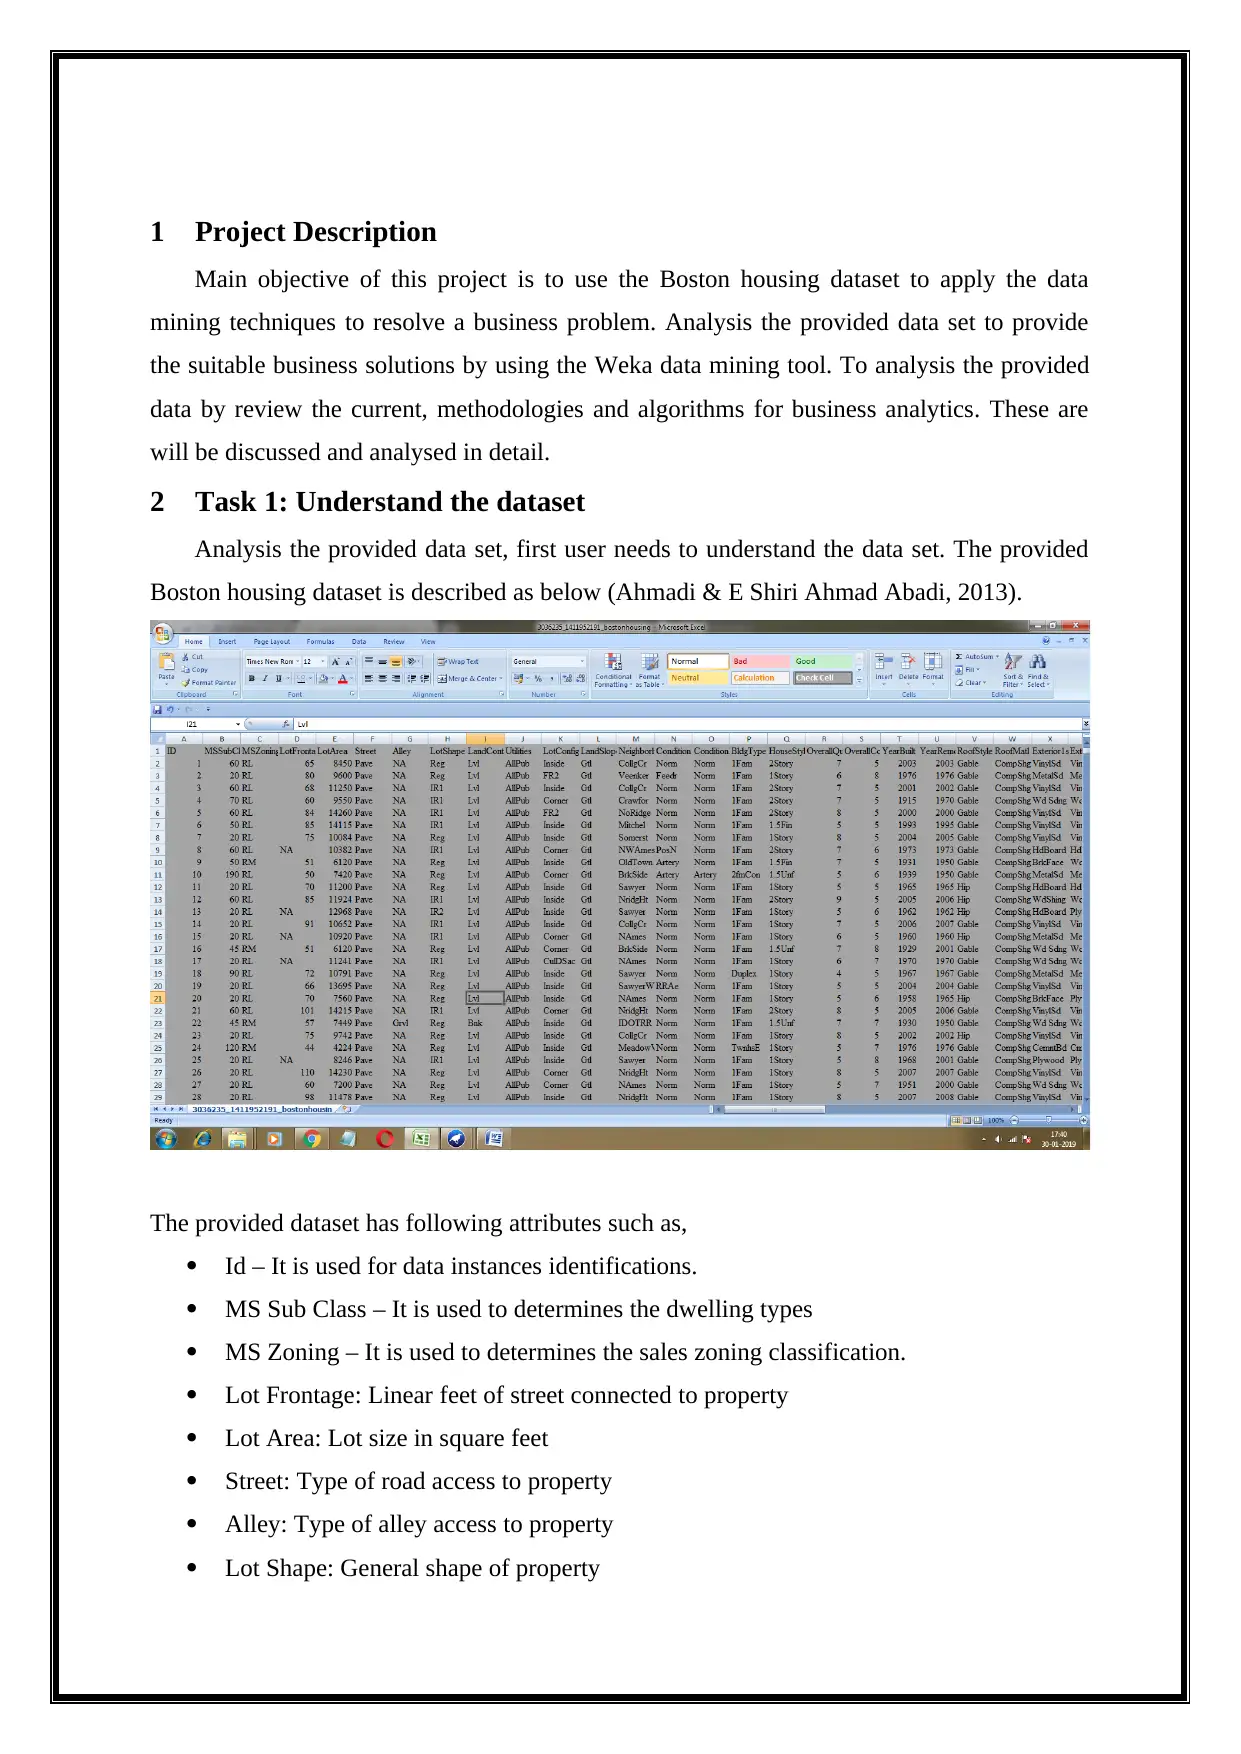
Case Study
AI Summary
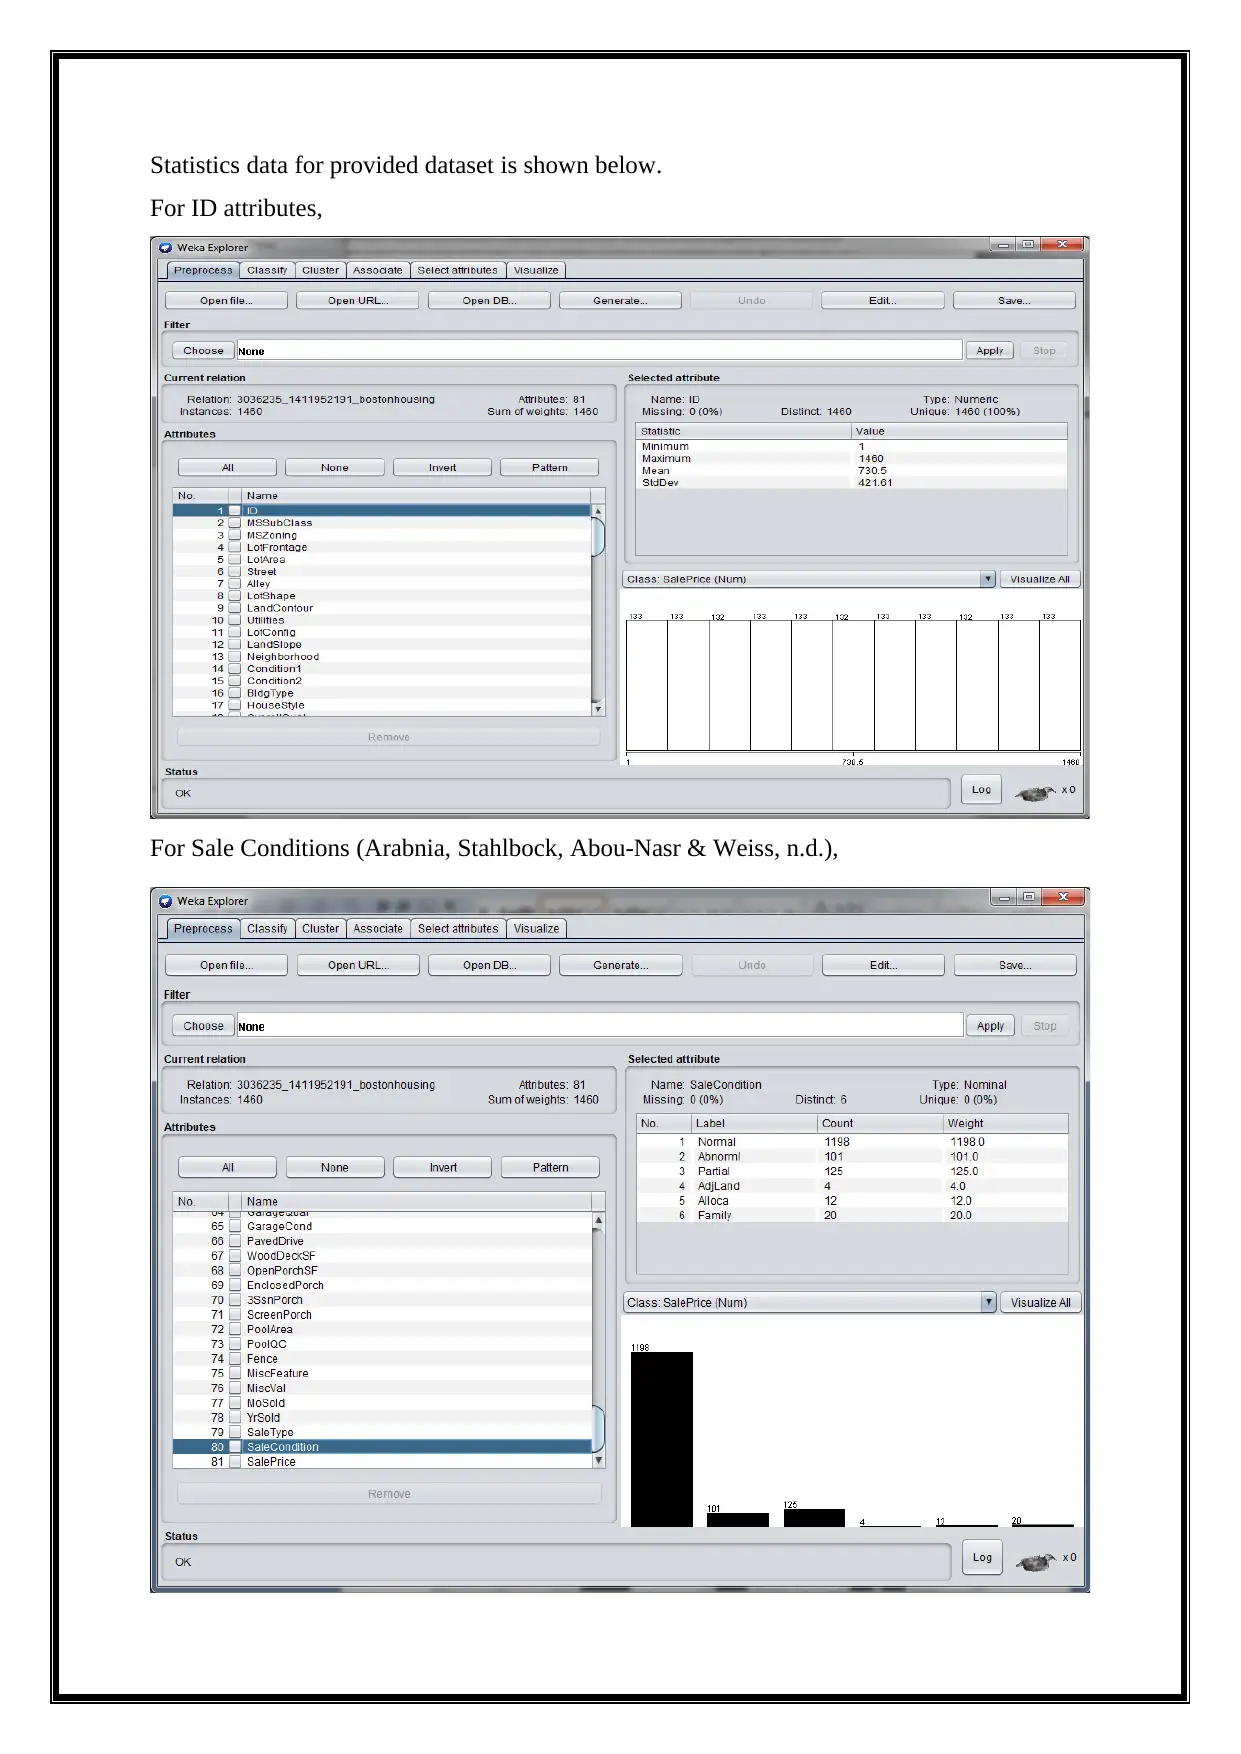
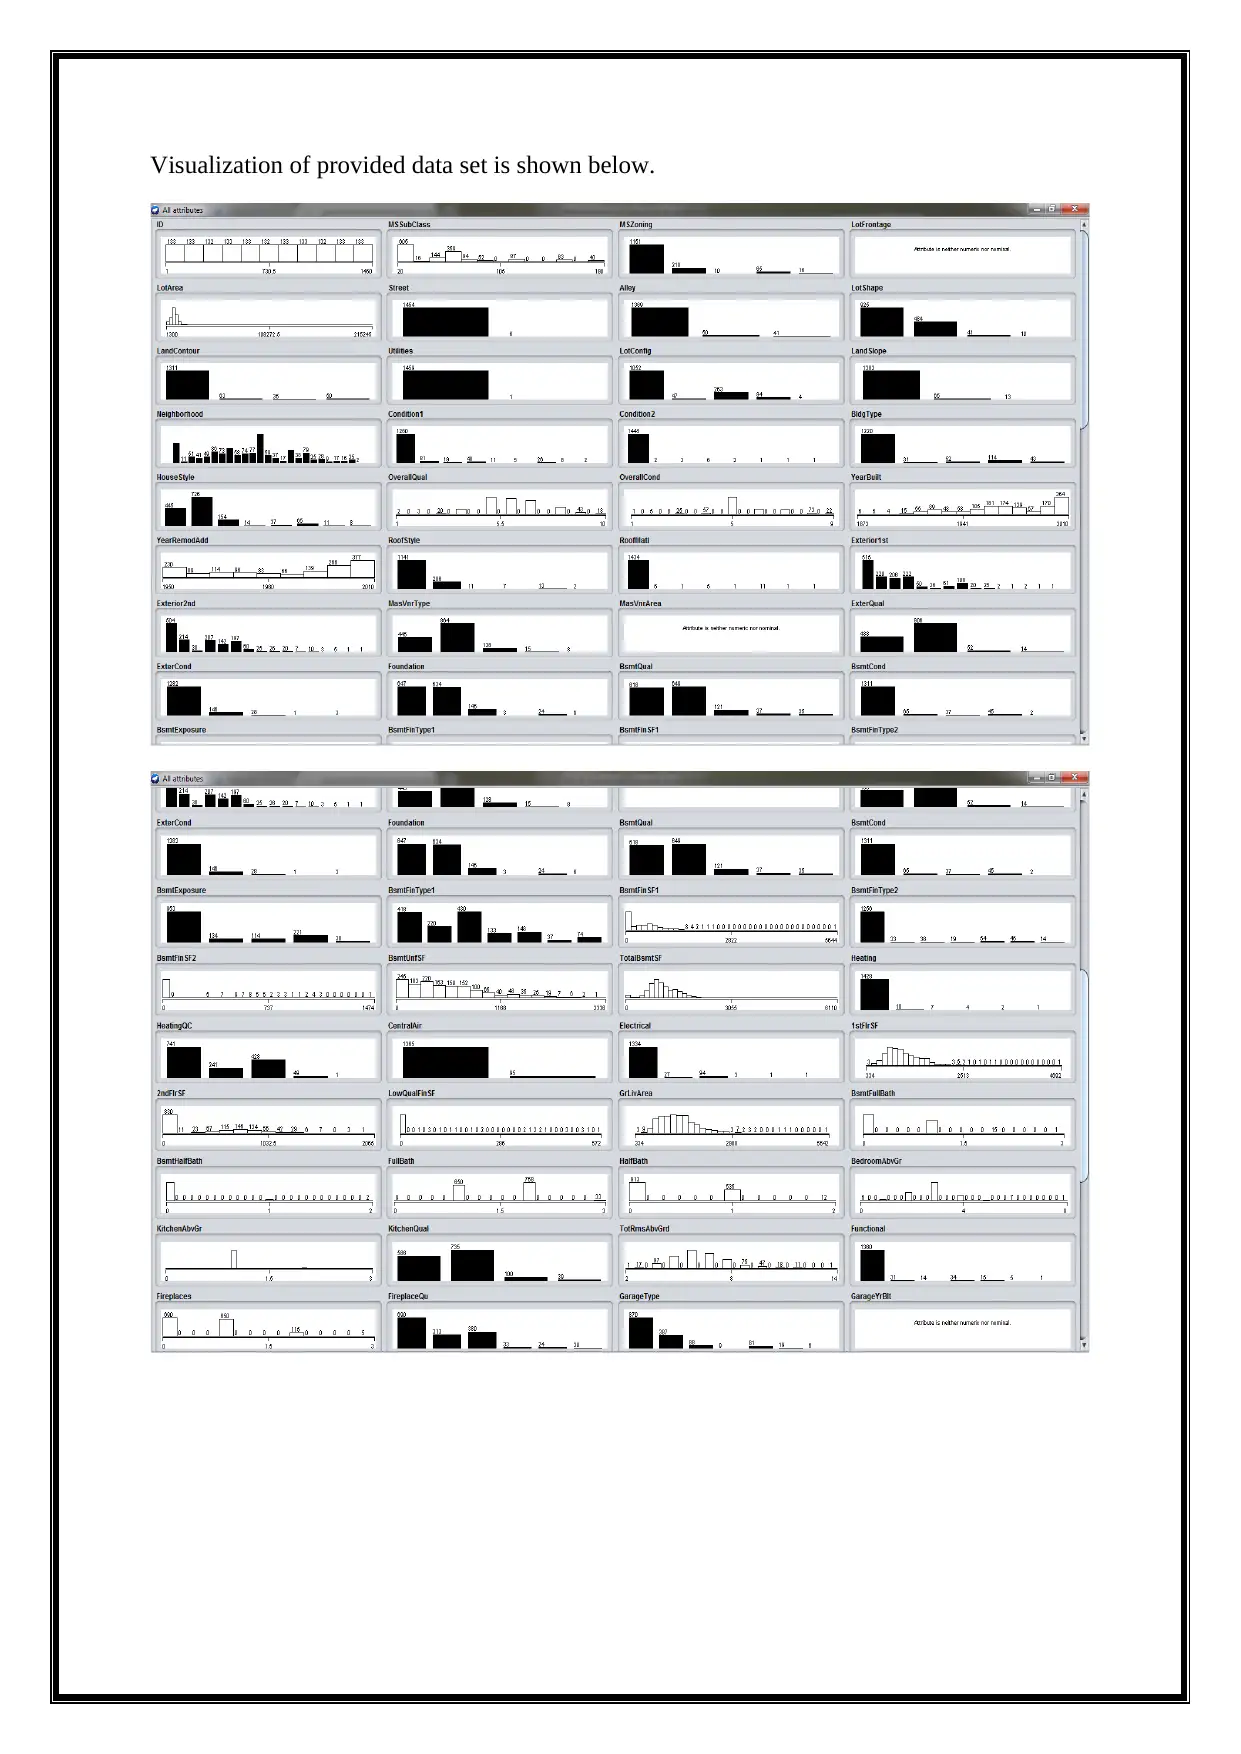
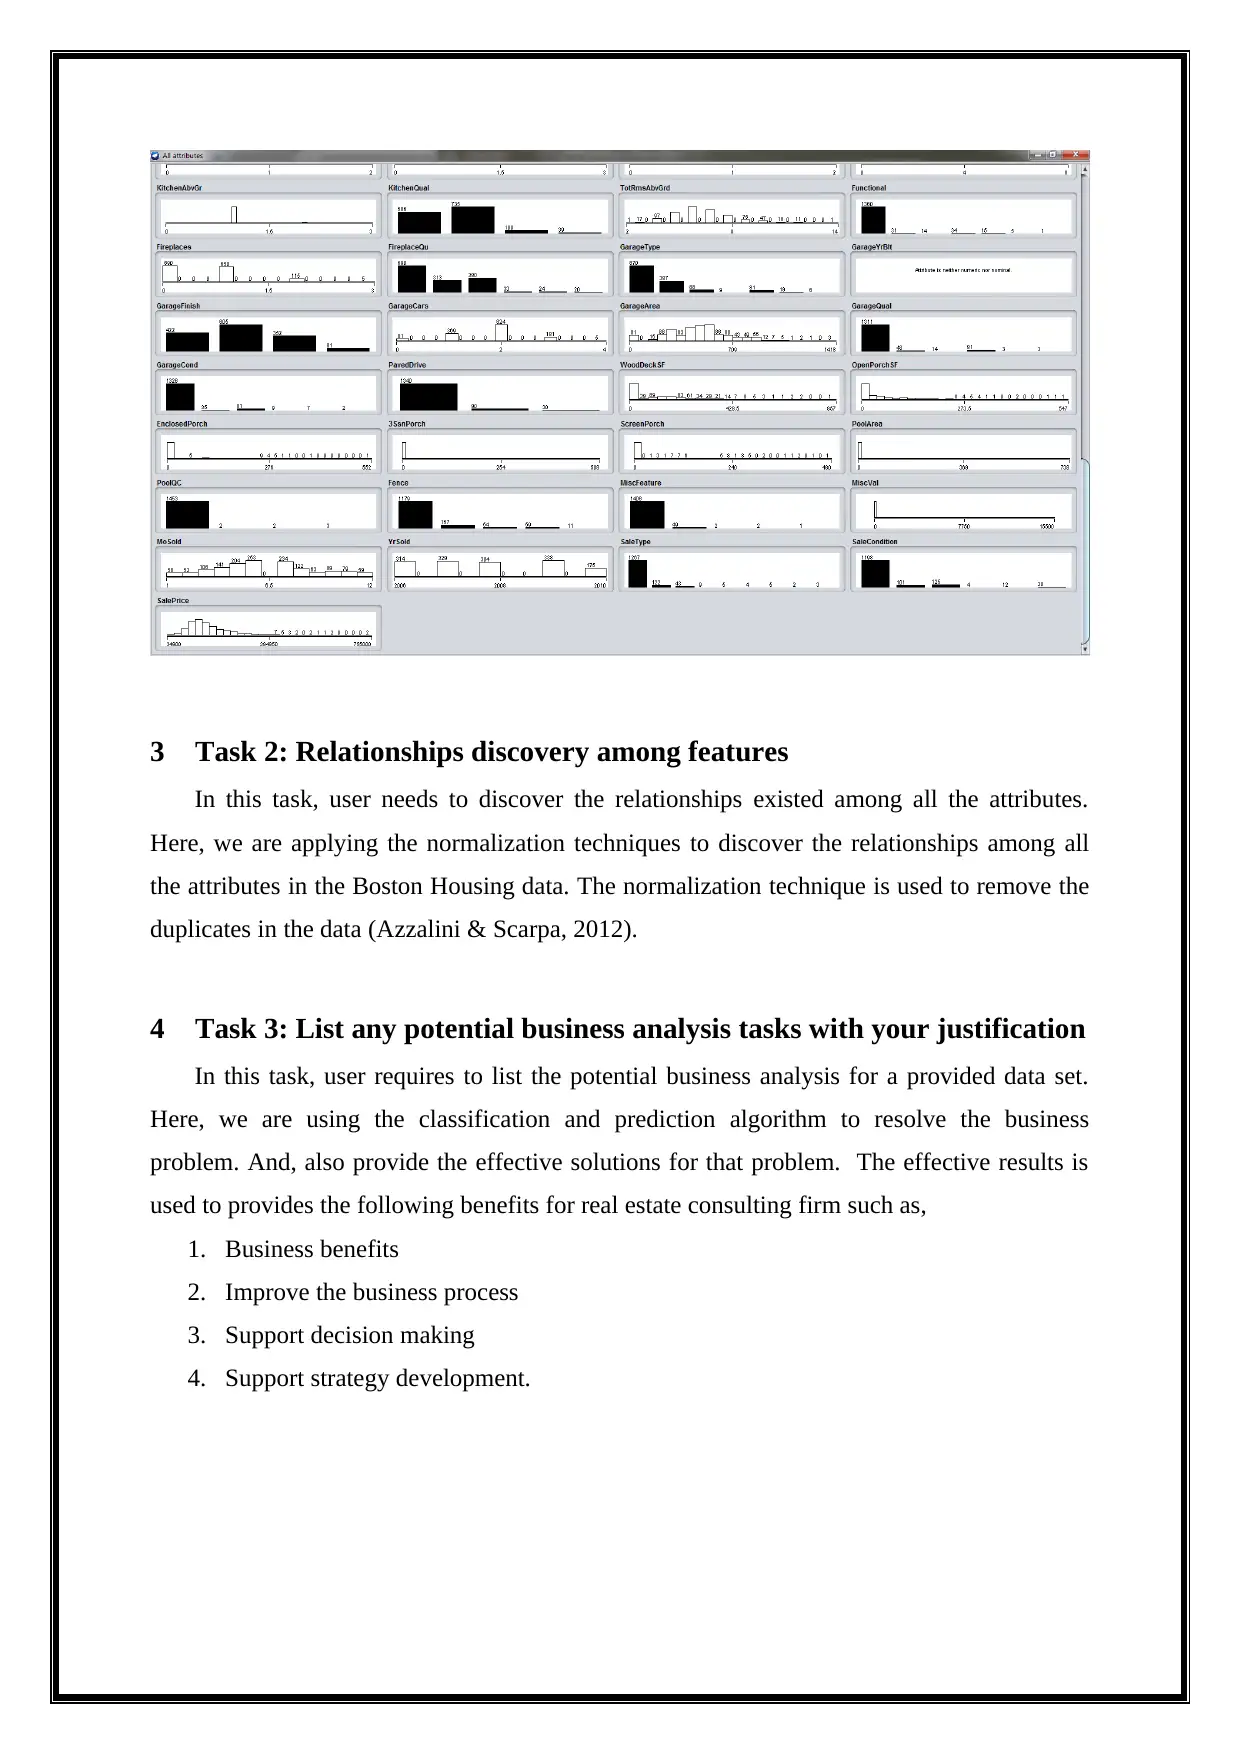
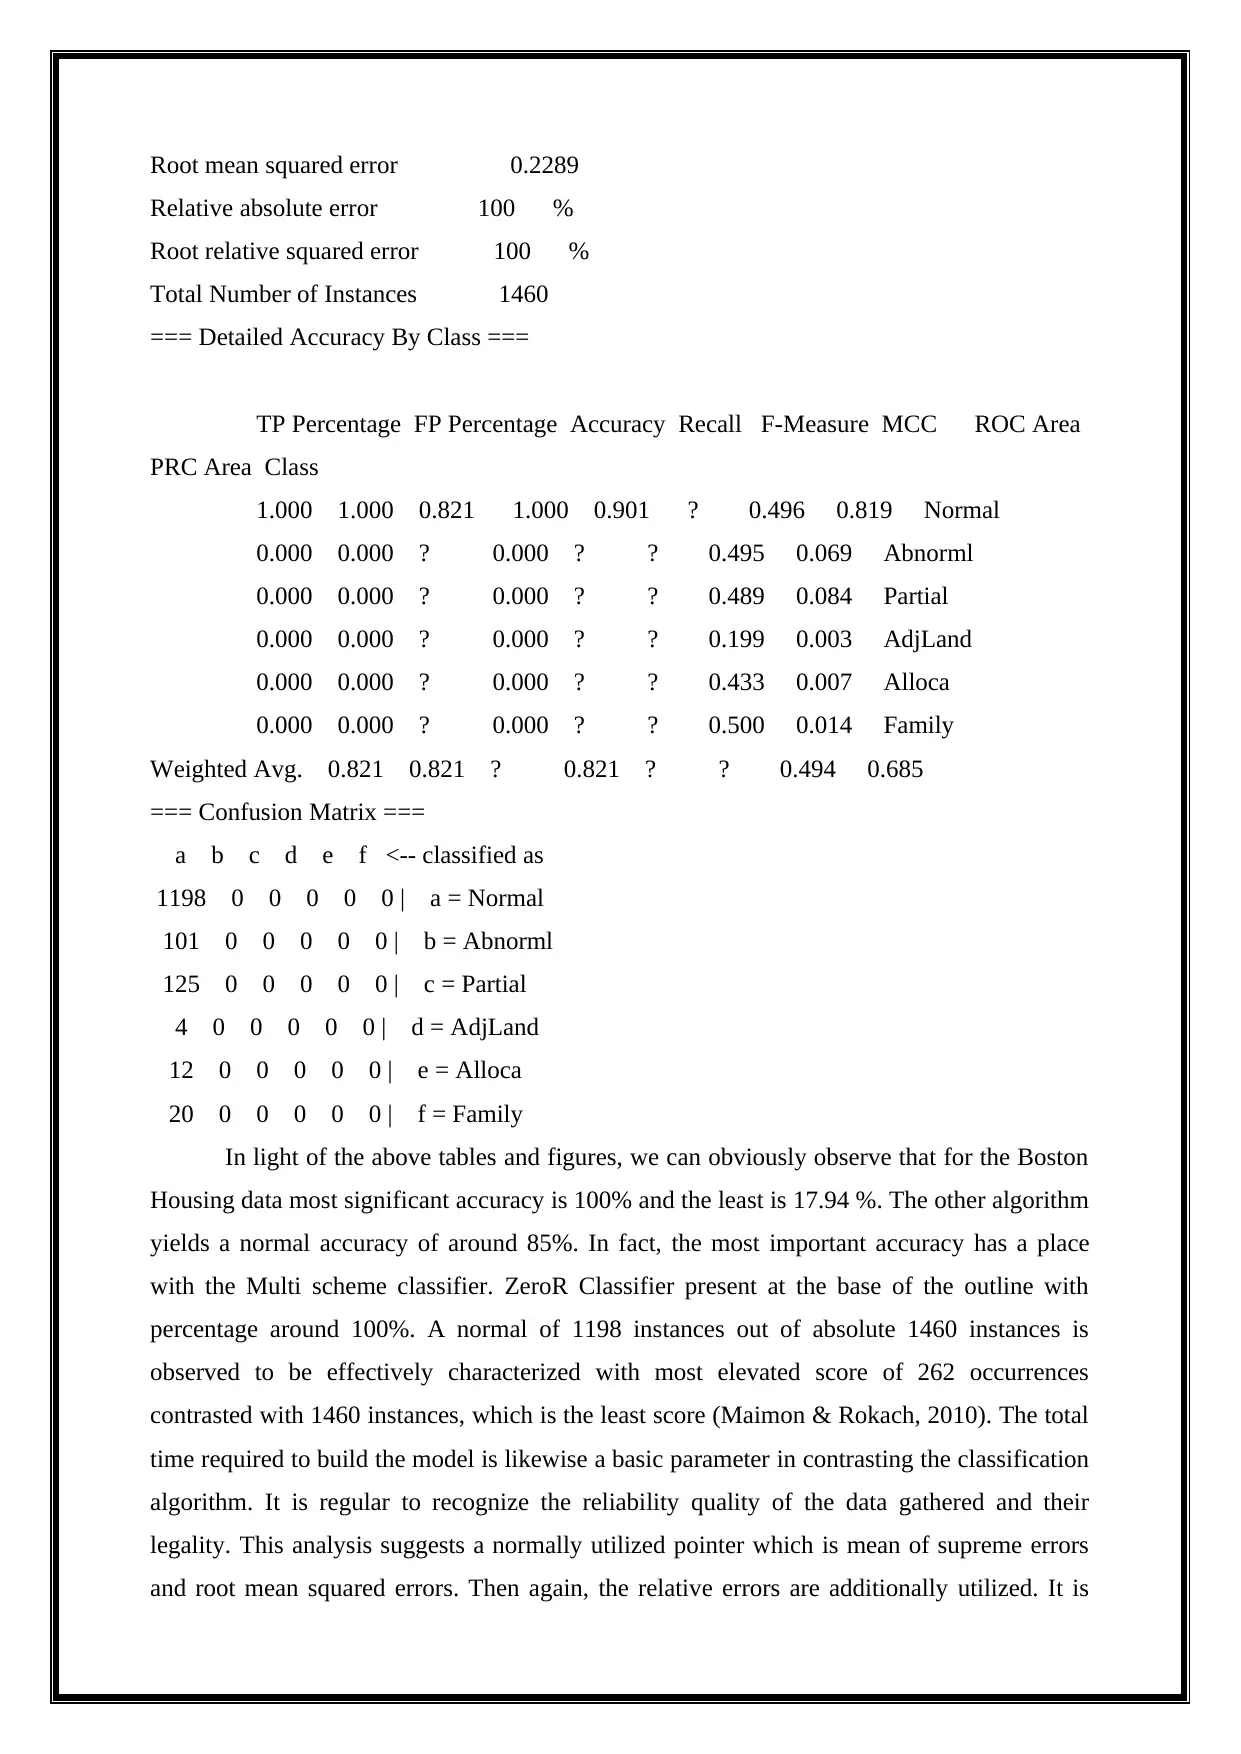
This assignment presents a business analysis case study using the Boston housing dataset and data mining techniques within the Weka tool. It involves understanding the dataset, discovering relationships among features through normalization, and identifying potential business analysis tasks such as ZeroR and Multi scheme classification. The analysis aims to provide business solutions for a real estate consulting firm, focusing on business benefits, process improvement, decision support, and strategy development. The classification algorithms are evaluated based on accuracy, error rates, and model building time, with a conclusion on the suitability of different algorithms for data classification. Desklib provides access to similar solved assignments and resources for students.


1 out of 12
Related Documents


Your All-in-One AI-Powered Toolkit for Academic Success.
+13062052269
info@desklib.com
Available 24*7 on WhatsApp / Email
![[object Object]](/_next/static/media/star-bottom.7253800d.svg)
Copyright © 2020–2026 A2Z Services. All Rights Reserved. Developed and managed by ZUCOL.