Comprehensive Report on Clustering Approaches in Data Mining
VerifiedAdded on 2023/06/12
|19
|10850
|64
Report
AI Summary
This report provides a comprehensive overview of various clustering approaches used in data mining, focusing on their application in managing large datasets and spatial databases. It begins with an introduction to clustering algorithms and their categorization, including K-Means partitioning, hierarchical clustering, and density-based methods like DBSCAN. The report discusses the strengths and weaknesses of each approach, covering aspects such as scalability, handling high-dimensional data, and managing noise. It also delves into specific algorithms like CURE, Birch, and CHAMELEON, as well as grid-based and model-based clustering methods. Furthermore, the report addresses issues related to clustering, methods for evaluating algorithm performance, and the process of cluster validation, including external validation. It concludes by highlighting the advantages of different clustering approaches in enhancing data retrieval efficiency and fault tolerance in database systems. Desklib offers additional resources, including past papers and solved assignments, to aid students in mastering these concepts.
Assignment on Approaches to Clustering
Paraphrase This Document
Need a fresh take? Get an instant paraphrase of this document with our AI Paraphraser
Contents
List of Figure:...........................................................................................................................................................2
Title: Approaches to clustering in Data mining.......................................................................................................3
1. Abstract:..........................................................................................................................................................3
2. Introduction.....................................................................................................................................................3
3. Introduction to Clustering algorithms:............................................................................................................1
4. Categorization of the clustering approaches:..................................................................................................1
4.1 K-Means partitioning algorithm:............................................................................................................1
4.2 Hierarchical Algorithm...........................................................................................................................2
4.3 Binary Divisive Partitioning clustering algorithm:................................................................................3
4.4 Relocation clustering approach..............................................................................................................3
4.5 Probabilistic Clustering..........................................................................................................................4
4.6 CURE Algorithm:...................................................................................................................................4
4.7 Birch Algorithm:.....................................................................................................................................4
4.8 CHAMELEON:......................................................................................................................................5
4.9 Grid based clustering methods:..............................................................................................................5
4.10 Co-Occurrence clustering approach:......................................................................................................6
4.11 Model Based Clustering Methods:.........................................................................................................6
4.12 Density Based Algorithms......................................................................................................................7
4.13 DBSCAN Algorithm:.............................................................................................................................7
4.14 Constraint based clustering Approach:...................................................................................................8
4.15 Machine Learning algorithm:.................................................................................................................8
4.16 Gradient Descent and artificial neural network:.....................................................................................8
4.17 Scalability clustering approach:..............................................................................................................9
4.18 High Dimensional Clustering approach:................................................................................................9
4.19 Subspace clustering algorithm:.............................................................................................................10
4.20 Co-clustering approach:........................................................................................................................10
5. Issues with clustering approaches:................................................................................................................10
6. Evaluation of Algorithm Performance:.........................................................................................................10
7. Process of cluster validation:.........................................................................................................................11
7.1 External validation process:.............................................................................................................12
8. Advantages of Approaches to clustering:......................................................................................................12
9. Conclusion:....................................................................................................................................................12
10. References:................................................................................................................................................13
List of Figure:
Figure 1: Mean value of the clustering algorithm is affected by the occurrence of noise.......................................2
Figure 2: Cluster a and cluster b are merge together to form a agglomerative clusters...........................................3
Figure 3 Implementation of the CURE algorithm....................................................................................................4
Figure 4: Interconnected structure of the grid in the grid based clustering methods...............................................5
Figure 5: Grid based clustering approach................................................................................................................5
Figure 6: Three different databases..........................................................................................................................7
Figure 7: Obstacle between the cluster nodes..........................................................................................................8
Figure 8: Bridge between the Cluster.......................................................................................................................8
Figure 9: External cluster validation process.........................................................................................................12
⊘ This is a preview!⊘
Do you want full access?
Subscribe today to unlock all pages.
Trusted by 1+ million students worldwide
Title: Approaches to clustering in Data mining
(Author Name)
1. Abstract:
Clustering is the term used for grouping the similar
data together in a single unit. The clustering
algorithms are designed for classification and
categorisation of the tasks associated with the
spatial databases. The clustering algorithms are
work on partitioning the data and information into
division so at to group them under a single unit.
There are different patterns developed for
managing the clustering approaches such as
recognition of the pattern, development of data
domain for measuring the proximity, clustering
data domain, development of data abstraction layer
and assessment of the expected output. Clustering
procedures are used for handling the noise
associated with the clusters located in the spatial
database for managing large data set. It helps in
increasing the efficiency for fetching the data from
the database. The fault tolerance capabilities of the
database can be effectively improved by using the
new clustering algorithm. The kernel density is
used for calculating the distance between the two
data clusters in the recursion procedures. The
projected clustering measures the space between
the subsets. The normalization matrix is prepared
for finding the distance between the subspaces of
the clusters. The variation in the clustering
algorithm approaches helps in improving the
performance of the noise handling program
associated with the cluster approaches. In this
paper, we will focus on the various clustering
algorithms which are used to explore the data
mining techniques for the efficient working of the
database management system.
2. Introduction
The data mining is the important step for the
development of knowledge discovery databases for
the effective management of the large data and
information which is creating problematic
scenarios for the applications. The applications are
not able to handle large data generated from the
satellite, intelligent systems, and etc. The research
had been conducted from the last few years for the
development of the effective algorithms for the
management of big and large data sets. Clustering
is the term used for grouping the similar data
together in a single unit. The clustering algorithms
are designed for classification and categorisation of
the tasks associated with the spatial databases
(Department for business, energy and industrial
strategy, 2017). The explosion in the technological
advancement focuses on the use of spatial
databases which are designed for handling big data
of the enterprise. The spatial database systems are
designed for handling the large data of the
applications. The clustering algorithm plays an
important role in handling large data in the spatial
databases. This algorithm is depends on three
parameters which are named as knowledge of
domain, cluster management, and capability of the
spatial databases.
The knowledge should focus on determining the
facts related to the input parameters which are used
for storing the big data in the spatial databases.
There are different arbitrary shapes which can be
taken for the construction of the spatial databases
like linear, oval, circle, elongated, others. The
millions of objects can be stored in the large
database which helps in increasing the efficiency of
the applications. The purpose of this paper is to
focus on the approaches to clustering which is used
for managing the big data in the spatial databases.
The limitation of handing big data can be
effectively improved by using the clustering
algorithm. The fault tolerance capabilities of the
database can be effectively improved by using the
new clustering algorithm. It deals with the
management of information on the distributed and
Hadoop file system. In the traditional working of
the database, as the amount of data and information
on the application get increased than it processing
speed is slower down to resolve this problem
application of clustering approach is the authentic
mechanism for handling big data in the spatial
database. The simplification of the process can be
helps in defining small clusters or groups for
managing the data representation. The lossy data
compression technique is most frequently used
technique for clustering of the data. The data
mining tools are capable of initializing required
computation for managing the small clusters of
information. The cluster is the amalgamation of
objects, cases, instances, tuples, and pattern
transaction. The clustering is responsible for
developing K-subsets for the finite system. The
segmentation of clustering helps in emphasising K-
subsets of clusters for developing the automation in
the data mining procedures. The organization and
categorisation of the data compression technique
can be effectively done by applying the clustering
approaches. The functionality of the input vector
can be improved by developing metrics for the
different clusters developed for calculating the
distance function between the two data points taken
in an instance.
Paraphrase This Document
Need a fresh take? Get an instant paraphrase of this document with our AI Paraphraser
3. Introduction to Clustering algorithms:
The clustering algorithms are designed for
systematic arrangement of data in the database
which increases the efficiency of fetching the data
from the data storage unit. There are different
patterns developed for managing the clustering
approaches such as recognition of the pattern,
development of data domain for measuring the
proximity, clustering data domain, development of
data abstraction layer and assessment of the
expected output (Jayanthi, and Priya, 2018). The
aim of the clustering approach is to set criteria for
the partitioning of the object. The iteration process
should be developed for analysing the user quality
of different parameters. The verification and
validation process is used for analysing the
visualization and knowledge of domain for the
database. The criteria should be developed for
solving the complexity of cluster problems (Kumar,
Bezdek, Palaniswami, and Havens, 2015). The
clustering algorithms are work on partitioning the
data and information into division so at to group
them under a single unit.
4. Categorization of the clustering
approaches:
The clustering algorithms are divided into
categories on the basis of properties of data mining
which they can handle efficiently. The properties of
clustering algorithms which are taken under
consideration are properties of attributes which can
be handled by the clustering algorithm, scalability
associated with the big data, high dimensional data
flow, managing shape of the cluster according to
the requirement of the data set, outliers handling
capability, managing complexities associated with
time and space, dependency of the data set, fuzzy
logic creation, defining parameters of the data sets,
and interoperability of the data nodes. There are
different procedures and algorithms are developed
for initializing the clustering of the data set so that
the retrieval of the information can be effectively
done by simple procedures of data mining
technique. The following is the list of clustering
algorithm:
Hierarchical Clustering algorithm: The
hierarchical clustering algorithm are
subdivided into two types which are
named as Aggglomerative Algorithm and
Divisive Algorithm.
Partitioning methods: The partitioning
methods are divided into Relocation
clustering approaches, probabilistic
clustering, K-medoids method, K-means
clustering approach, and Density based
algorithm. The density based algorithm is
again sub-divided into Density based
connectivity clustering and Density
functions clustering
Grid Based clustering methods
Co-occurrence clustering approach
Constraint based clustering algorithm
Machine learning clustering algorithm;
The machine learning clustering algorithm
are subdivided into Gradient descent and
development of artificial neural network
and evolutionary method
Scalable clustering approaches
High Dimension clustering algorithm: The high
dimension clustering algorithm are sub-divided into
sub-space clustering algorithm, projection
clustering technique, and co-clustering technique.
Some of the algorithms are describe below:
4.1 K-Means partitioning algorithm:
The K-Medoids method is used for defining the
data nodes of the cluster. The cluster points are
collected for managing the resistance between the
medoids and the peripheral units. The subsets of
the objective functions are used for calculating the
distance between the data node and its median. The
K-medoids algorithms is subdivided into two types
such as partitioning around medoids and clustering
large application ( CLARA). The iterative
procedures are used for optimizing the point
relocation. The CLARANS procedures are used for
arranging the data into spatial databases. The
potential medoids can be effectively drawn with the
help of objective function. The O(N2) is the data
complexity which is used for continuing the
objective operation in the whole data tree.
The K-means algorithm is used for managing the
clustering tool in the business application. The
Centroid helps in obtaining values of K clusters.
The variance of intra –cluster is used for
calculating the sum of errors. The pair wise errors
can be calculated with the help of following
formula:
The spherical K-means algorithm is the procedure
is used for estimating the centroids for collecting
documentation. The K-mean algorithm is used for
suspecting the following:
The Centroids is used for calculating the
dependency between the two data sets.
The optimization between the local value
and the global value can be effectively
calculated
Calculation of K-value data set
Sensitivity of the outliers
Scalability of the algorithm
The numerical attributes can be effectively
calculated
Unbalancing of the resulting clusters
The weights to the cluster can be associated with
the procedures following the harmonic means. The
scalability and the extension procedures are used
for pre-processing the Squash data. K-prototypes
are used for managing the modification in the data
set for balancing the data tree.
The K-Means problems associated with the
applications are effectively resolved by applying
the procedures off the K-Means partitioning
algorithm. The procedure is based on finding the
minimal feasible solution for the iterative data. The
scalar data is used for analysing the centroid of the
cluster. For example, given the data set of k values
in the set of integers for managing it with the help
of finding the centroid of the application. The
objective function should be constructed for finding
the minimal optimised and feasible solution for the
given set of values. The Voronoi diagram is
developed for partitioning the database system. The
voronoi cells are responsible for containing the
cluster of information. The shape of the cluster is
identified according to the centroid value. The
clustering large applications based on Randomized
search (CLARANS) is used for handling the K-
Means procedures for increasing the efficiency and
effectiveness of the spatial database. This algorithm
helps in managing the cluster of information on the
spatial databases with the finding of the centroid
data node to increase the efficiency of the data
fetching. The objective function of the K-means
algorithm is
A scalable framework can be developed for the
clustering processes so as to manage the data on the
large database. The size of the memory buffer can
be increased or decreased according to the
requirement of data available. O(n) is the
computation complexity of the K-means clustering
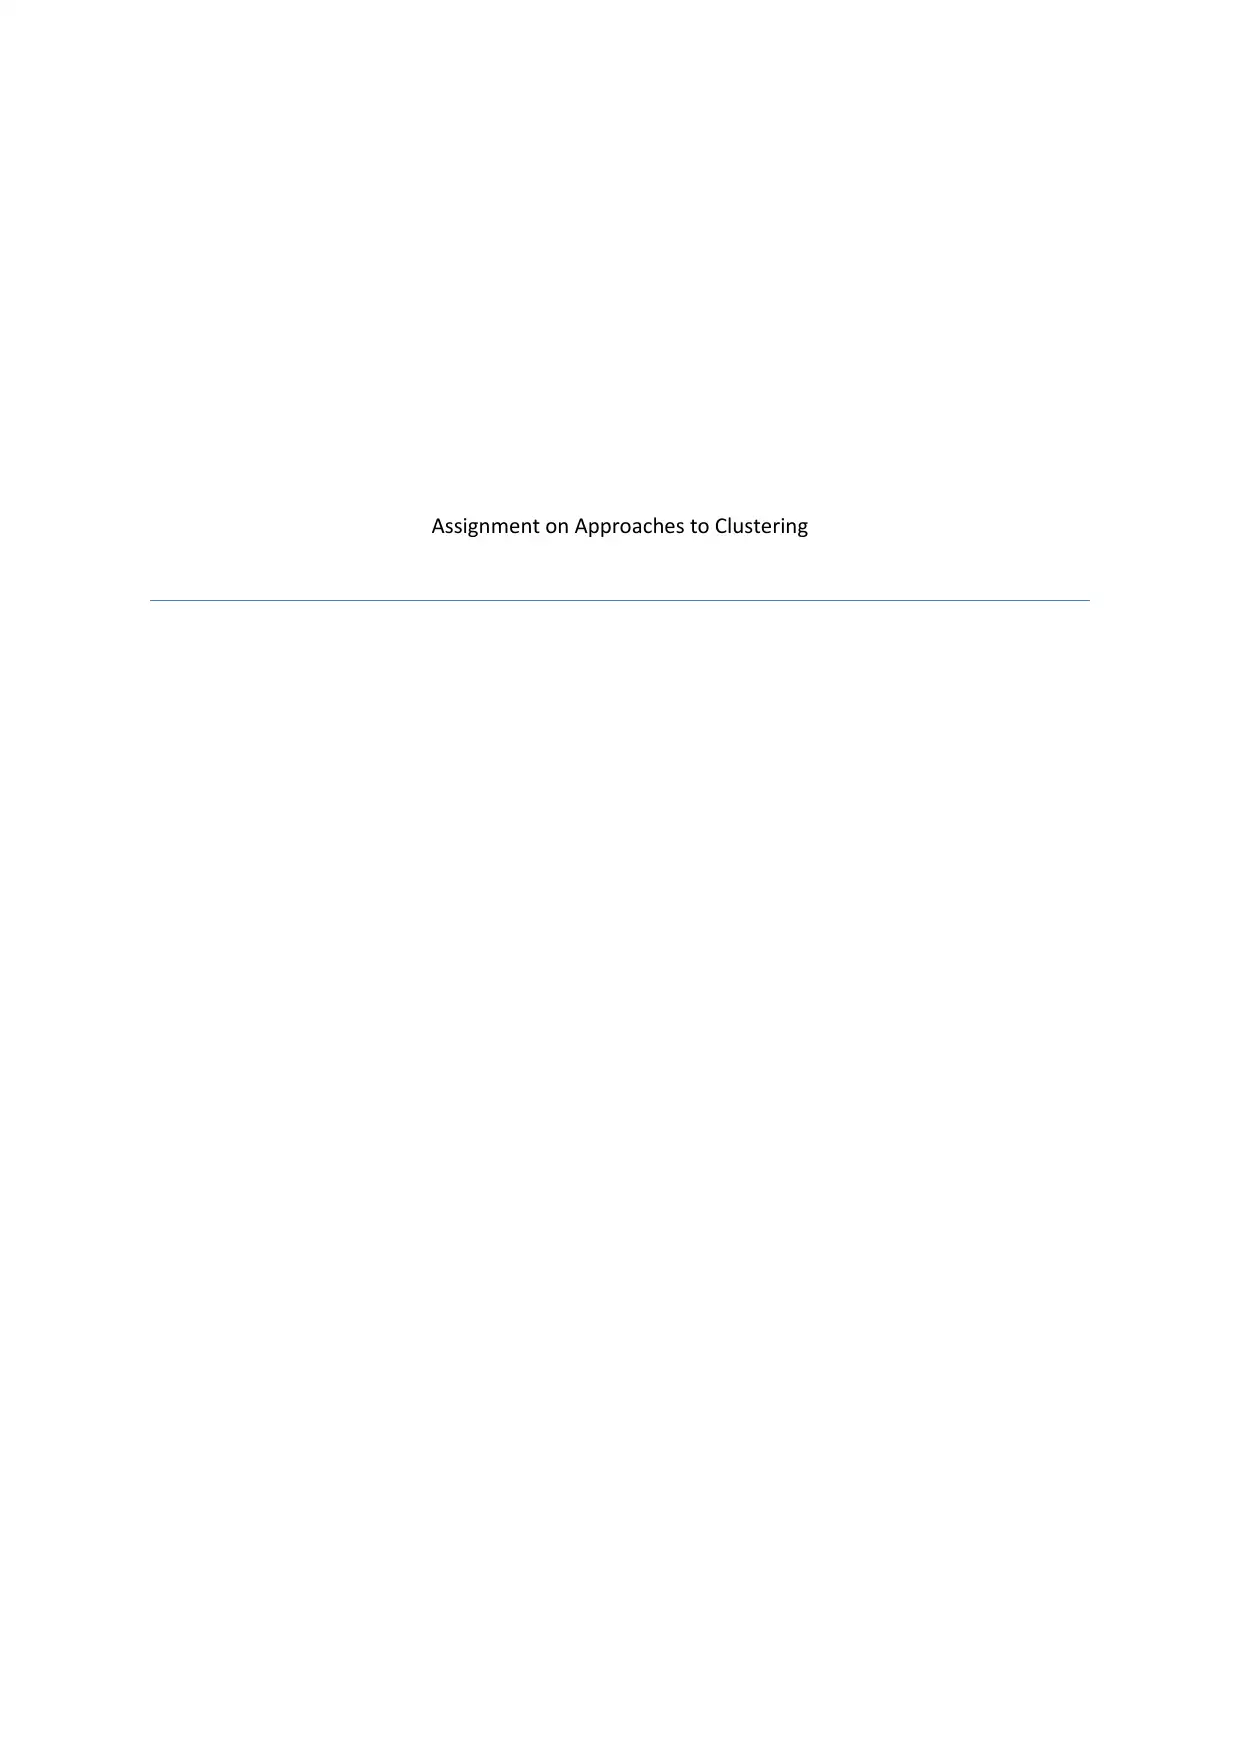
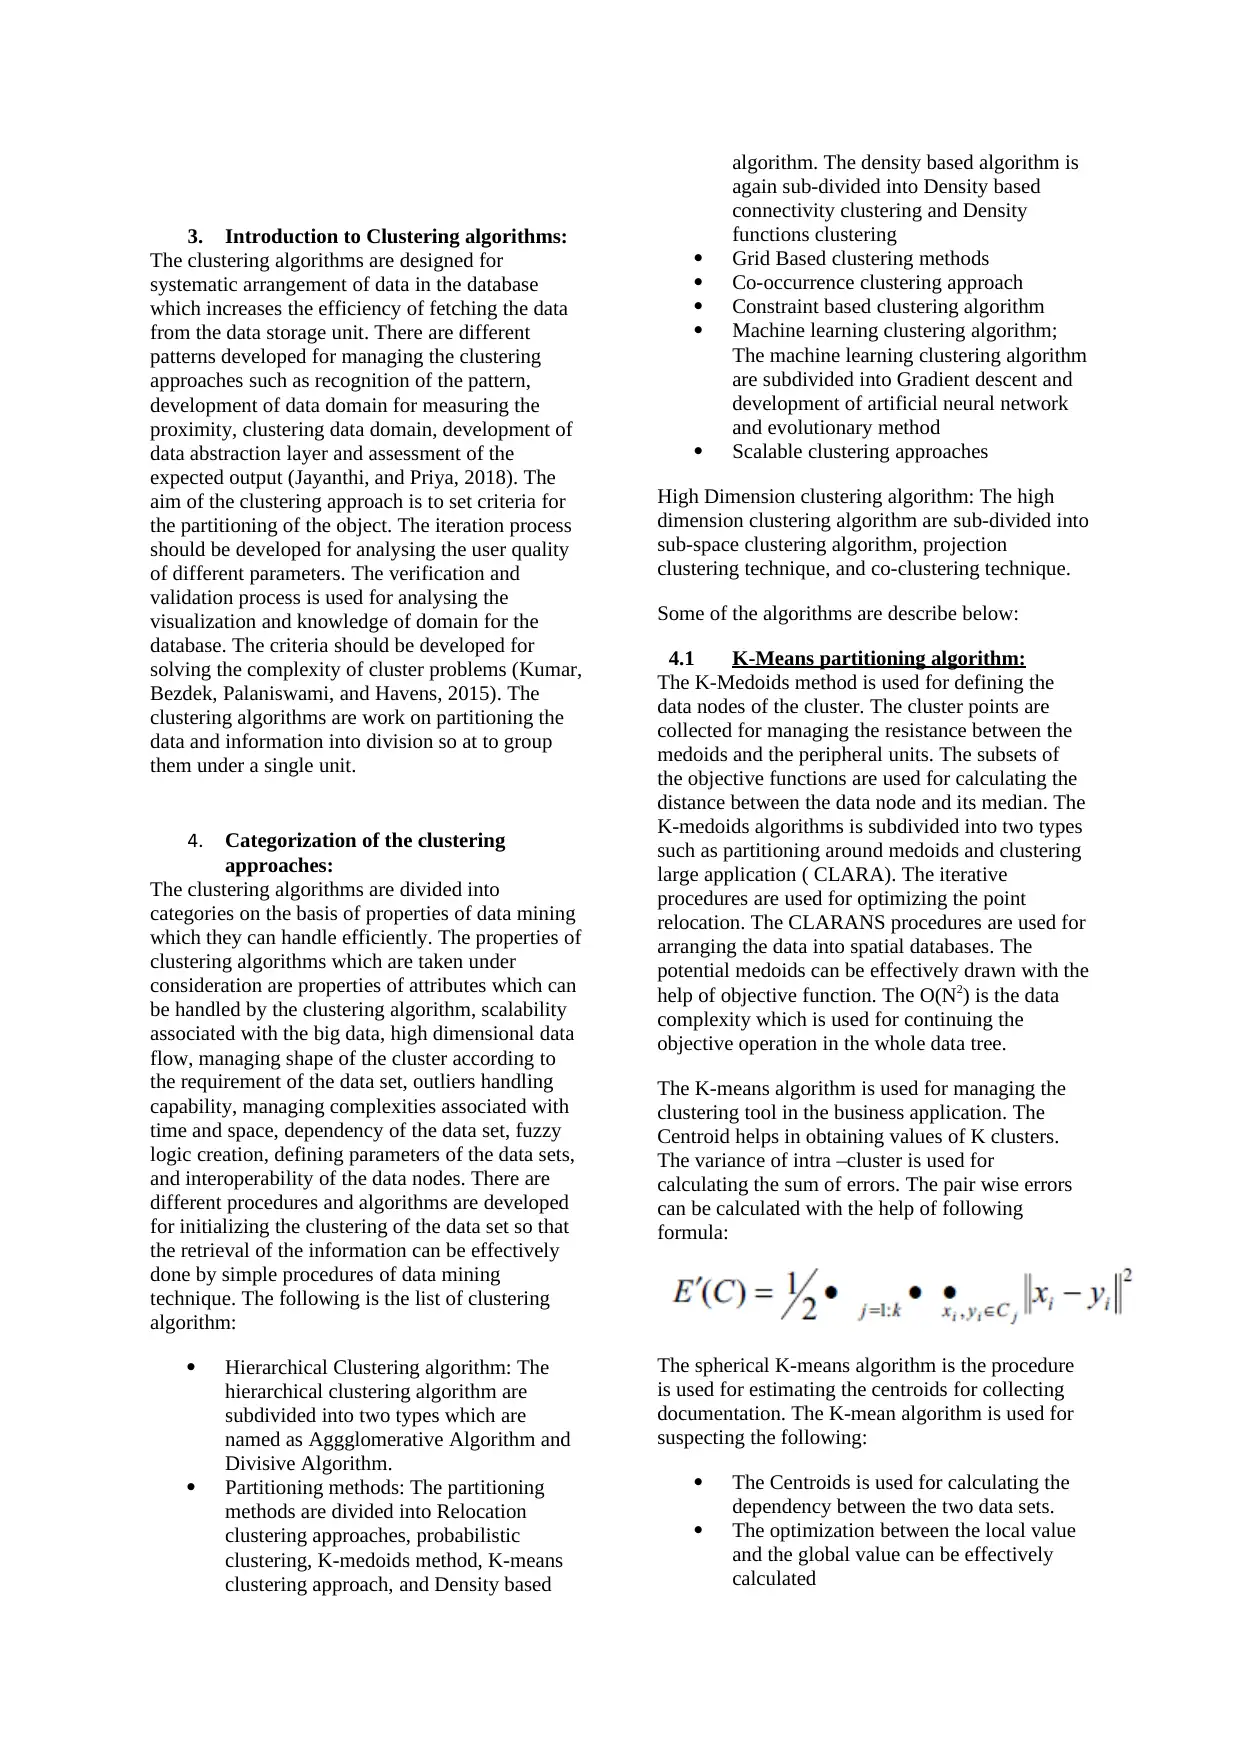
algorithm. The mean value of the clustering
algorithm is affected by the occurrence of noise
which can be demonstrated from the graph below:
Figure 1: Mean value of the clustering algorithm
is affected by the occurrence of noise
4.2 Hierarchical Algorithm
The tree structure and the dendogram are used for
representing the hierarchical clustering algorithm.
The agglomerative approach can be followed in the
construction of the Denodgram which are splits
into leaves from the root (Mythili, and Madhiya,
2014). The termination of the process takes place at
critical distance which is managed between the
clusters. This is called as minimal condition. The
measuring of the distance between the clusters can
be done through the following hierarchical process:
Hierarchical
process
Description
Clustering
through the
average linkage
process
The calculation of the average
values can be effectively done
though the dissimilarity
between the clusters.
Clustering
through the
process of
centroid linkage
The average of the variation in
the centroid can be effectively
done. The cloud points are
collected in the cluster.
Completion of
the linkage
clustering
The maximum number of the
clusters can be calculated
Clustering of the
single linkage
The nearest neighbour cluster
is created
Ward’s Method This method is used for
calculating the sum of the
deviation to resolve the
complexity of fusion
The tree structure should be developed for
managing the hierarchy of the clusters which are
developed from the data nodes. The hierarchical
structure of the clusters is also known as
Dendogram. The clusters are associated with the
sibling clusters by having their common root node
or parents. The granularity of the data can be
effectively manageable. The hierarchical clustering
algorithms are subdivided into two types which are
named as Agglomerative Algorithm and Divisive
Algorithm. The Agglomerative algorithm is based
on initial data point which merges with the
recursive cluster of data nodes. The divisive
Sensitivity of the outliers
Scalability of the algorithm
The numerical attributes can be effectively
calculated
Unbalancing of the resulting clusters
The weights to the cluster can be associated with
the procedures following the harmonic means. The
scalability and the extension procedures are used
for pre-processing the Squash data. K-prototypes
are used for managing the modification in the data
set for balancing the data tree.
The K-Means problems associated with the
applications are effectively resolved by applying
the procedures off the K-Means partitioning
algorithm. The procedure is based on finding the
minimal feasible solution for the iterative data. The
scalar data is used for analysing the centroid of the
cluster. For example, given the data set of k values
in the set of integers for managing it with the help
of finding the centroid of the application. The
objective function should be constructed for finding
the minimal optimised and feasible solution for the
given set of values. The Voronoi diagram is
developed for partitioning the database system. The
voronoi cells are responsible for containing the
cluster of information. The shape of the cluster is
identified according to the centroid value. The
clustering large applications based on Randomized
search (CLARANS) is used for handling the K-
Means procedures for increasing the efficiency and
effectiveness of the spatial database. This algorithm
helps in managing the cluster of information on the
spatial databases with the finding of the centroid
data node to increase the efficiency of the data
fetching. The objective function of the K-means
algorithm is
A scalable framework can be developed for the
clustering processes so as to manage the data on the
large database. The size of the memory buffer can
be increased or decreased according to the
requirement of data available. O(n) is the
computation complexity of the K-means clustering
algorithm. The mean value of the clustering
algorithm is affected by the occurrence of noise
which can be demonstrated from the graph below:
Figure 1: Mean value of the clustering algorithm
is affected by the occurrence of noise
4.2 Hierarchical Algorithm
The tree structure and the dendogram are used for
representing the hierarchical clustering algorithm.
The agglomerative approach can be followed in the
construction of the Denodgram which are splits
into leaves from the root (Mythili, and Madhiya,
2014). The termination of the process takes place at
critical distance which is managed between the
clusters. This is called as minimal condition. The
measuring of the distance between the clusters can
be done through the following hierarchical process:
Hierarchical
process
Description
Clustering
through the
average linkage
process
The calculation of the average
values can be effectively done
though the dissimilarity
between the clusters.
Clustering
through the
process of
centroid linkage
The average of the variation in
the centroid can be effectively
done. The cloud points are
collected in the cluster.
Completion of
the linkage
clustering
The maximum number of the
clusters can be calculated
Clustering of the
single linkage
The nearest neighbour cluster
is created
Ward’s Method This method is used for
calculating the sum of the
deviation to resolve the
complexity of fusion
The tree structure should be developed for
managing the hierarchy of the clusters which are
developed from the data nodes. The hierarchical
structure of the clusters is also known as
Dendogram. The clusters are associated with the
sibling clusters by having their common root node
or parents. The granularity of the data can be
effectively manageable. The hierarchical clustering
algorithms are subdivided into two types which are
named as Agglomerative Algorithm and Divisive
Algorithm. The Agglomerative algorithm is based
on initial data point which merges with the
recursive cluster of data nodes. The divisive
⊘ This is a preview!⊘
Do you want full access?
Subscribe today to unlock all pages.
Trusted by 1+ million students worldwide
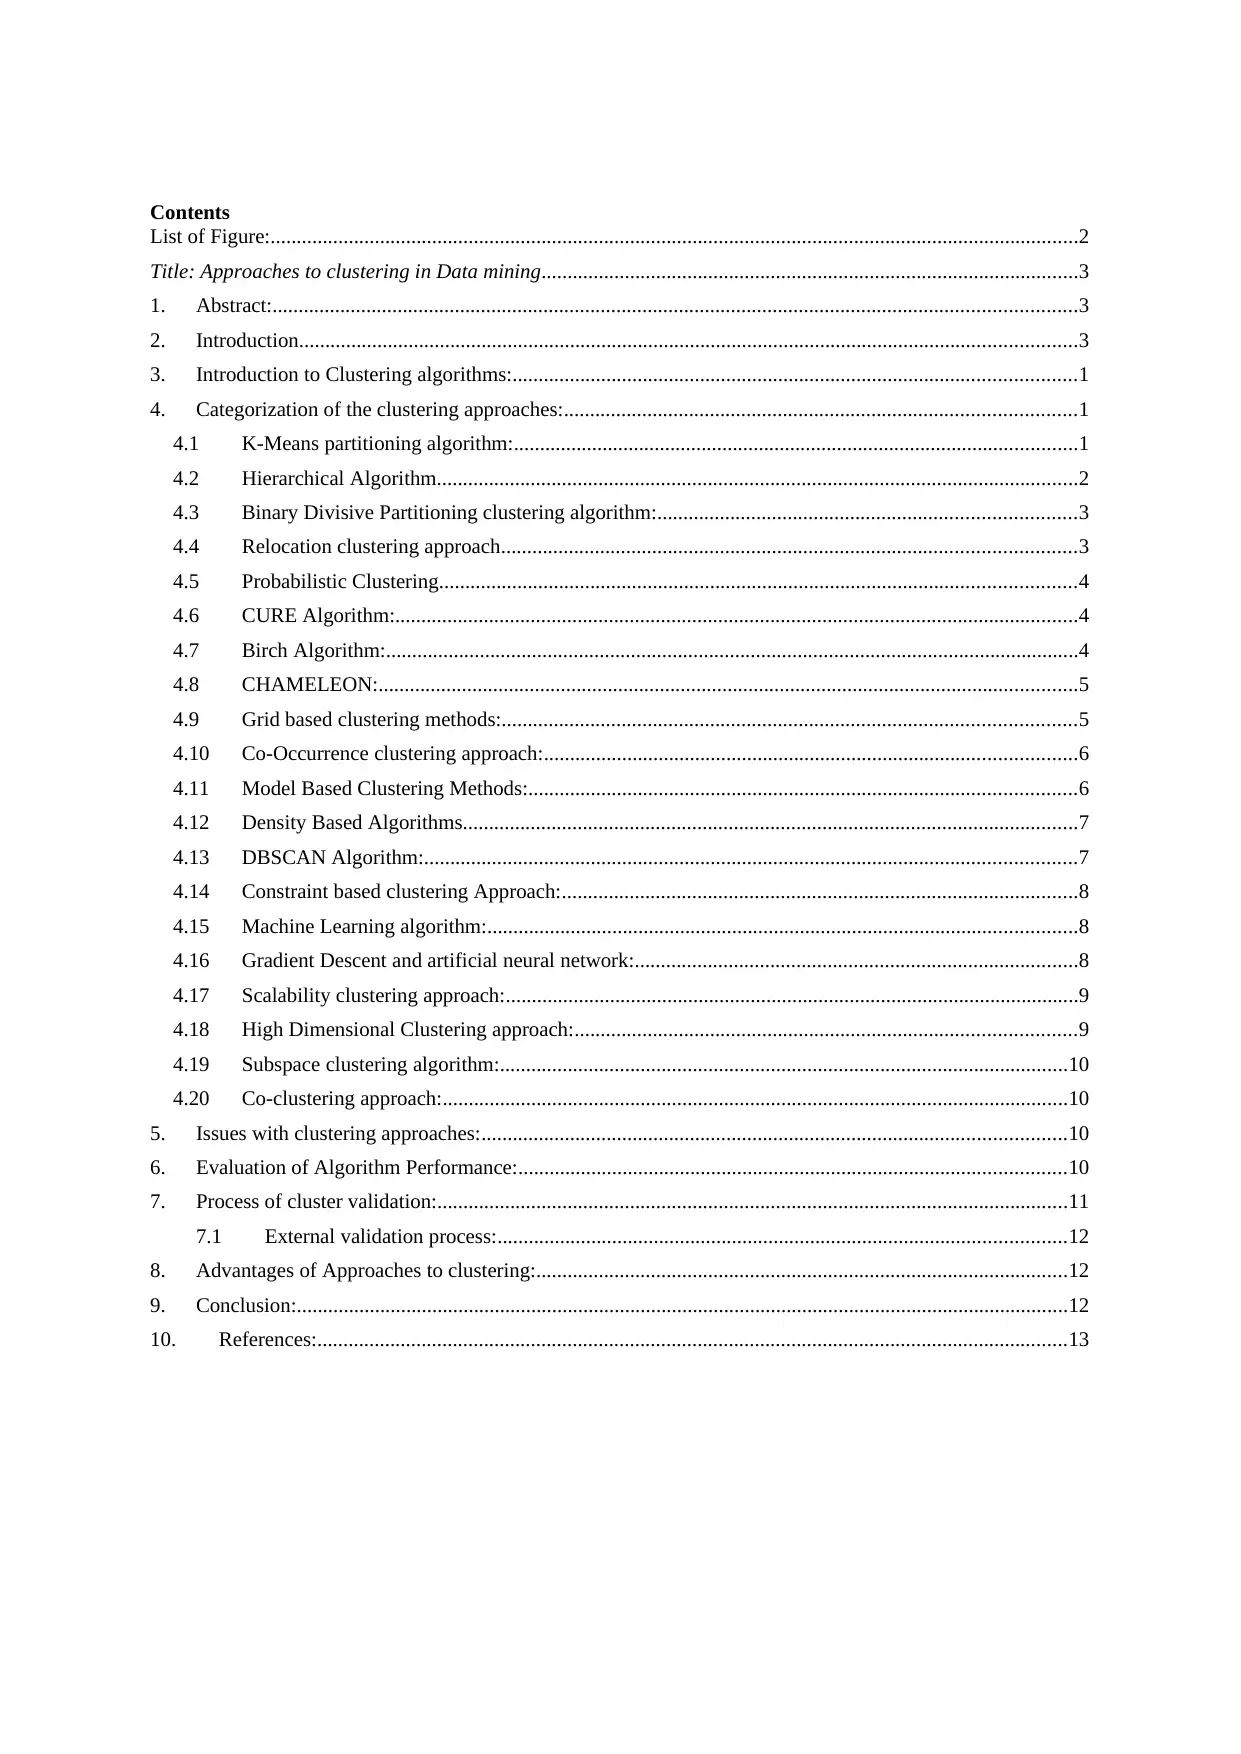
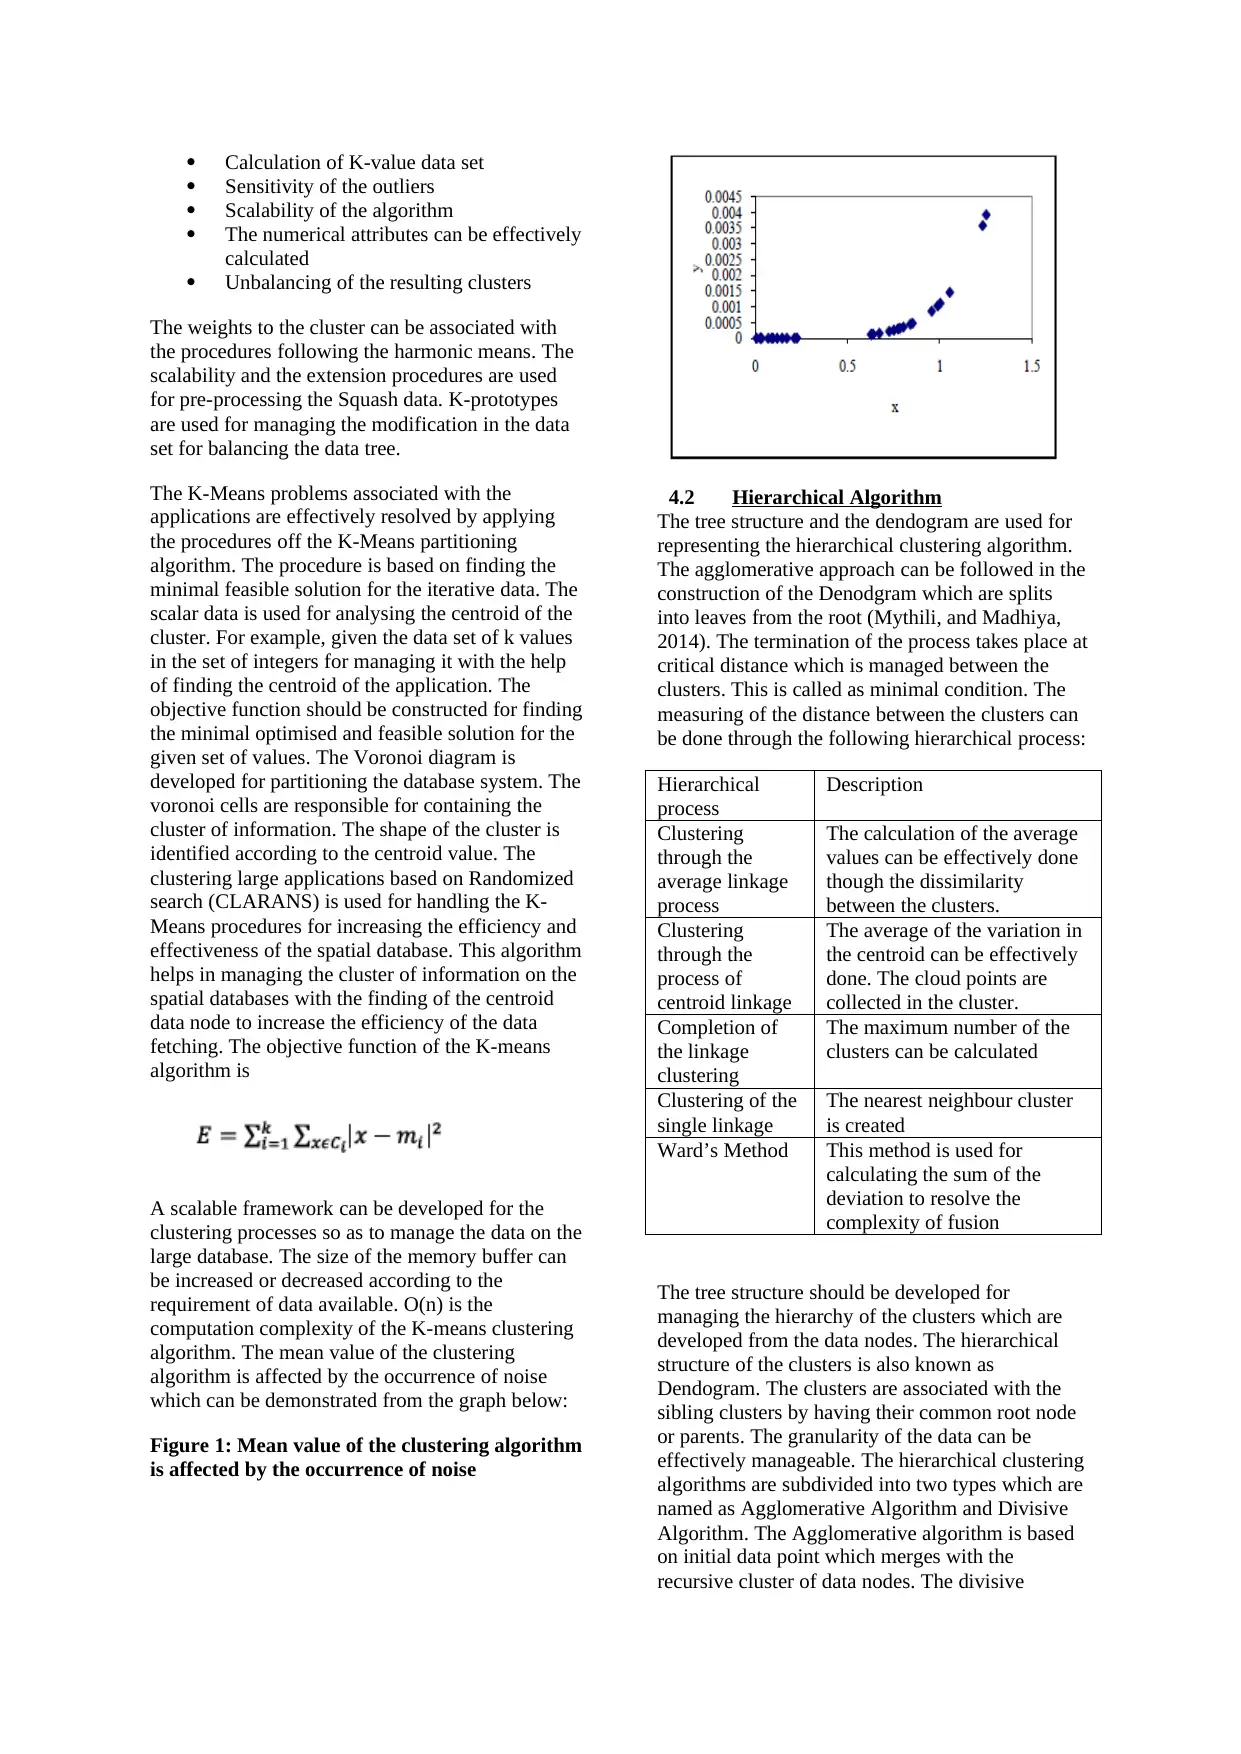
algorithm is based on divide and conquer rule and
it starts with the data nodes and divides into
subsequent data nodes. The process of division of
data nodes continues until K numbers of data nodes
are retrieved. The following figure shows the
arbitrary cluster shape of Agglomerative
hierarchical approach. In this figure cluster a and
cluster b are merge together to form a
agglomerative clusters
Figure 2: Cluster a and cluster b are merge
together to form a agglomerative clusters
Advantages of Hierarchical algorithm:
Flexibility is the major advantage because
it is based on granularity of the data nodes
Calculative procedures used for estimating
the distance between the two data nodes
Analysis of types of attributes
Disadvantages of Hierarchical algorithm
The criteria for the termination of the data
nodes is not adequate and clear
The clusters cannot be revisited
Linkage metric should be prepared for managing
the hierarchy of clusters. The convex shape is the
common shape achieved by synchronising the data
nodes effectively. CURE and CHAMELEON are
the common techniques which are used for
analysing the arbitrary shape to the hierarchical
clusters. The BINARY Divisive partitioning
algorithm is used for generating the binary
taxonomies for the collection of cluster. The
connectivity matrix is developed for managing the
threshold distance between the data nodes of
similar clusters. The BIRCH algorithm is used for
managing the hierarchical cluster for establishing
the graph partitioning between the data nodes. The
big data of the project can be easily fit into memory
by using the BIRCH algorithm.
Linkage Matrix:
The splitting of the data nodes in the hierarchical
algorithm are merge into linkage matrix for
analysing the subsets taken in the cluster. The
linkage matrix can contain single linkage, multi-
linkage, average linkage, and complete linkage.
The pair wise matrix is developed for performing
the operation between the data nodes.
The operation like mean, average, median, mode,
and variance can be effectively calculated by the
clusters stored in the linkage Matrix. The linkage
matrix can be updated by the following formula:
The time complexity of the linkage matrix is O(N2).
The minimum spanning tree of the hierarchical
clusters can be developed for analysing the distance
travelled between the data nodes.
4.3 Binary Divisive Partitioning clustering
algorithm:
The binary divisive partitioning clustering
algorithm is based on linear algebra principles. The
filtering of the data and information and retrieval of
required information from the large data set can be
effectively achieved by applying the concept of
singular value decomposition (SVD). The matrix
can be decomposed by applying the following
principle of singular value decomposition.
The division of data space can be effectively done
by applying the principle of centroid orthogonal
approach on the data nodes used in the clusters.
The splitting of the data nodes helps in achieving
highest cardinality. The variance of the intra-cluster
data nodes are used for calculating the distance
between the two largest clusters in the data set.
4.4 Relocation clustering approach
In this algorithm, data is divided into several
subsets. The infeasibility occurs with the
procedures which are used for optimization of
iterative procedures. The reassigning of the data
values to the K-clusters can be effectively done
with the help of relocation clustering algorithm. In
the traditional approach, the revisiting of the data
nodes and the associated cluster is the complex task
(Stefan, 2014). With the help of relocation
clustering approach, the revisiting of the data nodes
can be effectively carried out. The quality of the
cluster can be improved by deploying the
Paraphrase This Document
Need a fresh take? Get an instant paraphrase of this document with our AI Paraphraser
relocation clustering approach to the large data sets.
The parameters should be developed for
performing the data partitioning of the conceptual
designing. The probabilistic approach is used for
managing the interoperability between the different
clusters. The objective function is used managing
the dependency in the linkage matrix. The distance
between the inter-cluster and intra-cluster can be
effectively managed with the help of objective
function (Sanse, and Sharma, 2015). The K-means
algorithm is used for optimizing the distance
between the data centre and data nodes. The types
of attributes are used for managing the medoids of
the cluster. The statistical approach is used
managing the geometric distance between the two
clusters. The mean is calculated can be effectively
drawn with the help of relocation clustering
approach.
4.5 Probabilistic Clustering
The probabilistic clustering is used developing for
managing the probability distribution model. The
operations which are performed on the clusters are
mean, average, median, and variance (Jain, 2015).
The mixture model is based on assumptions and
probability. The distribution parameters are used
for calculating the hidden cluster. The pattern
recognition system is used for estimating the
probability of the clusters (Revathi and Sumathi,
2013). The likelihood of the probabilistic clustering
approach can be analysed on the mixture model
with the help of given formula:
The expectation-maximization method is used for
calculating the objective function with the help of
Log Likelihood function. The two way iterative
procedure is used for reassigning the data values
with the help of creating fuzzy logic. The
convergence of the log function helps in optimizing
the index value of the tree.
The probabilistic clustering approach is effective in
reassigning the data codes to the complex structure.
The data batches can be effectively developed for
managing the clusters in the large data sets. The
Covariance matrix is developed for storing the
statistical approach for managing the data available
on the large data sets (Nagesh, and Satyamurthy,
2015). The intermediate results of the process are
used for assigning the data values to the iterative
procedures. The K-clusters are used for tracking the
task in the probabilistic approach. The mixture
model is used for managing the sub-division of the
data nodes. It helps in identifying the number of
clusters which can be divided into different sectors
according to the arbitrary shape of the data set. The
heterogeneous data is collected into mixture model
for retrieving the information from the multivariate
static data collected from different demographics
(Vijayarani and Sakila, 2015). The transition matrix
is used for sequencing the data values in the
clusters. The n-sequences of the distribution
approaches can be developed with the help of finite
state Markov model. The augmentation of the
customer profile can be used for defining the
operation on the data.
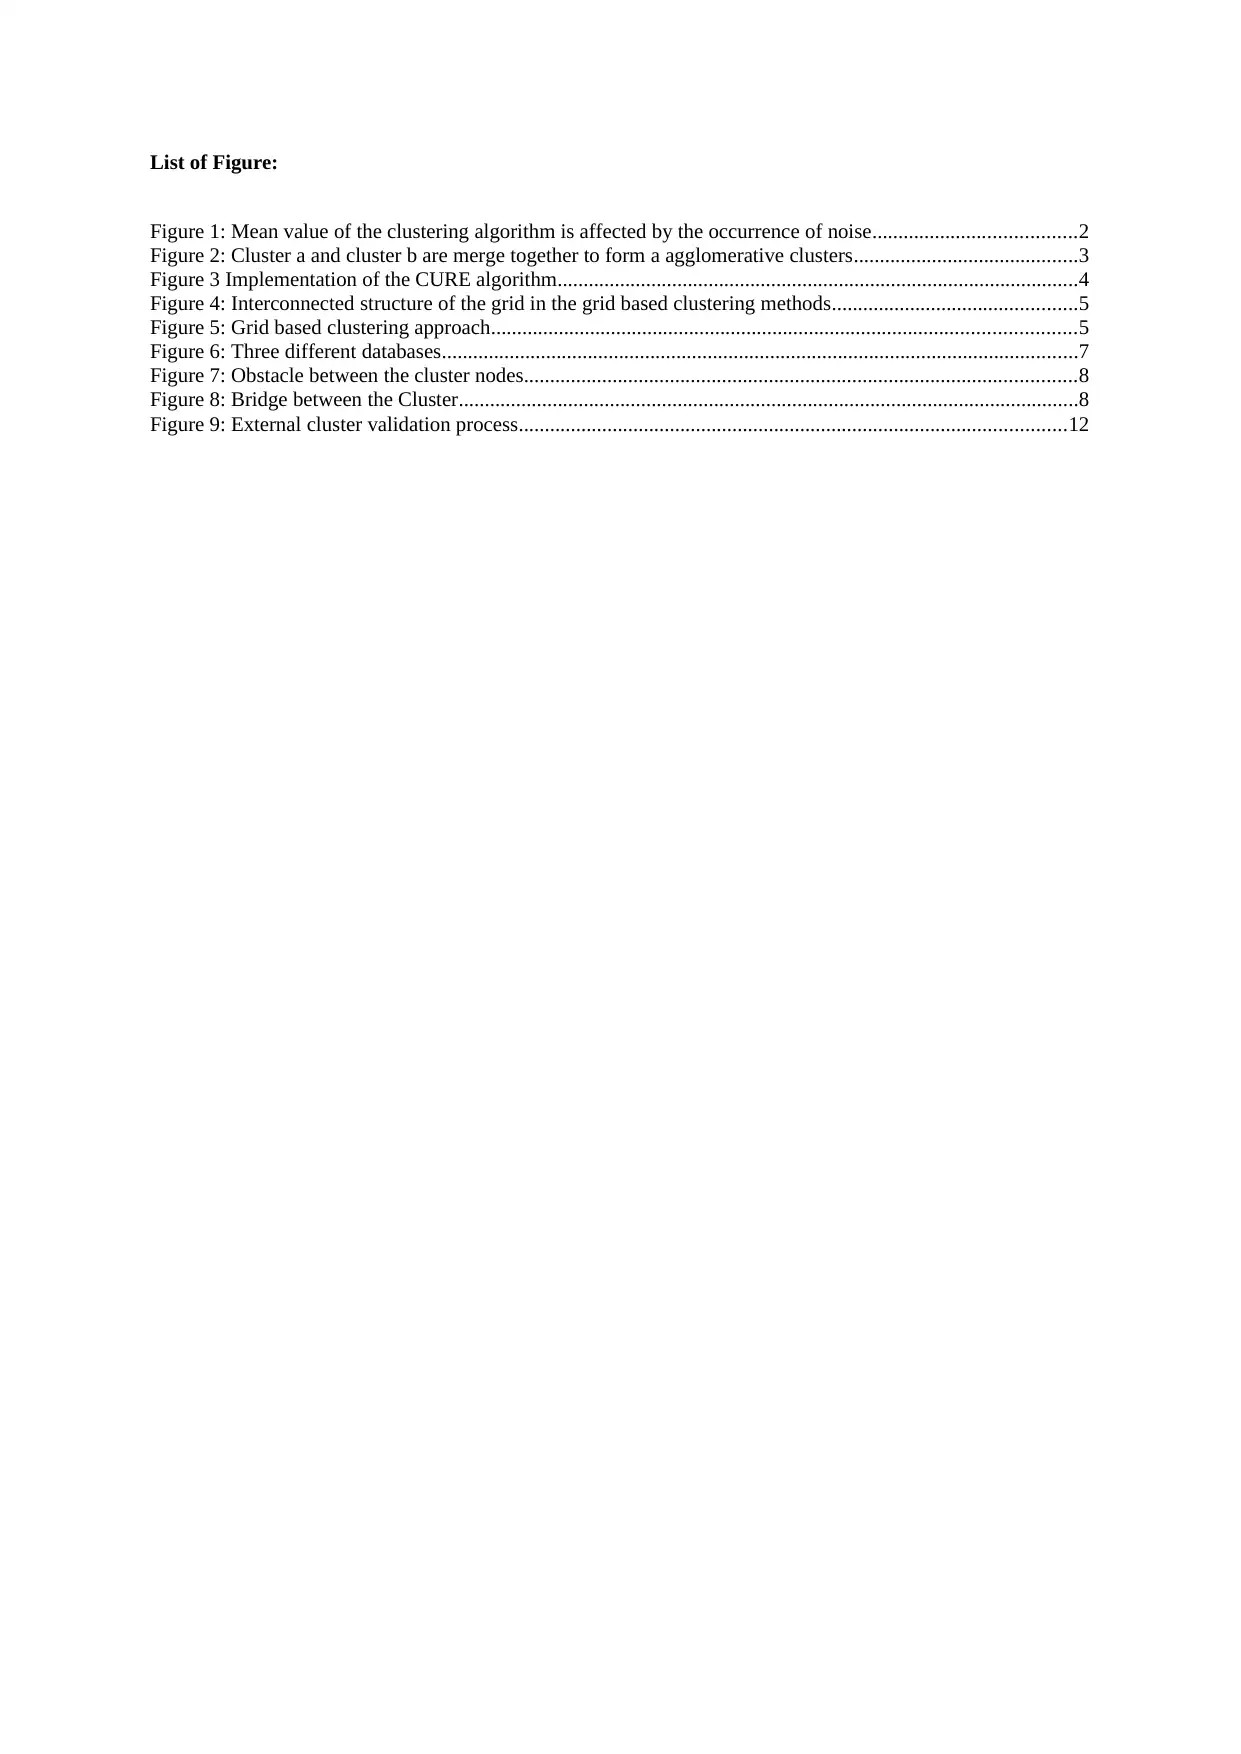
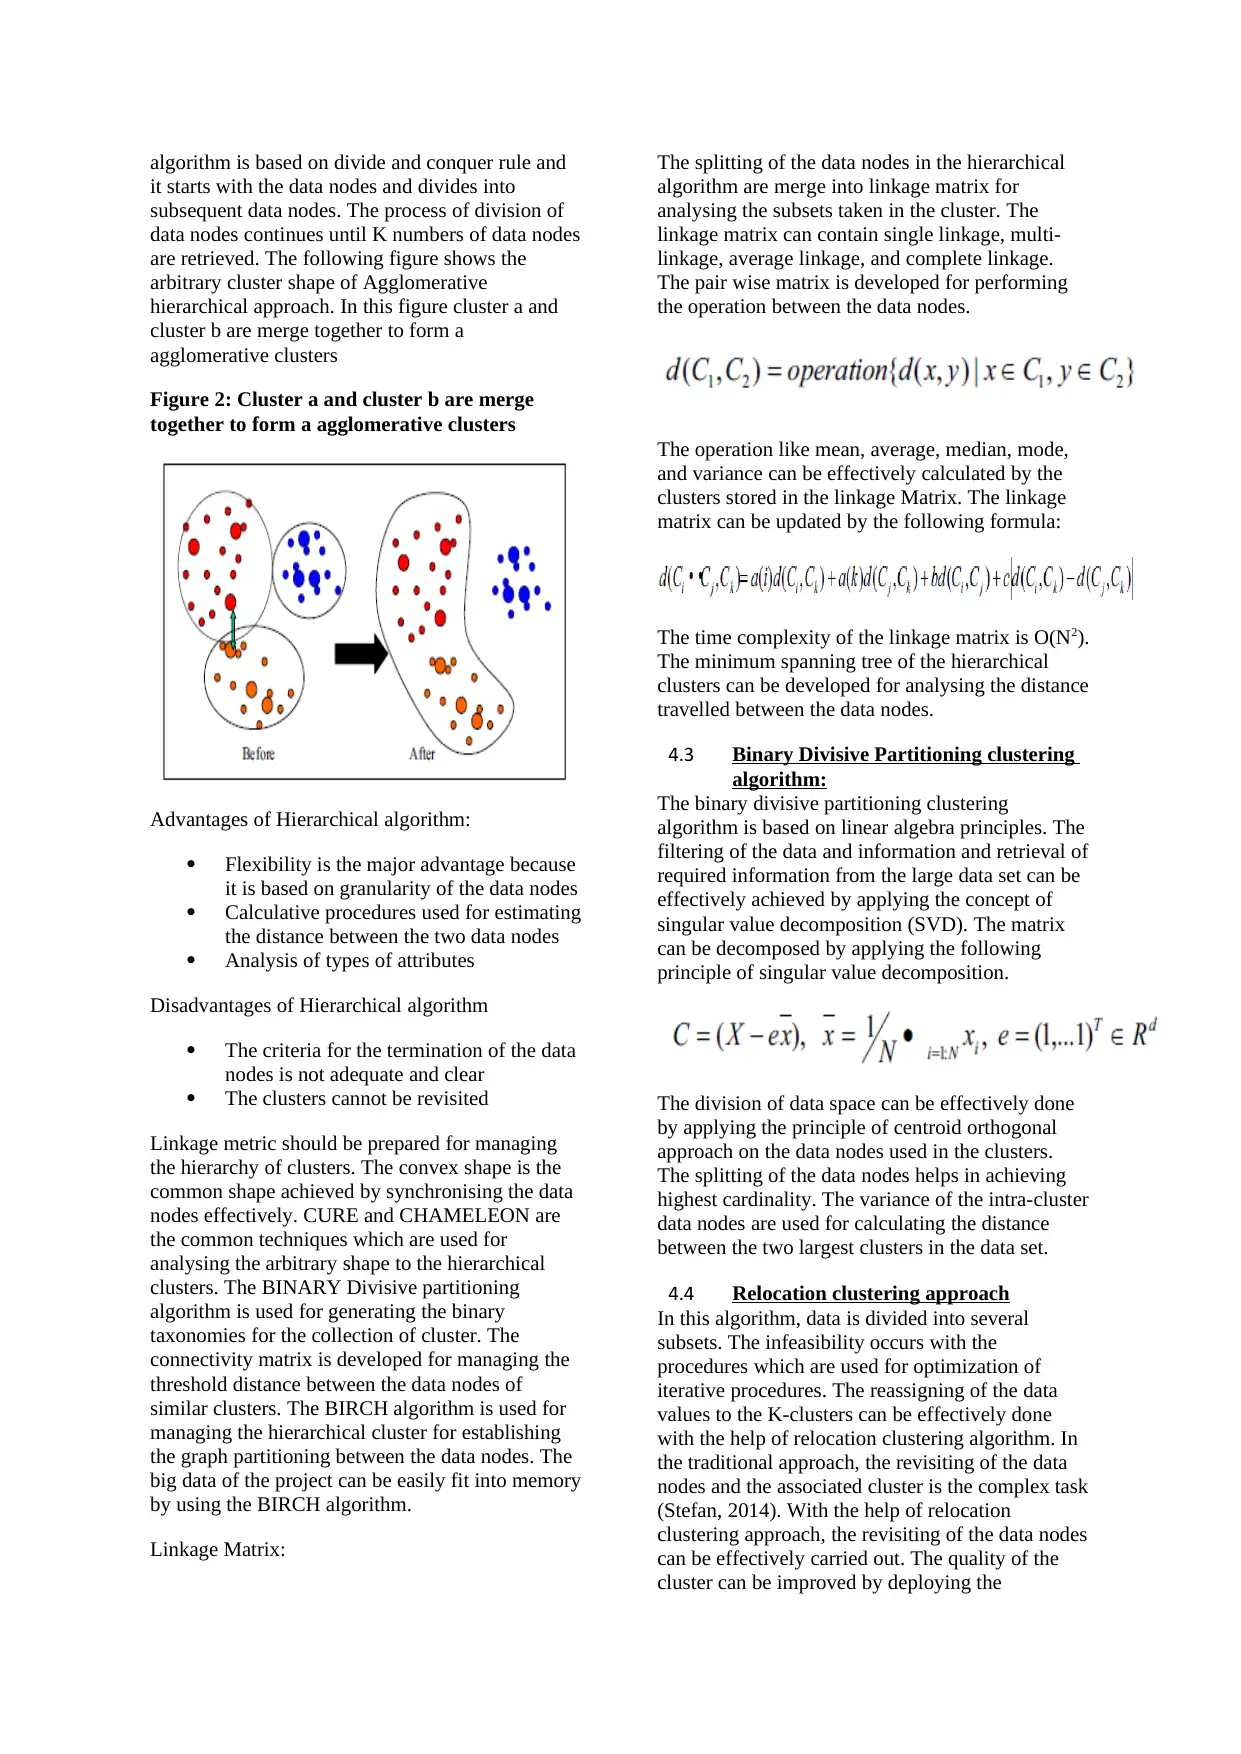
4.6 CURE Algorithm:
The CURE algorithm is based on centroid data
nodes for the division of data in the database. The
random clustering process is used for providing
effective shape to the clusters. O(n2 Log n) is the
complexity of the CURE algorithm for developing
the cluster on the spatial databases (Pattanaik,
2016). The following diagram shows the
implementation of the CURE algorithm:
Figure 3 Implementation of the CURE
algorithm
4.7 Birch Algorithm:
The BIRCH algorithm is used for managing the
main memory of the system to initiates the
clustering process and minimizes the memory
constraints. It works on managing the n-
dimensional data in the database. The birch
algorithm is based on the following function:
Where N stands for data nodes, LS is the linear
summation of the all the N data nodes, and SS is
the square of N data nodes (Nithya, Duraiswamy,
The parameters should be developed for
performing the data partitioning of the conceptual
designing. The probabilistic approach is used for
managing the interoperability between the different
clusters. The objective function is used managing
the dependency in the linkage matrix. The distance
between the inter-cluster and intra-cluster can be
effectively managed with the help of objective
function (Sanse, and Sharma, 2015). The K-means
algorithm is used for optimizing the distance
between the data centre and data nodes. The types
of attributes are used for managing the medoids of
the cluster. The statistical approach is used
managing the geometric distance between the two
clusters. The mean is calculated can be effectively
drawn with the help of relocation clustering
approach.
4.5 Probabilistic Clustering
The probabilistic clustering is used developing for
managing the probability distribution model. The
operations which are performed on the clusters are
mean, average, median, and variance (Jain, 2015).
The mixture model is based on assumptions and
probability. The distribution parameters are used
for calculating the hidden cluster. The pattern
recognition system is used for estimating the
probability of the clusters (Revathi and Sumathi,
2013). The likelihood of the probabilistic clustering
approach can be analysed on the mixture model
with the help of given formula:
The expectation-maximization method is used for
calculating the objective function with the help of
Log Likelihood function. The two way iterative
procedure is used for reassigning the data values
with the help of creating fuzzy logic. The
convergence of the log function helps in optimizing
the index value of the tree.
The probabilistic clustering approach is effective in
reassigning the data codes to the complex structure.
The data batches can be effectively developed for
managing the clusters in the large data sets. The
Covariance matrix is developed for storing the
statistical approach for managing the data available
on the large data sets (Nagesh, and Satyamurthy,
2015). The intermediate results of the process are
used for assigning the data values to the iterative
procedures. The K-clusters are used for tracking the
task in the probabilistic approach. The mixture
model is used for managing the sub-division of the
data nodes. It helps in identifying the number of
clusters which can be divided into different sectors
according to the arbitrary shape of the data set. The
heterogeneous data is collected into mixture model
for retrieving the information from the multivariate
static data collected from different demographics
(Vijayarani and Sakila, 2015). The transition matrix
is used for sequencing the data values in the
clusters. The n-sequences of the distribution
approaches can be developed with the help of finite
state Markov model. The augmentation of the
customer profile can be used for defining the
operation on the data.
4.6 CURE Algorithm:
The CURE algorithm is based on centroid data
nodes for the division of data in the database. The
random clustering process is used for providing
effective shape to the clusters. O(n2 Log n) is the
complexity of the CURE algorithm for developing
the cluster on the spatial databases (Pattanaik,
2016). The following diagram shows the
implementation of the CURE algorithm:
Figure 3 Implementation of the CURE
algorithm
4.7 Birch Algorithm:
The BIRCH algorithm is used for managing the
main memory of the system to initiates the
clustering process and minimizes the memory
constraints. It works on managing the n-
dimensional data in the database. The birch
algorithm is based on the following function:
Where N stands for data nodes, LS is the linear
summation of the all the N data nodes, and SS is
the square of N data nodes (Nithya, Duraiswamy,
Gomathy, 2013). The implementation of the
BIRCH algorithm is divided into four phases like
initial clustering procedures, construction of the
clustering tree, Global clustering, and improving
the cluster quality. The complexity of the BIRCH
algorithm is O(N).
4.8 CHAMELEON:
The CHAMELEON algorithm is used for
overcoming the problems faced in the CURE and
BIRCH algorithm. The objective of the
CHAMELEON algorithm is used for representing
the sparse graph for the data nodes. It helps in
identifying the interrelationship between clusters
and objects in the database. The function which is
used for representing the interconnection between
the clusters and objects is:
- This specify the edge cut cluster
between the values of Ci and Cj.
- This is used for managing the
connectivity between the clusters.
- It helps in identifying the minimal cut
edge for the interconnectivity between the clusters.
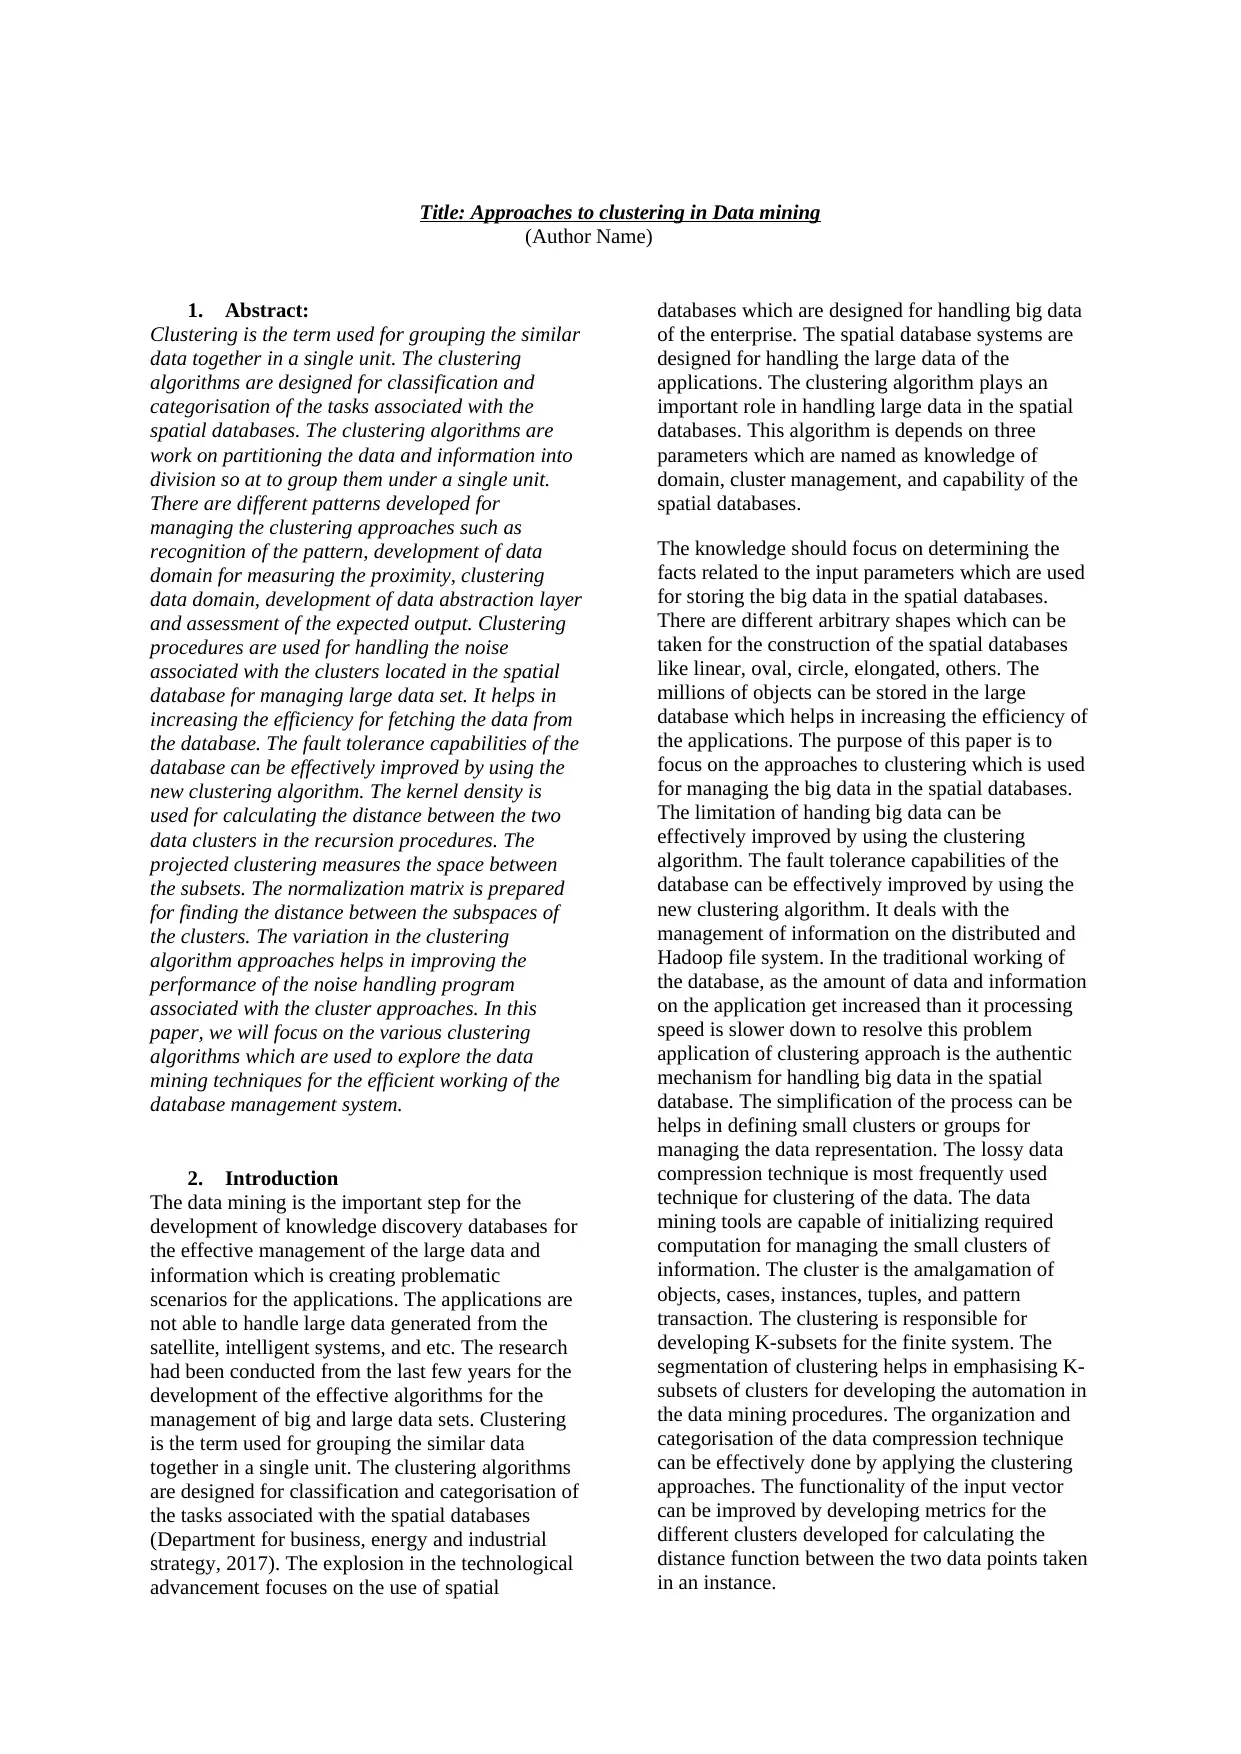
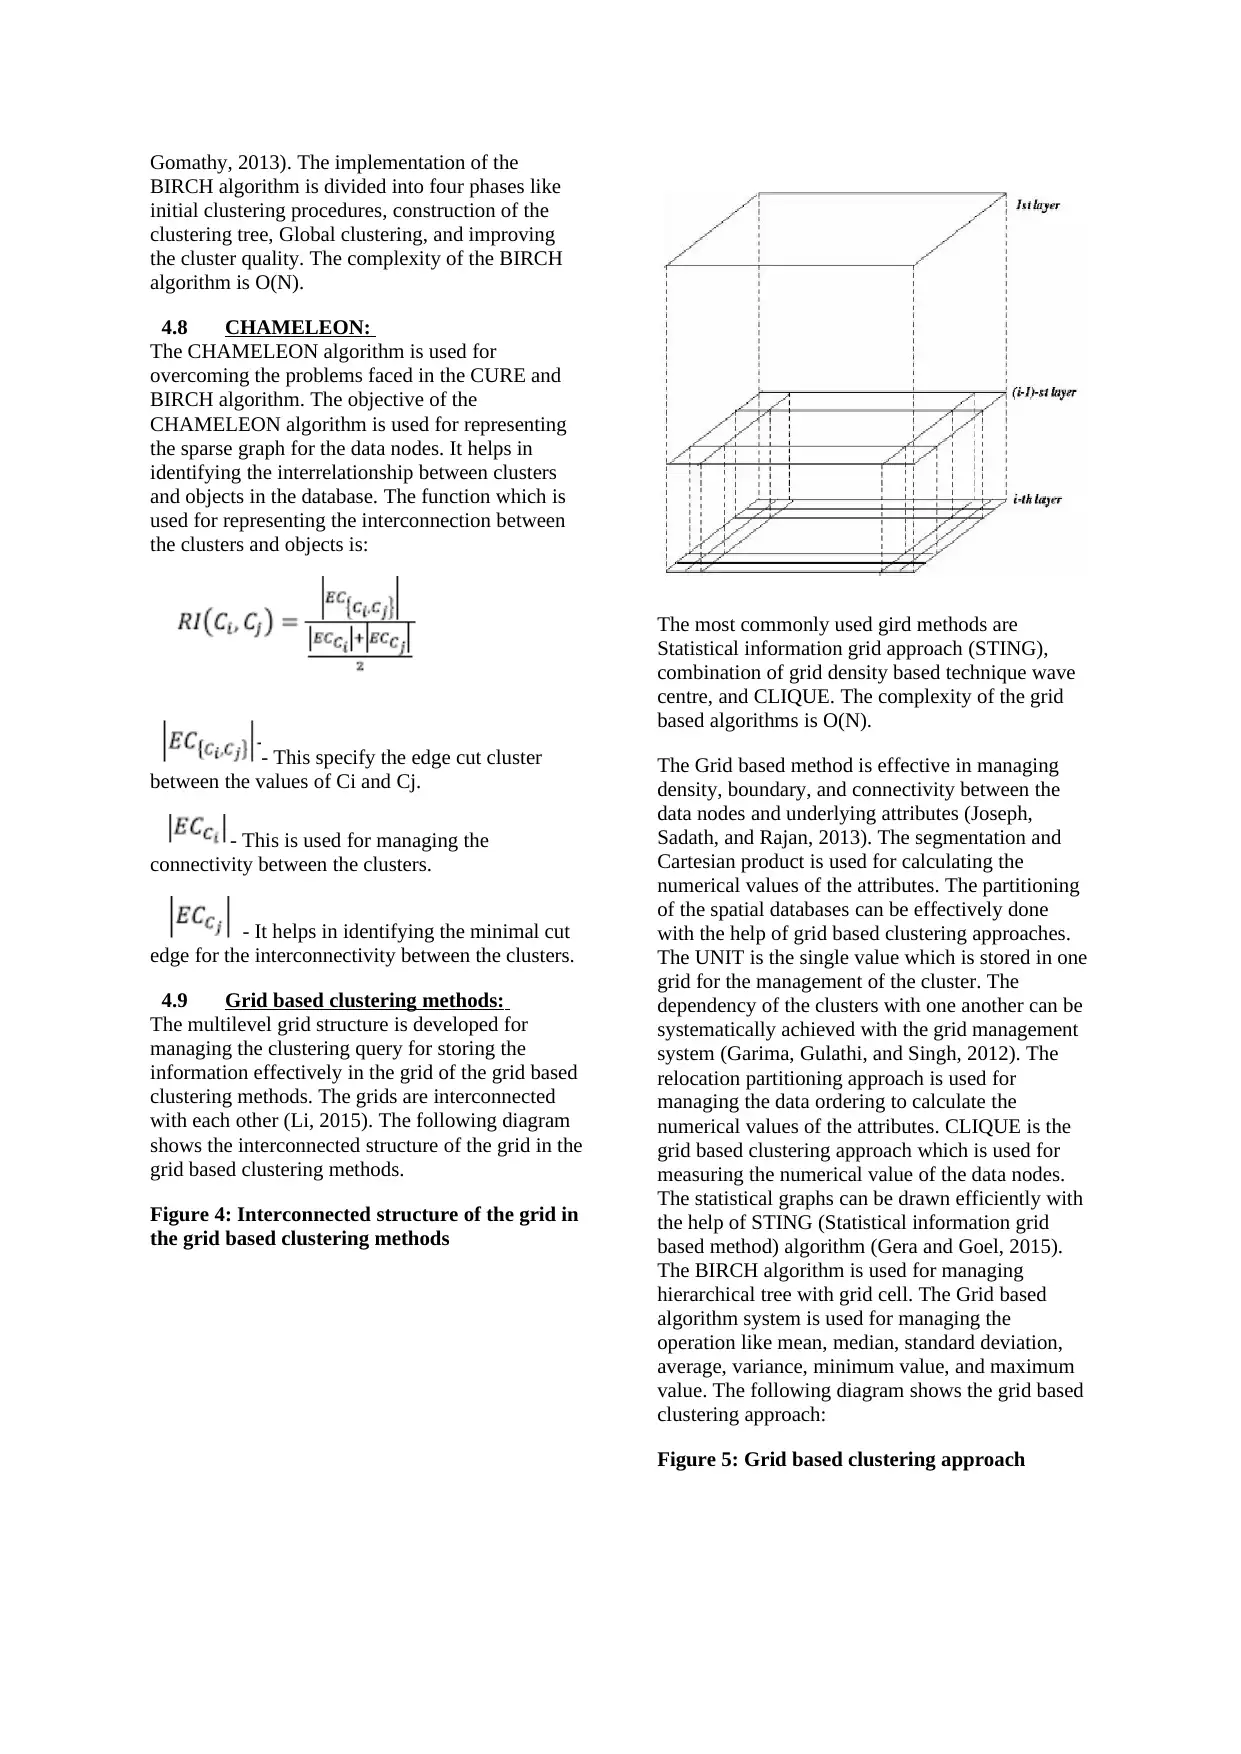
4.9 Grid based clustering methods:
The multilevel grid structure is developed for
managing the clustering query for storing the
information effectively in the grid of the grid based
clustering methods. The grids are interconnected
with each other (Li, 2015). The following diagram
shows the interconnected structure of the grid in the
grid based clustering methods.
Figure 4: Interconnected structure of the grid in
the grid based clustering methods
The most commonly used gird methods are
Statistical information grid approach (STING),
combination of grid density based technique wave
centre, and CLIQUE. The complexity of the grid
based algorithms is O(N).
The Grid based method is effective in managing
density, boundary, and connectivity between the
data nodes and underlying attributes (Joseph,
Sadath, and Rajan, 2013). The segmentation and
Cartesian product is used for calculating the
numerical values of the attributes. The partitioning
of the spatial databases can be effectively done
with the help of grid based clustering approaches.
The UNIT is the single value which is stored in one
grid for the management of the cluster. The
dependency of the clusters with one another can be
systematically achieved with the grid management
system (Garima, Gulathi, and Singh, 2012). The
relocation partitioning approach is used for
managing the data ordering to calculate the
numerical values of the attributes. CLIQUE is the
grid based clustering approach which is used for
measuring the numerical value of the data nodes.
The statistical graphs can be drawn efficiently with
the help of STING (Statistical information grid
based method) algorithm (Gera and Goel, 2015).
The BIRCH algorithm is used for managing
hierarchical tree with grid cell. The Grid based
algorithm system is used for managing the
operation like mean, median, standard deviation,
average, variance, minimum value, and maximum
value. The following diagram shows the grid based
clustering approach:
Figure 5: Grid based clustering approach
BIRCH algorithm is divided into four phases like
initial clustering procedures, construction of the
clustering tree, Global clustering, and improving
the cluster quality. The complexity of the BIRCH
algorithm is O(N).
4.8 CHAMELEON:
The CHAMELEON algorithm is used for
overcoming the problems faced in the CURE and
BIRCH algorithm. The objective of the
CHAMELEON algorithm is used for representing
the sparse graph for the data nodes. It helps in
identifying the interrelationship between clusters
and objects in the database. The function which is
used for representing the interconnection between
the clusters and objects is:
- This specify the edge cut cluster
between the values of Ci and Cj.
- This is used for managing the
connectivity between the clusters.
- It helps in identifying the minimal cut
edge for the interconnectivity between the clusters.
4.9 Grid based clustering methods:
The multilevel grid structure is developed for
managing the clustering query for storing the
information effectively in the grid of the grid based
clustering methods. The grids are interconnected
with each other (Li, 2015). The following diagram
shows the interconnected structure of the grid in the
grid based clustering methods.
Figure 4: Interconnected structure of the grid in
the grid based clustering methods
The most commonly used gird methods are
Statistical information grid approach (STING),
combination of grid density based technique wave
centre, and CLIQUE. The complexity of the grid
based algorithms is O(N).
The Grid based method is effective in managing
density, boundary, and connectivity between the
data nodes and underlying attributes (Joseph,
Sadath, and Rajan, 2013). The segmentation and
Cartesian product is used for calculating the
numerical values of the attributes. The partitioning
of the spatial databases can be effectively done
with the help of grid based clustering approaches.
The UNIT is the single value which is stored in one
grid for the management of the cluster. The
dependency of the clusters with one another can be
systematically achieved with the grid management
system (Garima, Gulathi, and Singh, 2012). The
relocation partitioning approach is used for
managing the data ordering to calculate the
numerical values of the attributes. CLIQUE is the
grid based clustering approach which is used for
measuring the numerical value of the data nodes.
The statistical graphs can be drawn efficiently with
the help of STING (Statistical information grid
based method) algorithm (Gera and Goel, 2015).
The BIRCH algorithm is used for managing
hierarchical tree with grid cell. The Grid based
algorithm system is used for managing the
operation like mean, median, standard deviation,
average, variance, minimum value, and maximum
value. The following diagram shows the grid based
clustering approach:
Figure 5: Grid based clustering approach
⊘ This is a preview!⊘
Do you want full access?
Subscribe today to unlock all pages.
Trusted by 1+ million students worldwide
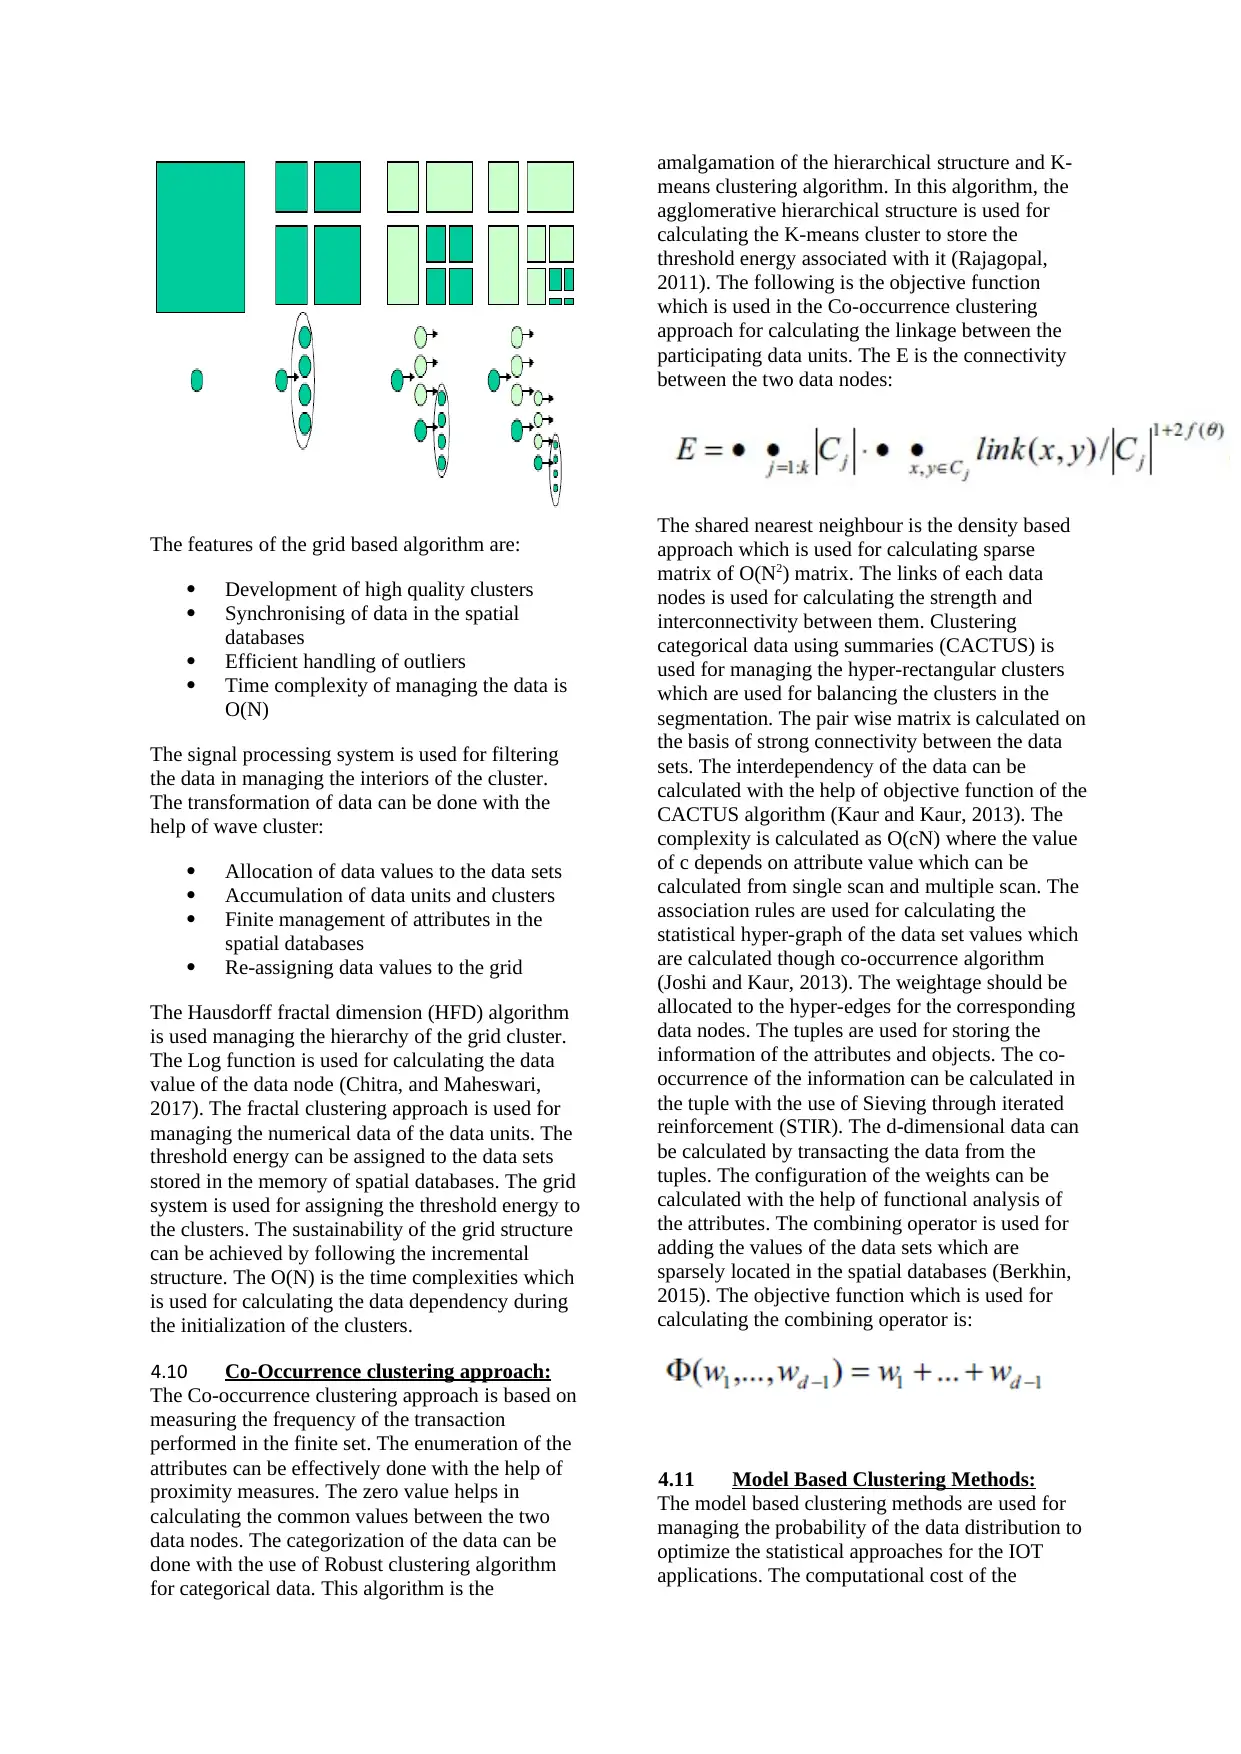
The features of the grid based algorithm are:
Development of high quality clusters
Synchronising of data in the spatial
databases
Efficient handling of outliers
Time complexity of managing the data is
O(N)
The signal processing system is used for filtering
the data in managing the interiors of the cluster.
The transformation of data can be done with the
help of wave cluster:
Allocation of data values to the data sets
Accumulation of data units and clusters
Finite management of attributes in the
spatial databases
Re-assigning data values to the grid
The Hausdorff fractal dimension (HFD) algorithm
is used managing the hierarchy of the grid cluster.
The Log function is used for calculating the data
value of the data node (Chitra, and Maheswari,
2017). The fractal clustering approach is used for
managing the numerical data of the data units. The
threshold energy can be assigned to the data sets
stored in the memory of spatial databases. The grid
system is used for assigning the threshold energy to
the clusters. The sustainability of the grid structure
can be achieved by following the incremental
structure. The O(N) is the time complexities which
is used for calculating the data dependency during
the initialization of the clusters.
4.10 Co-Occurrence clustering approach:
The Co-occurrence clustering approach is based on
measuring the frequency of the transaction
performed in the finite set. The enumeration of the
attributes can be effectively done with the help of
proximity measures. The zero value helps in
calculating the common values between the two
data nodes. The categorization of the data can be
done with the use of Robust clustering algorithm
for categorical data. This algorithm is the
amalgamation of the hierarchical structure and K-
means clustering algorithm. In this algorithm, the
agglomerative hierarchical structure is used for
calculating the K-means cluster to store the
threshold energy associated with it (Rajagopal,
2011). The following is the objective function
which is used in the Co-occurrence clustering
approach for calculating the linkage between the
participating data units. The E is the connectivity
between the two data nodes:
The shared nearest neighbour is the density based
approach which is used for calculating sparse
matrix of O(N2) matrix. The links of each data
nodes is used for calculating the strength and
interconnectivity between them. Clustering
categorical data using summaries (CACTUS) is
used for managing the hyper-rectangular clusters
which are used for balancing the clusters in the
segmentation. The pair wise matrix is calculated on
the basis of strong connectivity between the data
sets. The interdependency of the data can be
calculated with the help of objective function of the
CACTUS algorithm (Kaur and Kaur, 2013). The
complexity is calculated as O(cN) where the value
of c depends on attribute value which can be
calculated from single scan and multiple scan. The
association rules are used for calculating the
statistical hyper-graph of the data set values which
are calculated though co-occurrence algorithm
(Joshi and Kaur, 2013). The weightage should be
allocated to the hyper-edges for the corresponding
data nodes. The tuples are used for storing the
information of the attributes and objects. The co-
occurrence of the information can be calculated in
the tuple with the use of Sieving through iterated
reinforcement (STIR). The d-dimensional data can
be calculated by transacting the data from the
tuples. The configuration of the weights can be
calculated with the help of functional analysis of
the attributes. The combining operator is used for
adding the values of the data sets which are
sparsely located in the spatial databases (Berkhin,
2015). The objective function which is used for
calculating the combining operator is:
4.11 Model Based Clustering Methods:
The model based clustering methods are used for
managing the probability of the data distribution to
optimize the statistical approaches for the IOT
applications. The computational cost of the
Paraphrase This Document
Need a fresh take? Get an instant paraphrase of this document with our AI Paraphraser
clustering approaches can be effectively
manageable by performing scaling of the data
(Tsai, Wu, Tsai, 2015). The clustering algorithms
are used for solving the complexities through the
data distribution through different arbitrary shapes.
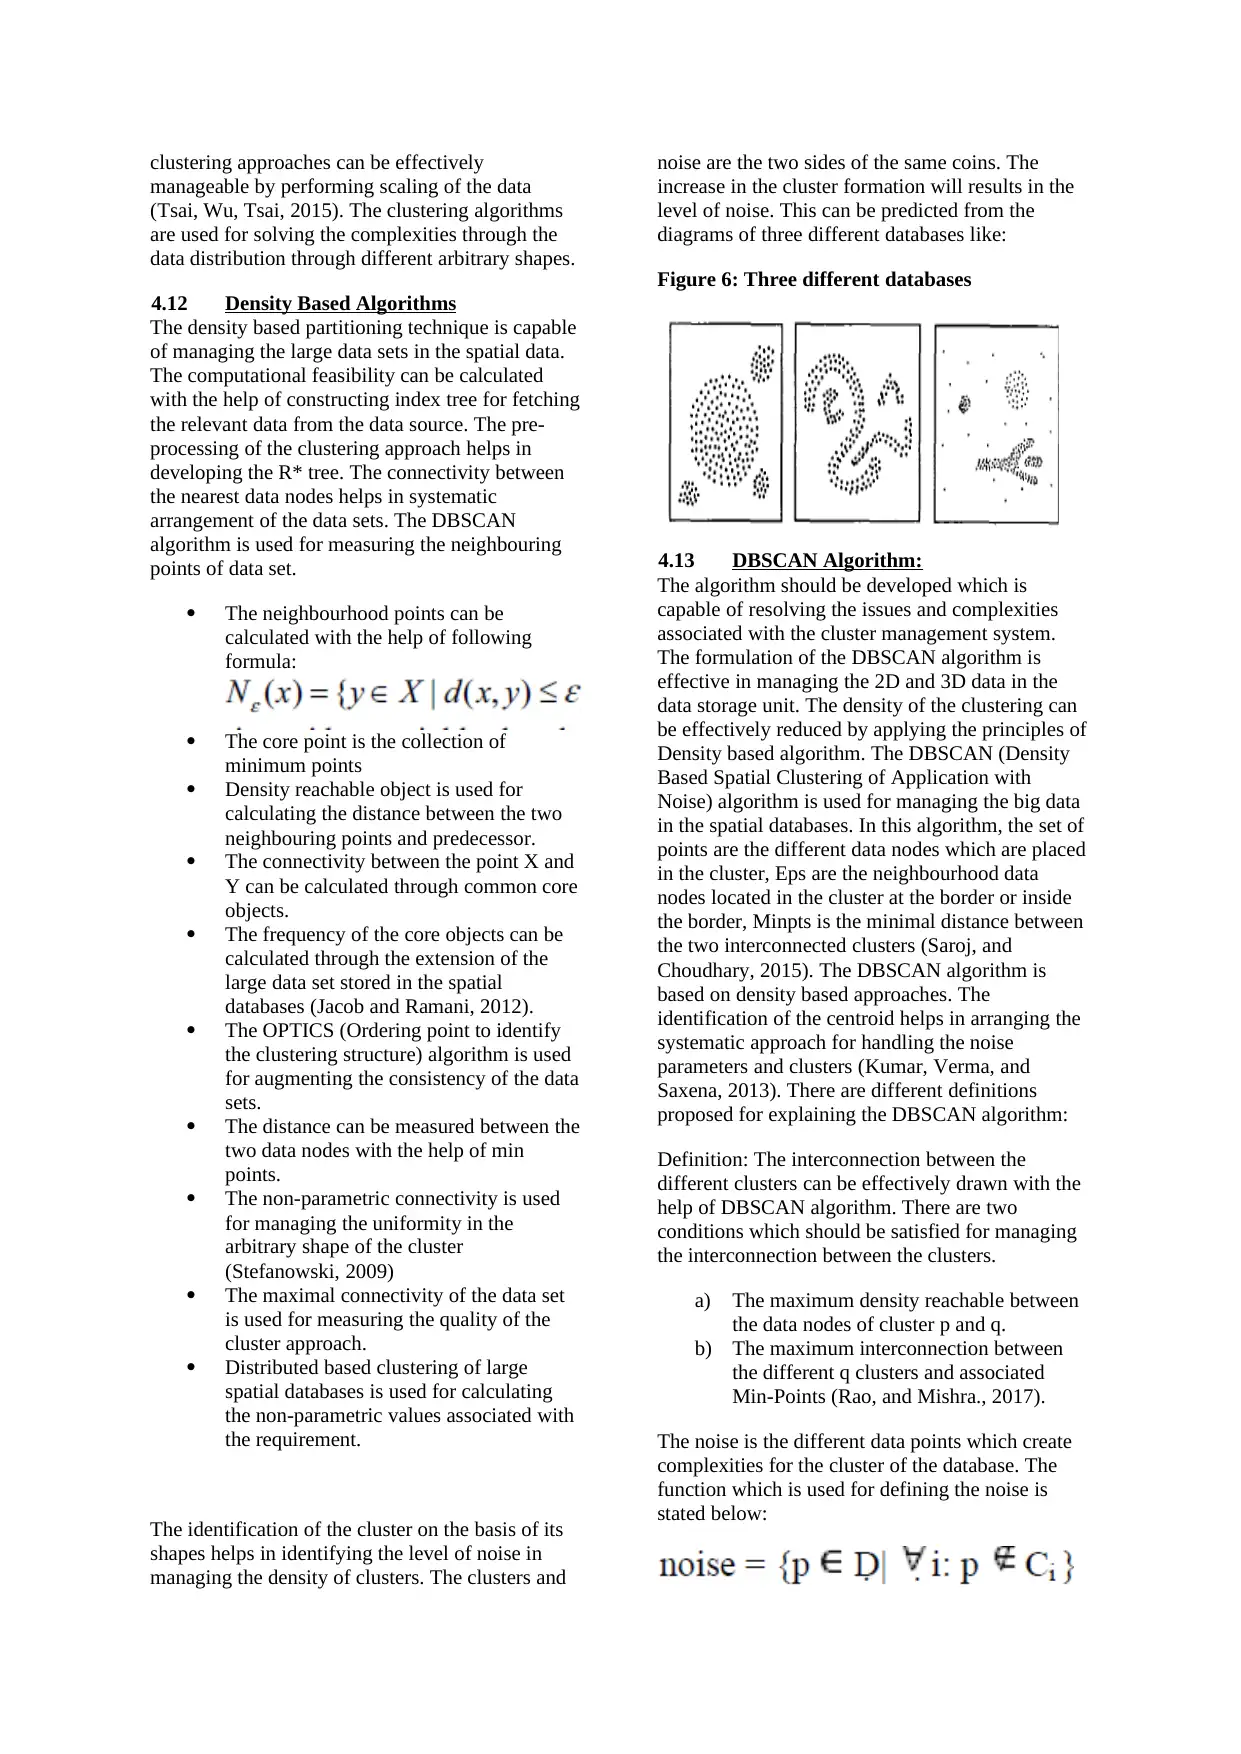
4.12 Density Based Algorithms
The density based partitioning technique is capable
of managing the large data sets in the spatial data.
The computational feasibility can be calculated
with the help of constructing index tree for fetching
the relevant data from the data source. The pre-
processing of the clustering approach helps in
developing the R* tree. The connectivity between
the nearest data nodes helps in systematic
arrangement of the data sets. The DBSCAN
algorithm is used for measuring the neighbouring
points of data set.
The neighbourhood points can be
calculated with the help of following
formula:
The core point is the collection of
minimum points
Density reachable object is used for
calculating the distance between the two
neighbouring points and predecessor.
The connectivity between the point X and
Y can be calculated through common core
objects.
The frequency of the core objects can be
calculated through the extension of the
large data set stored in the spatial
databases (Jacob and Ramani, 2012).
The OPTICS (Ordering point to identify
the clustering structure) algorithm is used
for augmenting the consistency of the data
sets.
The distance can be measured between the
two data nodes with the help of min
points.
The non-parametric connectivity is used
for managing the uniformity in the
arbitrary shape of the cluster
(Stefanowski, 2009)
The maximal connectivity of the data set
is used for measuring the quality of the
cluster approach.
Distributed based clustering of large
spatial databases is used for calculating
the non-parametric values associated with
the requirement.
The identification of the cluster on the basis of its
shapes helps in identifying the level of noise in
managing the density of clusters. The clusters and
noise are the two sides of the same coins. The
increase in the cluster formation will results in the
level of noise. This can be predicted from the
diagrams of three different databases like:
Figure 6: Three different databases
4.13 DBSCAN Algorithm:
The algorithm should be developed which is
capable of resolving the issues and complexities
associated with the cluster management system.
The formulation of the DBSCAN algorithm is
effective in managing the 2D and 3D data in the
data storage unit. The density of the clustering can
be effectively reduced by applying the principles of
Density based algorithm. The DBSCAN (Density
Based Spatial Clustering of Application with
Noise) algorithm is used for managing the big data
in the spatial databases. In this algorithm, the set of
points are the different data nodes which are placed
in the cluster, Eps are the neighbourhood data
nodes located in the cluster at the border or inside
the border, Minpts is the minimal distance between
the two interconnected clusters (Saroj, and
Choudhary, 2015). The DBSCAN algorithm is
based on density based approaches. The
identification of the centroid helps in arranging the
systematic approach for handling the noise
parameters and clusters (Kumar, Verma, and
Saxena, 2013). There are different definitions
proposed for explaining the DBSCAN algorithm:
Definition: The interconnection between the
different clusters can be effectively drawn with the
help of DBSCAN algorithm. There are two
conditions which should be satisfied for managing
the interconnection between the clusters.
a) The maximum density reachable between
the data nodes of cluster p and q.
b) The maximum interconnection between
the different q clusters and associated
Min-Points (Rao, and Mishra., 2017).
The noise is the different data points which create
complexities for the cluster of the database. The
function which is used for defining the noise is
stated below:
manageable by performing scaling of the data
(Tsai, Wu, Tsai, 2015). The clustering algorithms
are used for solving the complexities through the
data distribution through different arbitrary shapes.
4.12 Density Based Algorithms
The density based partitioning technique is capable
of managing the large data sets in the spatial data.
The computational feasibility can be calculated
with the help of constructing index tree for fetching
the relevant data from the data source. The pre-
processing of the clustering approach helps in
developing the R* tree. The connectivity between
the nearest data nodes helps in systematic
arrangement of the data sets. The DBSCAN
algorithm is used for measuring the neighbouring
points of data set.
The neighbourhood points can be
calculated with the help of following
formula:
The core point is the collection of
minimum points
Density reachable object is used for
calculating the distance between the two
neighbouring points and predecessor.
The connectivity between the point X and
Y can be calculated through common core
objects.
The frequency of the core objects can be
calculated through the extension of the
large data set stored in the spatial
databases (Jacob and Ramani, 2012).
The OPTICS (Ordering point to identify
the clustering structure) algorithm is used
for augmenting the consistency of the data
sets.
The distance can be measured between the
two data nodes with the help of min
points.
The non-parametric connectivity is used
for managing the uniformity in the
arbitrary shape of the cluster
(Stefanowski, 2009)
The maximal connectivity of the data set
is used for measuring the quality of the
cluster approach.
Distributed based clustering of large
spatial databases is used for calculating
the non-parametric values associated with
the requirement.
The identification of the cluster on the basis of its
shapes helps in identifying the level of noise in
managing the density of clusters. The clusters and
noise are the two sides of the same coins. The
increase in the cluster formation will results in the
level of noise. This can be predicted from the
diagrams of three different databases like:
Figure 6: Three different databases
4.13 DBSCAN Algorithm:
The algorithm should be developed which is
capable of resolving the issues and complexities
associated with the cluster management system.
The formulation of the DBSCAN algorithm is
effective in managing the 2D and 3D data in the
data storage unit. The density of the clustering can
be effectively reduced by applying the principles of
Density based algorithm. The DBSCAN (Density
Based Spatial Clustering of Application with
Noise) algorithm is used for managing the big data
in the spatial databases. In this algorithm, the set of
points are the different data nodes which are placed
in the cluster, Eps are the neighbourhood data
nodes located in the cluster at the border or inside
the border, Minpts is the minimal distance between
the two interconnected clusters (Saroj, and
Choudhary, 2015). The DBSCAN algorithm is
based on density based approaches. The
identification of the centroid helps in arranging the
systematic approach for handling the noise
parameters and clusters (Kumar, Verma, and
Saxena, 2013). There are different definitions
proposed for explaining the DBSCAN algorithm:
Definition: The interconnection between the
different clusters can be effectively drawn with the
help of DBSCAN algorithm. There are two
conditions which should be satisfied for managing
the interconnection between the clusters.
a) The maximum density reachable between
the data nodes of cluster p and q.
b) The maximum interconnection between
the different q clusters and associated
Min-Points (Rao, and Mishra., 2017).
The noise is the different data points which create
complexities for the cluster of the database. The
function which is used for defining the noise is
stated below:
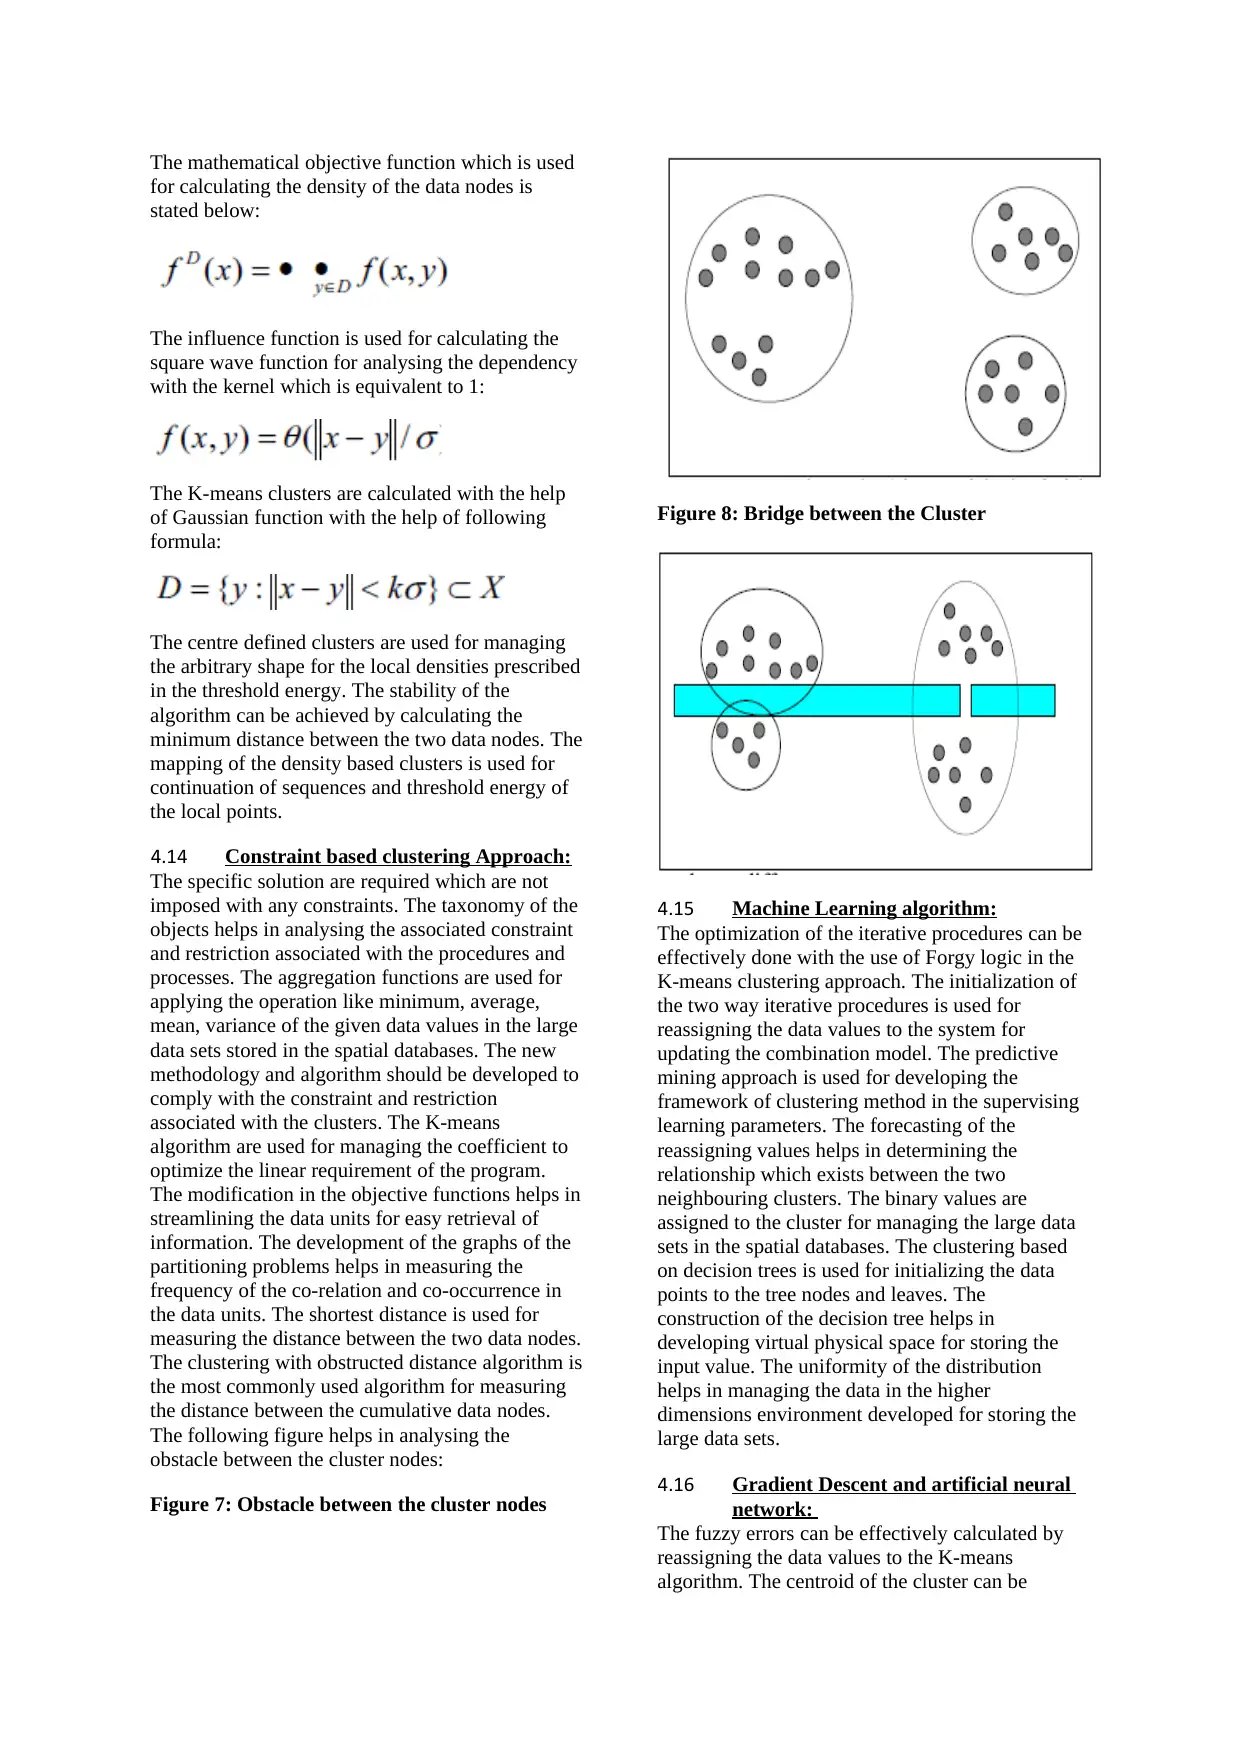
The mathematical objective function which is used
for calculating the density of the data nodes is
stated below:
The influence function is used for calculating the
square wave function for analysing the dependency
with the kernel which is equivalent to 1:
The K-means clusters are calculated with the help
of Gaussian function with the help of following
formula:
The centre defined clusters are used for managing
the arbitrary shape for the local densities prescribed
in the threshold energy. The stability of the
algorithm can be achieved by calculating the
minimum distance between the two data nodes. The
mapping of the density based clusters is used for
continuation of sequences and threshold energy of
the local points.
4.14 Constraint based clustering Approach:
The specific solution are required which are not
imposed with any constraints. The taxonomy of the
objects helps in analysing the associated constraint
and restriction associated with the procedures and
processes. The aggregation functions are used for
applying the operation like minimum, average,
mean, variance of the given data values in the large
data sets stored in the spatial databases. The new
methodology and algorithm should be developed to
comply with the constraint and restriction
associated with the clusters. The K-means
algorithm are used for managing the coefficient to
optimize the linear requirement of the program.
The modification in the objective functions helps in
streamlining the data units for easy retrieval of
information. The development of the graphs of the
partitioning problems helps in measuring the
frequency of the co-relation and co-occurrence in
the data units. The shortest distance is used for
measuring the distance between the two data nodes.
The clustering with obstructed distance algorithm is
the most commonly used algorithm for measuring
the distance between the cumulative data nodes.
The following figure helps in analysing the
obstacle between the cluster nodes:
Figure 7: Obstacle between the cluster nodes
Figure 8: Bridge between the Cluster
4.15 Machine Learning algorithm:
The optimization of the iterative procedures can be
effectively done with the use of Forgy logic in the
K-means clustering approach. The initialization of
the two way iterative procedures is used for
reassigning the data values to the system for
updating the combination model. The predictive
mining approach is used for developing the
framework of clustering method in the supervising
learning parameters. The forecasting of the
reassigning values helps in determining the
relationship which exists between the two
neighbouring clusters. The binary values are
assigned to the cluster for managing the large data
sets in the spatial databases. The clustering based
on decision trees is used for initializing the data
points to the tree nodes and leaves. The
construction of the decision tree helps in
developing virtual physical space for storing the
input value. The uniformity of the distribution
helps in managing the data in the higher
dimensions environment developed for storing the
large data sets.
4.16 Gradient Descent and artificial neural
network:
The fuzzy errors can be effectively calculated by
reassigning the data values to the K-means
algorithm. The centroid of the cluster can be
⊘ This is a preview!⊘
Do you want full access?
Subscribe today to unlock all pages.
Trusted by 1+ million students worldwide
1 out of 19
Related Documents


Your All-in-One AI-Powered Toolkit for Academic Success.
+13062052269
info@desklib.com
Available 24*7 on WhatsApp / Email
![[object Object]](/_next/static/media/star-bottom.7253800d.svg)
Unlock your academic potential
Copyright © 2020–2026 A2Z Services. All Rights Reserved. Developed and managed by ZUCOL.