Importance of Data Mining in Crime Analysis and Data Visualization
VerifiedAdded on 2022/10/11
|16
|3860
|16
Report
AI Summary
This report delves into the critical role of data mining in crime analysis and data visualization. It begins with an abstract and table of contents, followed by an introduction that defines data mining and its application in crime analysis. A comprehensive literature review explores data mining and analysis techniques, emphasizing their implementation in crime analysis. The methodology section outlines suggested research methods. The report also discusses the implications of the research, ethical considerations, and concludes with future research directions. The report highlights the use of visualization techniques, such as heat maps, to analyze crime patterns and the collaboration between data mining and visualization for enhanced comprehension of data insights. The report is based on the topic of Importance of Data Mining in Crime Analysis and Data Analysis through visualisation.
Running head: DATA MINING
Importance of data mining in Crime Analysis and Data Analysis through visualisation
Name of the student:
Name of the university:
Author note:
Importance of data mining in Crime Analysis and Data Analysis through visualisation
Name of the student:
Name of the university:
Author note:
Paraphrase This Document
Need a fresh take? Get an instant paraphrase of this document with our AI Paraphraser
1DATA MINING
Abstract
The entire report is prepared based on the topic of Importance of Data Mining in Crime
Analysis and Data Analysis through visualisation. Based on the topic a detailed overview of
the data mining technique along with the crime analysis technique are studied within the
literature review. A detailed research of the data analysis techniques that are used within the
visualisation technique are also analysed. Suitable research methods are hence suggested for
the research which will help in gaining the overall research objectives. The related ethical
considerations ate also pointed out for the study which needs to be followed within the entire
research. Thus, the future implications of the study are hence pointed out which will help the
researchers to gain further area of study for future purposes.
2DATA MINING
Table of Contents
Introduction:...............................................................................................................................3
Literature review:.......................................................................................................................4
Methodology:...........................................................................................................................10
Implication of the Research:....................................................................................................11
Conclusion:..............................................................................................................................12
References:...............................................................................................................................13
⊘ This is a preview!⊘
Do you want full access?
Subscribe today to unlock all pages.
Trusted by 1+ million students worldwide
3DATA MINING
Introduction:
Data mining is the computer-assisted procedure of data collection and analysis, where
huge data sets are extracted and the significance of the data is then obtained. In order to make
active, knowledge-driven results, data mining instruments forecast behaviours and future
trends. Tools for data mining are capable to answer questions from businesses that have
conventionally taken too long to resolve. They scan the hidden pattern databases for
predictive data that can be missed by experts because it is beyond their expectations. Data
mining originates its name from the resemblance among a search in a large database for
valuable information and a mining for a valuable set. Both processes either involve screening
or intelligently scrutinizing a huge amount of material to find out where the value exist in.
Data mining is being used to detect hidden and clandestine patterns between large datasets
when data analysis is used to evaluate models and data set hypotheses. Data mining could
even be evaluated when one activity in the data analysis to collect, process, prepare and
model data for valuable insight. All other areas in the fields of BI or BUI are often considered
to be larger. However, data mining is much more focused on organized data work. However,
both structured and unstructured data can be used for data analysis. Data mining is the
method for improving the use of information, and data analytical analysis helps to develop as
well as establish business-based decision models. Therefore, data mining relies so much on
mathematical and scientific concepts, when data analysis utilizes the principles of business
intelligence. The lack of visualization of information in data mining in data analysis is a more
obvious difference.
In visual graphs, figures and bars, data visualization is the procedure of presenting
data or the evidence. It is used for visual reporting of applications, networks, hardware or
virtually all IT equipment by users for presentation, operations, or general statistics. The
visualization of data is usually done by extracting data from the underlying IT system. The
Paraphrase This Document
Need a fresh take? Get an instant paraphrase of this document with our AI Paraphraser
4DATA MINING
figures, statistics and overall activities are generally used for this information. The data is
synthesized with the software of data visualization, displayed on the dashboard of the system.
It is usually done to help IT administrators quickly, visually and easily understand how the
system works. Many applications in the field of IT performance monitoring use data
visualization techniques for a statistical view of scrutinizing system performance. This part of
the report is hence prepared so as to analyse the way by which the data mining method can be
useful to the field of data analysis and crime analysis by the use of visualisation technique.
Literature review:
Data mining and Data Analysis technique:
With the exponential increase in the amount of data that is getting stored within the
database systems, the priority of data is getting increased day by day. With the increasing
number of crucial information data are getting stored within the data warehouse from
numerous sources (Witten et al., 2016). The process of Data mining and Data analysis falls
under the subsets of database management systems consisting of technologies that gets used
up so as to analyse the queries and patterns within the customer database systems. In this
respect, the process of data mining can be defined as the method of extracting data while
analysing it from different aspects and developing a relationship between the summarized
data. On the other hand, the process of data investigation is mainly concerned with the use of
tools and methods so as to develop queries related to the existing data (Tan, 2018). With all
these concepts, the data mining visualisation technique is another area of combined data
mining and data visualisation technique making use of several other techniques including
distortion, pixel oriented or hierarchical method.
Implementation of Data mining in Crime analysis:
5DATA MINING
In any case, it is essential to find a phenomenon called crime under the circumstances
of human social life. We therefore always need an efficient fighting tool for understanding
crime analysis. In essence, crime analysis involves using a structured approach to classify,
uncover and sometimes predict crimes (McClendon & Meghanathan, 2015). The data and
information assigned to the criminal variables are used to input a crime analysis system and
the output includes answering research and analytical questions, extracting knowledge and
ultimately visualizing the results.
Data mining has become an ever-growing ground among criminologists, crime agents
and crime experts thanks to the multifaceted nature of crime and crime-related data and to the
presence of unseen and perhaps immaterial relations among them (Murray & Scime, 2015).
In the policing departments there were large volumes of data linked to crime and the
difficulty of relationships among such data required for the traditional methods of crime
study to be outdated.
On the one hand, these techniques require considerable time and human resources
and, on the other, because of their high level of human interference, they cannot involve
everyone's effective parameters / connections. These deficiencies have shown that a
systematic and smart approach is more necessary than ever for the investigation of crime. The
key solution may be data mining techniques (Neha & Vidyavathi, 2015). Taking into account
the new features in the field of crime analysis of the use of data mining techniques, further
research seems required. The following sections discuss some of the core perceptions of
intelligent crime investigation and crime data mining methods. This includes clustering of
data and artificial neural systems.
⊘ This is a preview!⊘
Do you want full access?
Subscribe today to unlock all pages.
Trusted by 1+ million students worldwide
6DATA MINING
The first benefits to uncontrolled classify crimes and can later be casted-off for the
recognition of crime patterns. Lastly, there has been a planned technique for corresponding
crimes.
Variables of crime seem to be essential since they are initially used by the analysis
algorithm. Crime variables as well as matching crime are two major components of the crime
evaluation process. But at the other side, it is because of its large use in intelligent detection
that crime matching is important. There are certain limitations that can somehow designate
crime. The main theme of the criminal analysis process is that these unique crime parameters
recognized as crime variables. Regardless of the type of crime we could classify it into three
general groups of different types of crime variables: spatially-temporal crime variables (e.g.
position of crime or time of manifestation), natural crime characteristics scene of crime,
psychological pattern of criminals, etc.)
There are also different kinds of crime variables in the scope of larceny crimes, such
as burglary, robbery, auto-theft etc. Therefore, the analysis of different categories of crime is
necessary.
The reason for supporting the above technique is that people only have information on
the recognized crimes that we get in the crime design. Classification techniques, which
willingly address current and recognised crime solved, will not however give potential crimes
a good predictive quality. The nature of offences also changes over time, which means that
clustering methods are more effective in order to detect fresher and unidentified trends in
future.
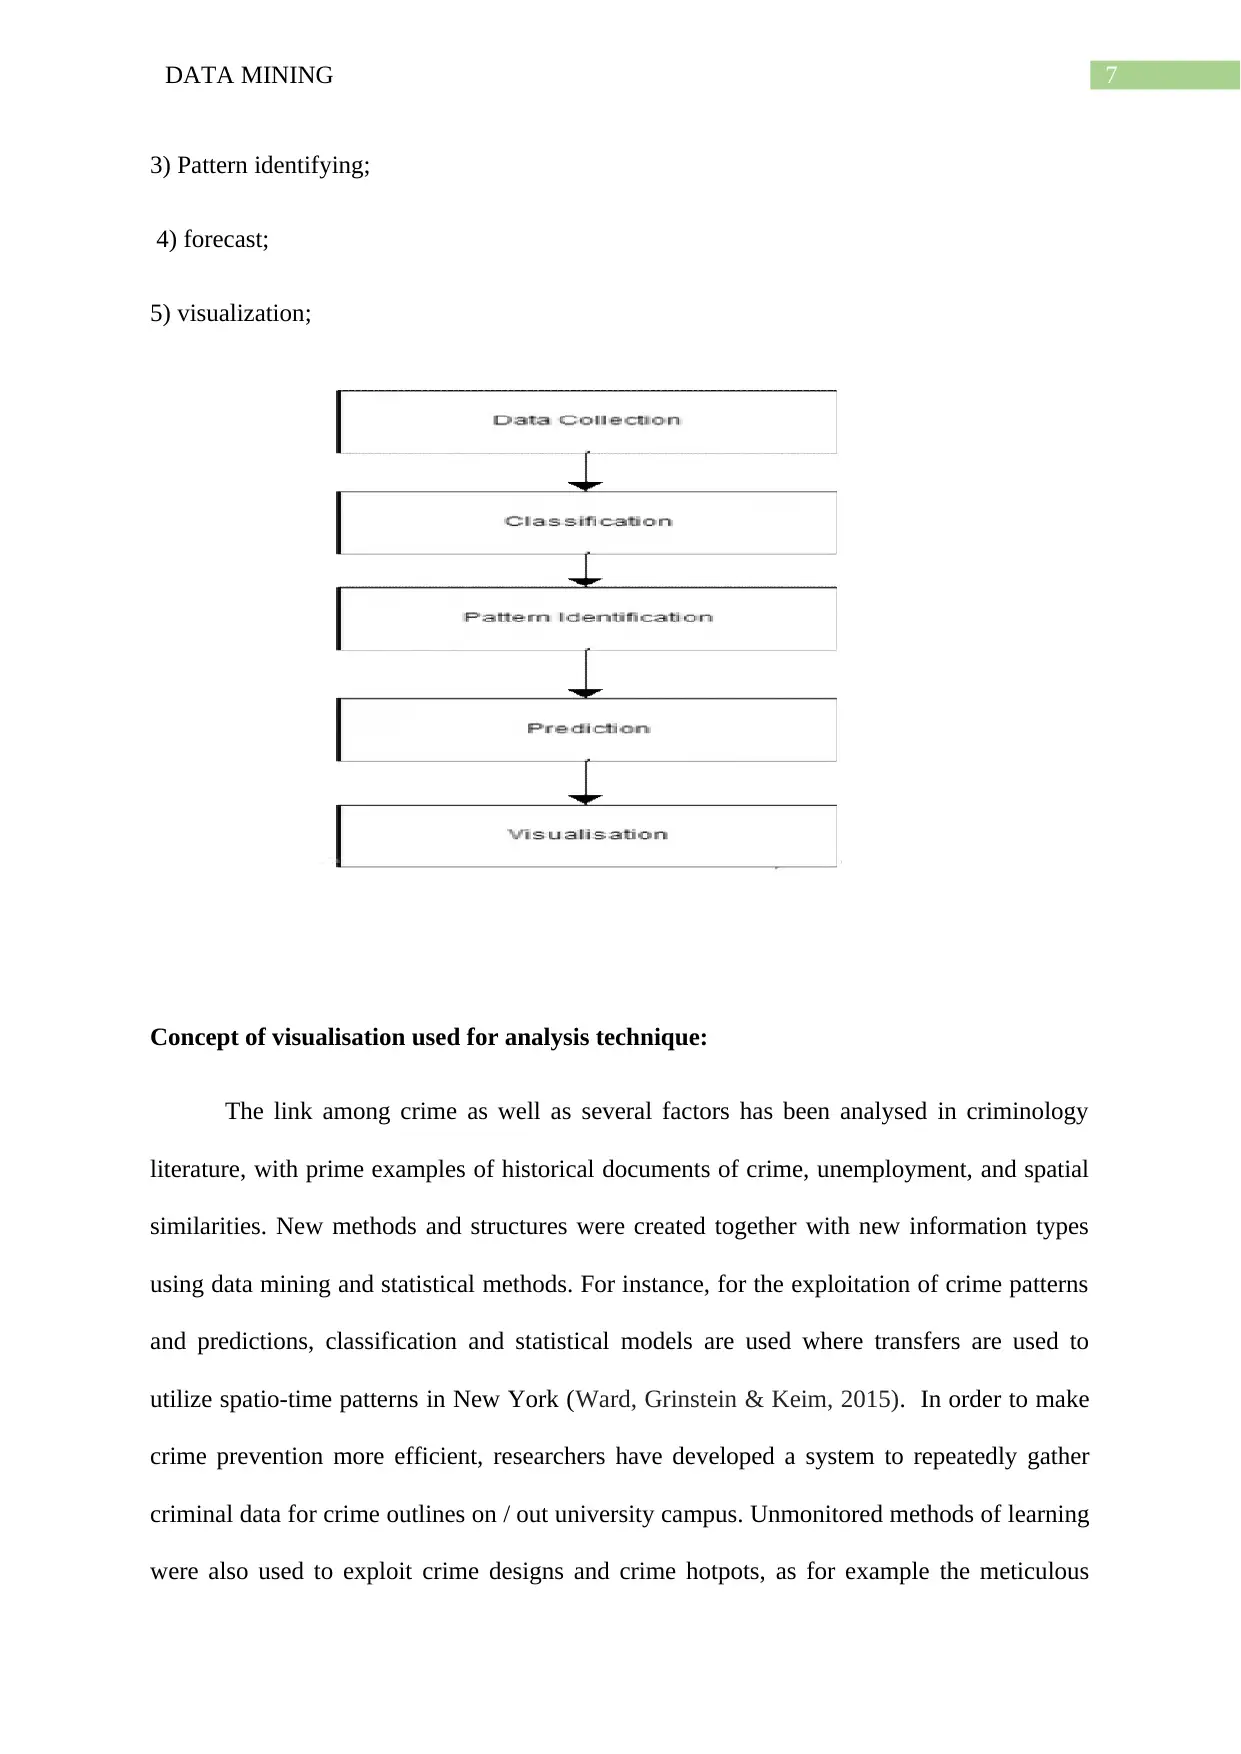
Crime analysis comprises of certain steps which are as follows:
1) Data gathering;
2) Evaluations;
The first benefits to uncontrolled classify crimes and can later be casted-off for the
recognition of crime patterns. Lastly, there has been a planned technique for corresponding
crimes.
Variables of crime seem to be essential since they are initially used by the analysis
algorithm. Crime variables as well as matching crime are two major components of the crime
evaluation process. But at the other side, it is because of its large use in intelligent detection
that crime matching is important. There are certain limitations that can somehow designate
crime. The main theme of the criminal analysis process is that these unique crime parameters
recognized as crime variables. Regardless of the type of crime we could classify it into three
general groups of different types of crime variables: spatially-temporal crime variables (e.g.
position of crime or time of manifestation), natural crime characteristics scene of crime,
psychological pattern of criminals, etc.)
There are also different kinds of crime variables in the scope of larceny crimes, such
as burglary, robbery, auto-theft etc. Therefore, the analysis of different categories of crime is
necessary.
The reason for supporting the above technique is that people only have information on
the recognized crimes that we get in the crime design. Classification techniques, which
willingly address current and recognised crime solved, will not however give potential crimes
a good predictive quality. The nature of offences also changes over time, which means that
clustering methods are more effective in order to detect fresher and unidentified trends in
future.
Crime analysis comprises of certain steps which are as follows:
1) Data gathering;
2) Evaluations;
Paraphrase This Document
Need a fresh take? Get an instant paraphrase of this document with our AI Paraphraser
7DATA MINING
3) Pattern identifying;
4) forecast;
5) visualization;
Concept of visualisation used for analysis technique:
The link among crime as well as several factors has been analysed in criminology
literature, with prime examples of historical documents of crime, unemployment, and spatial
similarities. New methods and structures were created together with new information types
using data mining and statistical methods. For instance, for the exploitation of crime patterns
and predictions, classification and statistical models are used where transfers are used to
utilize spatio-time patterns in New York (Ward, Grinstein & Keim, 2015). In order to make
crime prevention more efficient, researchers have developed a system to repeatedly gather
criminal data for crime outlines on / out university campus. Unmonitored methods of learning
were also used to exploit crime designs and crime hotpots, as for example the meticulous
8DATA MINING
differential flush collection to forecast criminal designs and the flush C-means algorithm so
as to cluster criminal actions in space. They derived rules for association mining to establish
relations between various crimes. A study was carried out on social media to summarize data
mining methods. New models were created to predict crime with deep learning and neural
networks. As a great success in computer vision is achieved by profound learning and
artificial intelligence, they have also been applied in BDA to predict trends and classification.
In long or short-term memory networks, stock prices and gas dissolved during power
transition have succeeded. In order to estimate the power loss trends a neural network has
been used for a smart grid system (Hammersley, 2016). The workflow was similar but more
comprehensive, including statistical analysis, visualization of data, and prediction of trends.
In order to display the statistical links between various characteristics inside the large amount
of data, data mining and visalisation methods are being used. The latest technology and in-
depth learning procedures are used to predict and get the highest accuracy of optimal models.
The following 13 featured attributes will be included in each data set entry of criminal
incidents:
1) IncidentNumber— The amount of each occurrence;
2) Dates— The crime incident date and time-stamp;
3) Category — Crime type. Description— A short note outlining the details of a
criminal offence;
4) DayOfWeek— Weekday of the crime;
5) PdDistrict— District police section ID of where it was allocated;
6) RESOLVE — the way by which the incident will get resolved (the committer
being, say, arrested or reserved);
⊘ This is a preview!⊘
Do you want full access?
Subscribe today to unlock all pages.
Trusted by 1+ million students worldwide
9DATA MINING
7) Address — The estimated amount of crime.
8) X – Crime site length;
9) Y– Crime site latitude;
10) coordinate – pairs of latitude and longitude;
11) dome – whether or not native crimes are perpetuated;
12) arrest – detained or not;
A heat map showing activity levels, usually darker colours for low activity and higher
colours for high activity. In the X axis, the degree of crime is shown in all the main locations
of India however in the Y axis the crime rate is indicated. The data here have been predicated
on the documents of history.
Visualization demonstrates the rate or fraction of crime in locations such as airport,
temple, bus stop, casino, railway stations, bank, jewellery stores, bar, ATM, bus stop, roads
etc. In Visualization the x axis is marked by the most important places, like the banks and
temples, the bus stations, the railway stations etc.
Relation between data mining technique and Visualisation technique and how they can
be collaborated:
In order to make it easier to comprehend its outcomes, the application of visual
representation in the KDD method. The visualization methods can therefore be incorporated
into the KDD system in three distinct ways: to preview the information to be analyzed; to
contribute to understanding information mining outcomes or to comprehend the partial
outcomes of the information extracting process.
Paraphrase This Document
Need a fresh take? Get an instant paraphrase of this document with our AI Paraphraser
10DATA MINING
Nevertheless, the assessment and examination of information using visualization
methods can produce fresh and sufficient information, without the need for other methods of
information mining (Hassani et al., 2016). Visualisation also plays an important part in
human knowledge and is a powerful instrument for conveying ideas. Hence, Vision plays one
of the most vital role.
The choice of the best technique to use in a certain application or situation is
important to consider during the visualization process. The inadequate use of visualization
technologies, triggered by errors in visual representation, can produce insufficient or even
inaccurate outcomes. The visualization techniques were evaluated in the data representation
presented in this study, in an attempt to solve that kind of problem. Such assessment offers
subsidies for the most suitable visualization for KDD users and systems analysts.
The appropriate information features, including: information type, dimensionality
(number of attributes) and scalability (number of logs) should be noted first of all when
visualization methods are used. Another factor when determining for the visualization
method may be the tasks that the user can do during information exploration. This article
seeks to demonstrate how the data's features can affect the choice of visualization methods
and to lay out rules for their selection to best represent information.
Methodology:
There exists a different types of research methodologies in order to apply them in
suitable research works. Thus, it is extremely important to select the appropriate method of
research so as to gain information based on the underlying facts of the proposed topic of this
research study which relates to the- Importance of Data Mining in Crime Analysis and Data
Analysis through visualisation (Kumar, 2019). The importance to choose suitable research
methodology lies in the fact that it helps in understanding the overall method by which the
11DATA MINING
research would be carried out helping readers to analyse topic further to gain more details.
Beside gaining information, the use of suitable research methodology also helps in
eliminating the possible errors that can be caused through human.
For this particular research, in command to satisfy all the objectives of the learning a
qualitative study needs to be held. The main purpose of conducting a qualitative research
methodology is that it can be applicable for small research samples where the outcomes are
not measurable. The effectiveness of qualitative research methodology is mainly based on the
ability and skills of the researchers in gaining personal judgement and skills based on
interpretations. The analysis will be based on the theory of positivism as a part of the research
methodology so as to gain a comprehensive approach of the information obtained from the
topic of research of the study. The research approach that would be utilised for the following
research study is the Deductive Approach that will help in developing a detailed analysis of
the study created on the data sources gained from primary and secondary researches. In the
next step of the methodology approach the descriptive design approach of the research will
help assuring the researcher to go through full examination of the research while extracting
the hidden amount of information as well, as the presence of any raw data through the entire
process of data analysis (Taylor, Bogdan & DeVault, 2015). For this research as a part of the
research methodology, both secondary and primary data will get used within the process so as
to analyse the impact of using Data mining technique so as to analyse crime and data based
on visualisation technique. The entire methodology of the research consists research
philosophy that helps in accommodating the descriptive analysis of the research while
helping to analyse the detailed information of the research topic. Selecting the proper
research philosophy, helps in forming the base of the research which can be applied to the
entire process so as to conduct the study. There are namely four diverse types of research
philosophy which includes Positivism, Realism, Pragmatism and Interpretivism from which
⊘ This is a preview!⊘
Do you want full access?
Subscribe today to unlock all pages.
Trusted by 1+ million students worldwide
1 out of 16
Related Documents


Your All-in-One AI-Powered Toolkit for Academic Success.
+13062052269
info@desklib.com
Available 24*7 on WhatsApp / Email
![[object Object]](/_next/static/media/star-bottom.7253800d.svg)
Unlock your academic potential
Copyright © 2020–2026 A2Z Services. All Rights Reserved. Developed and managed by ZUCOL.