Data Mining Assignment: Analyzing XL Miner Output and Clustering

Verified

Added on  2020/03/15

|7
|739
|219
Homework Assignment
AI Summary
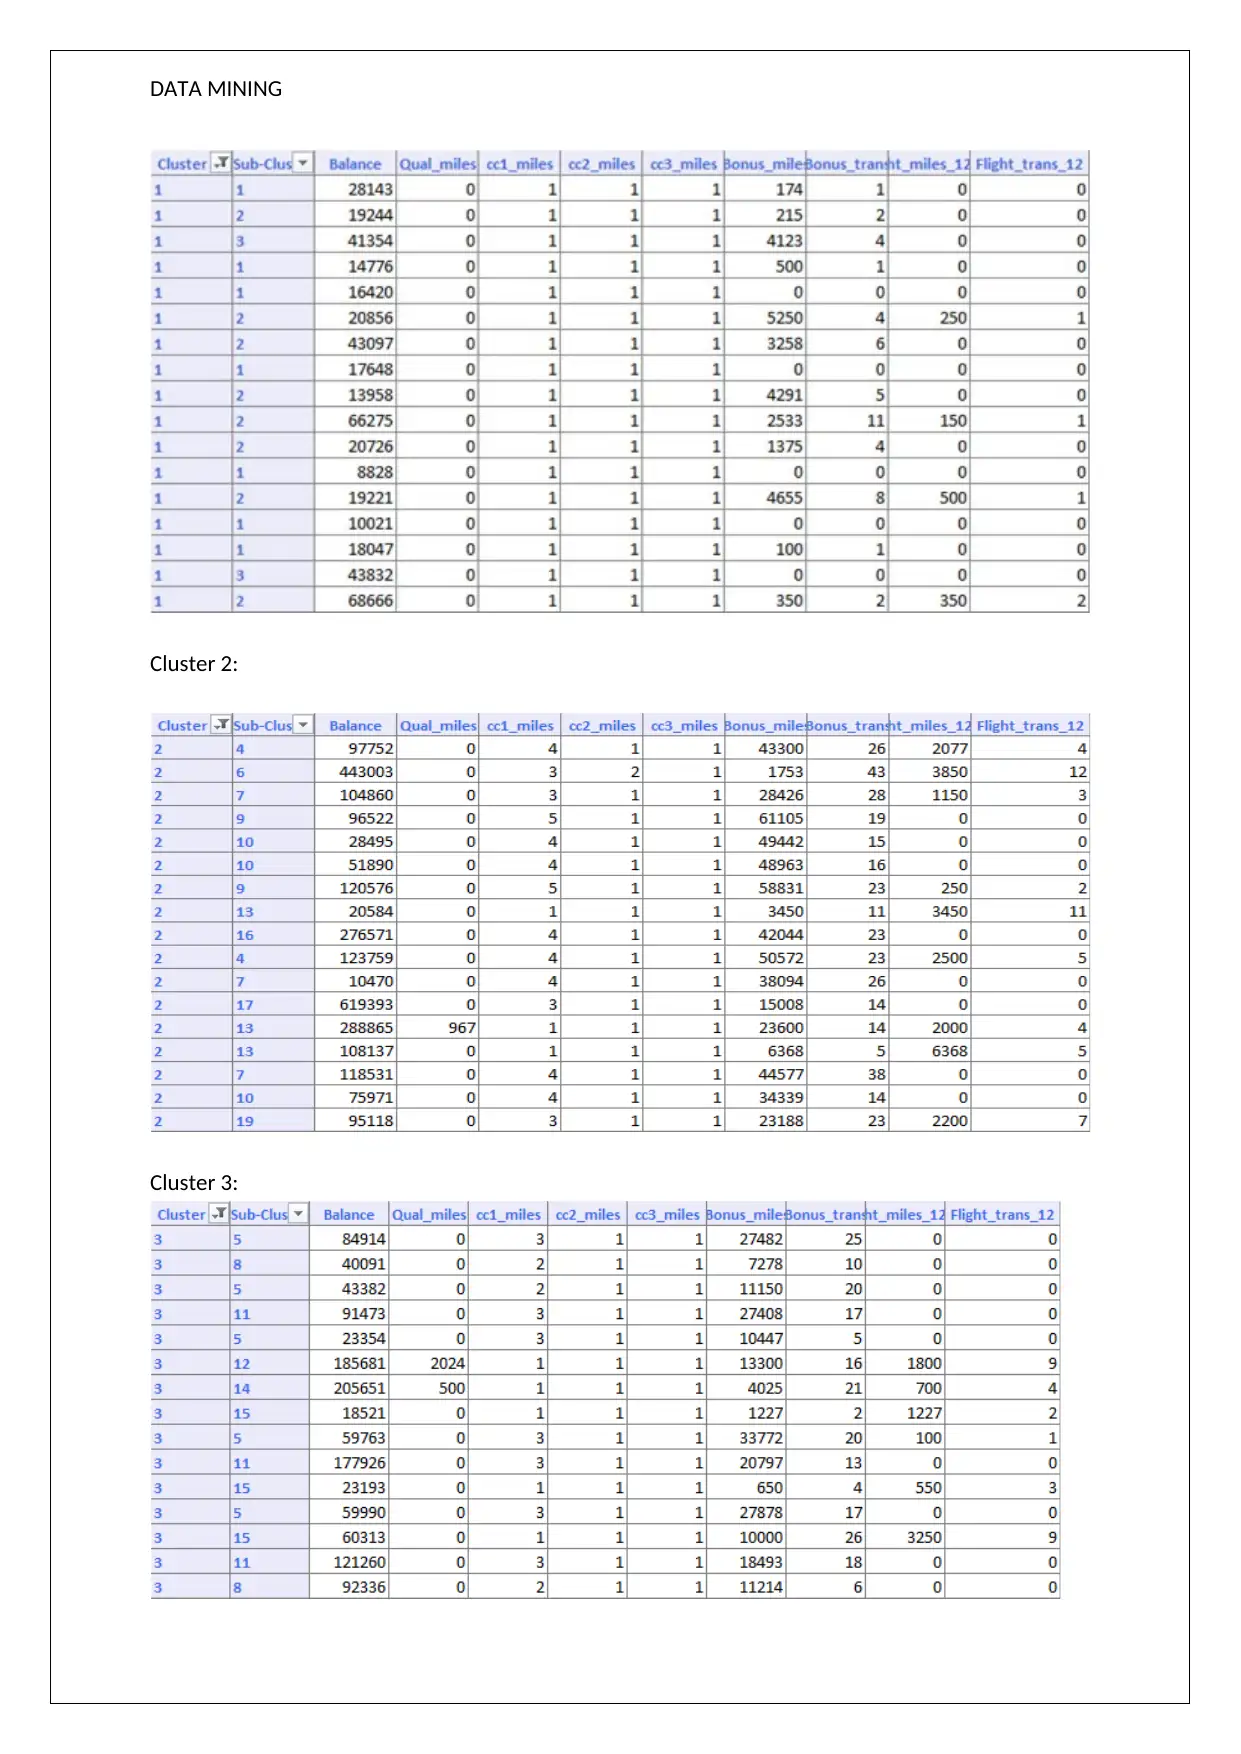
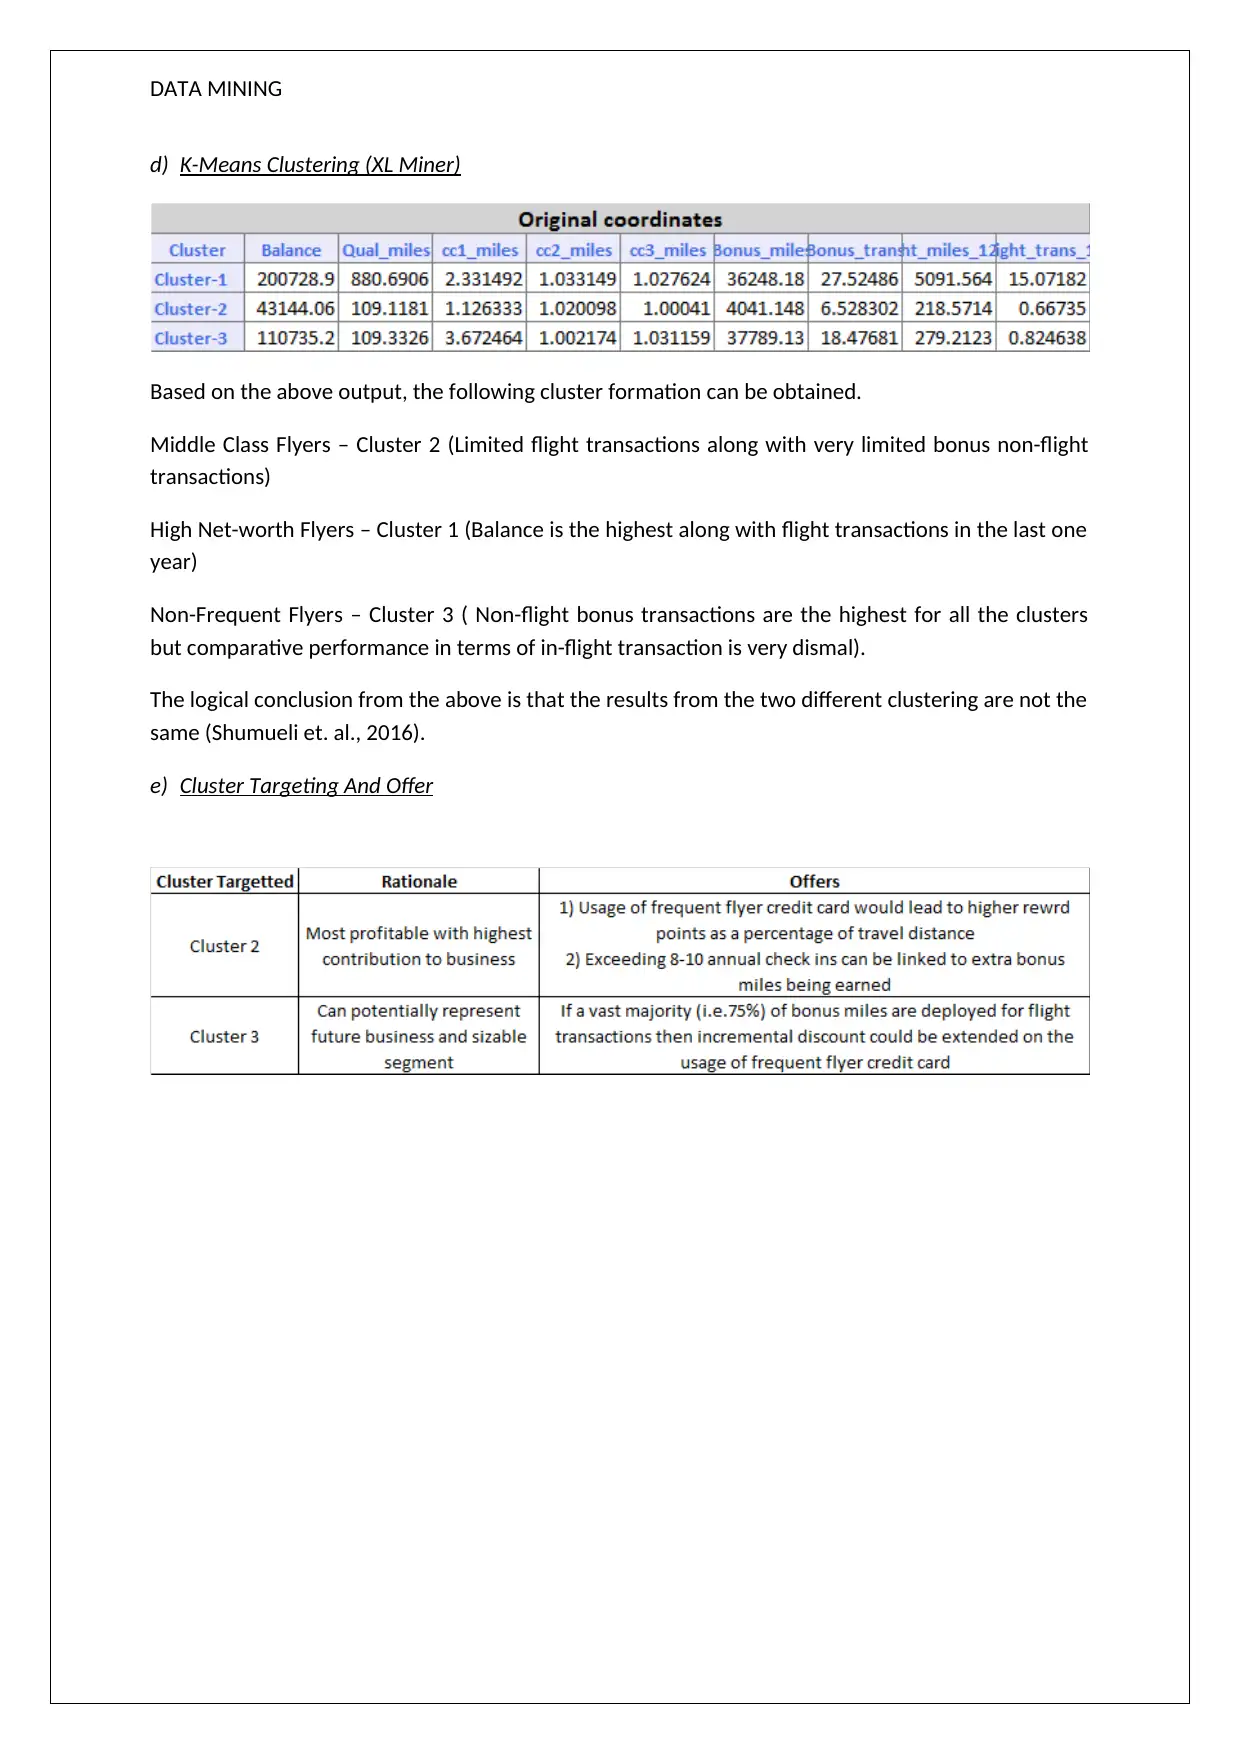
This data mining assignment solution analyzes XL Miner output to understand customer behavior through association rules and clustering techniques. The assignment begins by examining association rules, highlighting the relationship between product purchases and their confidence levels. It then delves into hierarchical clustering, identifying clusters based on a dendrogram and discussing the importance of data normalization. The solution further explores K-Means clustering, categorizing customers into different segments based on flight and non-flight transactions. The analysis emphasizes that the results from the two different clustering methods may not be the same. The assignment concludes with a discussion on cluster targeting and offers, along with references to relevant literature.
Document Page
DATA MINING
STUDENT ID:
[Pick the date]
tabler-icon-diamond-filled.svg

Paraphrase This Document

Need a fresh take? Get an instant paraphrase of this document with our AI Paraphraser
Document Page
DATA MINING
Question 1
XL Miner Output
i) The various rules of association are listed above and are arranged in the decreasing order of life
ratio. The first three rules are highlighted below.
In accordance with rule 1, the brush purchase tends to be followed by the nail polish
purchase. The associated confidence level is 100%.
In accordance with rule 2, the nail polish purchase tends to be followed by the brush
purchase. The associated confidence level is 63.22%.
In accordance with rule 3, the nail polish purchase tends to be followed by the bronzer
purchase. The associated confidence level is 59.20%.
ii) By lowering the confidence interval, the first couple of dozen rules would be outlined.
Redundancy situation is observed for Rule 16 and Rule 17. Also a similar situation is noticeable in
Document Page
DATA MINING
case of Rule 2 when compared with Rule 1. However, the confidence interval in case of the
former is much lower (Ana, 2014).
These rules have significant utility as they tend to outline the customer behaviour in terms of
buying items. But this utility may only be assessed if the rules are considered as a whole rather
than considering them individually. Also, in this process due consideration needs to be paid to the
individual characteristics of the rules that are captured by namely two aspects support and
confidence (Abramowics, 2013).
iii) The number of rules outlined tends to be driven by the minimum confidence level that is selected
in the Xl Miner. If it is increased to 75%, then rules having lower than this would not be displayed.
Hence, essentially only one rule appears as output for this case. This is apparent from the output
attached.
However precaution is to be observed while increasing this level to very high limits as significant
rules may be omitted (Ragsdale, 2014).
Question 2
a) XL Miner Output
Document Page
DATA MINING
In line with the dendogram produced above, three major clusters are observable if the threshold
distance is selected as 1000 and a horizontal line is drawn.
b) If normalisation of data is not practiced, then potentially two issues can arise. The accuracy of the
computation of distance would be impaired because of higher weight being awarded to the
higher scale measure. Also, the measure would be dominated by the scale that is the largest and
hence normalisation becomes necessary (Shumueli et. al., 2016).
c) The cluster labelling is carried out below (Ana, 2014).
The above table has been drawn based on the following output for different clusters obtained
through hierarchical clustering.
Cluster 1:
tabler-icon-diamond-filled.svg

Paraphrase This Document

Need a fresh take? Get an instant paraphrase of this document with our AI Paraphraser
Document Page
DATA MINING
Cluster 2:
Cluster 3:
Document Page
DATA MINING
d) K-Means Clustering (XL Miner)
Based on the above output, the following cluster formation can be obtained.
Middle Class Flyers – Cluster 2 (Limited flight transactions along with very limited bonus non-flight
transactions)
High Net-worth Flyers – Cluster 1 (Balance is the highest along with flight transactions in the last one
year)
Non-Frequent Flyers – Cluster 3 ( Non-flight bonus transactions are the highest for all the clusters
but comparative performance in terms of in-flight transaction is very dismal).
The logical conclusion from the above is that the results from the two different clustering are not the
same (Shumueli et. al., 2016).
e) Cluster Targeting And Offer
Document Page
DATA MINING
References
Abramowics, W. (2013) Business Information Systems Workshops: BIS 2013 International
Workshops (5th ed.). New York: Springer.
Ragsdale, C. (2014) Spread sheet Modeling and Decision Analysis: A Practical Introduction to
Business Analytics (7th ed.). London: Cengage Learning.
Shumueli, G., Bruce, C.P., Yahav, I., Patel, R. N., Kenneth, C., & Lichtendahl, J. (2016) Data
Mining For Business Analytics: Concepts Techniques and Application (2nd ed.).London:
John Wiley & Sons.
Ana, A. (2014) Integration of Data Mining in Business Intelligence System (4th ed.). Sydney:
IGA Global
chevron_up_icon
1 out of 7
circle_padding
hide_on_mobile
zoom_out_icon
[object Object]