Data Mining Software Evaluation: Criteria, Tools, and Analysis
VerifiedAdded on 2022/09/18
|26
|7227
|34
Report
AI Summary
This report offers a comprehensive evaluation of data mining software, with a specific focus on SAS Enterprise Miner (EM) and SPSS. The report begins with an overview of Decision Tree (DT) induction, detailing the algorithm's benefits, limitations, and practical applications in business. It explains DT growth, pruning techniques, and the importance of addressing overfitting. The core of the report centers on the evaluation criteria for data mining software, including functionality, usability, performance, and ancillary support. The report then provides a description of the features of EM and SPSS, followed by a comparative analysis of both software in relation to the specified evaluation criteria. The report concludes by providing insights into the best data mining software and its selection based on the criteria discussed.

Running head: EVALUATION CRITERIA FOR DATA MINING SOFTWARES. 1
EVALUATION CRITERIA FOR DATA MINING SOFTWARES.
Student’s Name
Professor’s Name
Institutional Affiliation
Date Due
EVALUATION CRITERIA FOR DATA MINING SOFTWARES.
Student’s Name
Professor’s Name
Institutional Affiliation
Date Due
Paraphrase This Document
Need a fresh take? Get an instant paraphrase of this document with our AI Paraphraser
EVALUATION CRITERIA FOR DATA MINING SOFTWARES. 2
Executive summary
Powerful software tools are required for the application purposes of data mining algorithms. Data
mining is very sensitive; thus, it requires intensive effort in the selection and evaluation of the
software available. With the evolving technology, modifications have been done in many
software to meet the need of the user. It's a challenging task to settle on one or two data mining
tools that will satisfy you. Besides, the number of available software meant for data mining is on
the rise. One of the fields that heavily rely on data mining tools and software is statistics.
Statistics involves the collection of different variety of data. These data need to be simplified to
be interpreted. Complex statistical data are synthesized, analyzed, and interpreted using SAS
Enterprise Miners (EM) data mining software and Statistical Package for the Social Sciences
(SPSS). This data mining software has its strengths and weakness; therefore, they need to be
evaluated. The most effective data mining software evaluation criteria include but not limited to;
Performance, Functionality, Usability, and Ancillary support. These criteria for evaluation have
been adequately explained in this paper. SAS EM and SPSS heavily rely on Decision Tree (DTs)
algorithm to execute their statistical functions
EVALUATION CRITERIA FOR DATA MINING SOFTWARES. 3
Contents
Chapter 1: Introduction............................................................................................................................4
Objectives of the study..........................................................................................................................5
Limitations of the study........................................................................................................................5
Chapter 2: Overview of DT induction......................................................................................................6
Tree pruning..........................................................................................................................................8
Important DTs algorithm....................................................................................................................10
Chapter 3: Evaluation criteria................................................................................................................14
Functionality.........................................................................................................................................15
Ancillary task support...........................................................................................................................15
Usability................................................................................................................................................16
Performance.........................................................................................................................................17
Chapter 4: Description of the DT induction software...........................................................................18
EM features for Data mining process....................................................................................................18
Chapter 5: Description of SPSS.................................................................................................................20
The core functions of SPSS.................................................................................................................20
The benefits of using SPSS.....................................................................................................................21
Chapter 6: Comparative Analysis in terms of Relevant Criteria.........................................................22
Chapter 7: Conclusion.............................................................................................................................23
References................................................................................................................................................25
⊘ This is a preview!⊘
Do you want full access?
Subscribe today to unlock all pages.
Trusted by 1+ million students worldwide
EVALUATION CRITERIA FOR DATA MINING SOFTWARES. 4
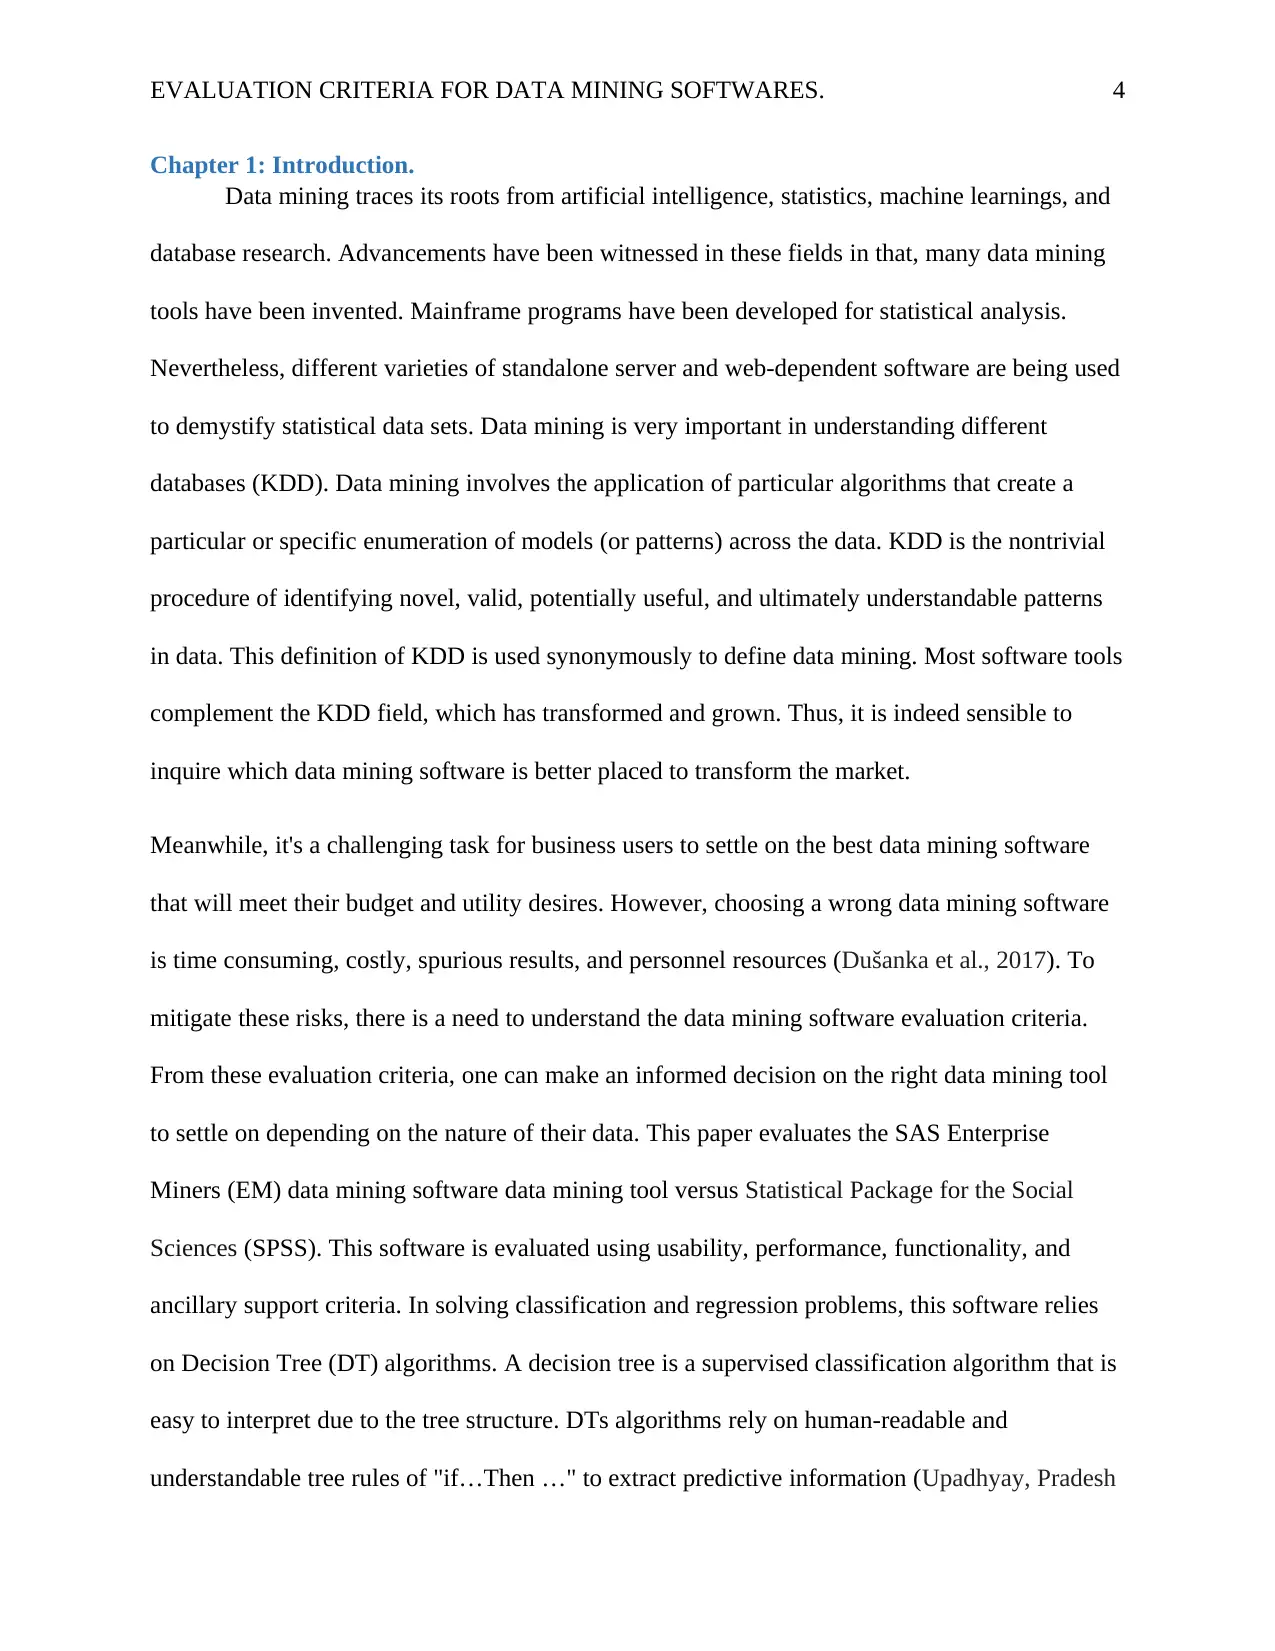
Chapter 1: Introduction.
Data mining traces its roots from artificial intelligence, statistics, machine learnings, and
database research. Advancements have been witnessed in these fields in that, many data mining
tools have been invented. Mainframe programs have been developed for statistical analysis.
Nevertheless, different varieties of standalone server and web-dependent software are being used
to demystify statistical data sets. Data mining is very important in understanding different
databases (KDD). Data mining involves the application of particular algorithms that create a
particular or specific enumeration of models (or patterns) across the data. KDD is the nontrivial
procedure of identifying novel, valid, potentially useful, and ultimately understandable patterns
in data. This definition of KDD is used synonymously to define data mining. Most software tools
complement the KDD field, which has transformed and grown. Thus, it is indeed sensible to
inquire which data mining software is better placed to transform the market.
Meanwhile, it's a challenging task for business users to settle on the best data mining software
that will meet their budget and utility desires. However, choosing a wrong data mining software
is time consuming, costly, spurious results, and personnel resources (Dušanka et al., 2017). To
mitigate these risks, there is a need to understand the data mining software evaluation criteria.
From these evaluation criteria, one can make an informed decision on the right data mining tool
to settle on depending on the nature of their data. This paper evaluates the SAS Enterprise
Miners (EM) data mining software data mining tool versus Statistical Package for the Social
Sciences (SPSS). This software is evaluated using usability, performance, functionality, and
ancillary support criteria. In solving classification and regression problems, this software relies
on Decision Tree (DT) algorithms. A decision tree is a supervised classification algorithm that is
easy to interpret due to the tree structure. DTs algorithms rely on human-readable and
understandable tree rules of "if…Then …" to extract predictive information (Upadhyay, Pradesh
Paraphrase This Document
Need a fresh take? Get an instant paraphrase of this document with our AI Paraphraser
EVALUATION CRITERIA FOR DATA MINING SOFTWARES. 5
& Verma, 2019). The DTs algorithms discussed in this paper include CART, C4.5, ID3, and
CHAID.
Objectives of the study
The main objectives of this paper include;
To describe the DT induction software
Evaluation of SAS EM and SPSS using different evaluation criteria
To provide an insight into the best data mining software.
The decision tree induction software covered in this paper are;
Statistical Package for the Social Sciences (SPSS)
SAS Enterprise Miners (EM) data mining software
Limitations of the study
The current study only highlights the evaluation criteria of data mining tools. Therefore,
it provides little information about the data mining software selection criteria.
The DT induction software discussed in this paper are SAS EM and SPSS; therefore,
little information is provided on the other software meant for Data mining
Chapter 2: Overview of DT induction
One of the most useful supervised learning algorithms is the Decision Tree (DT). In
supervised learning, the behavior to be predicted is already known as well as your existing data
is already labeled; this is different from unsupervised learning. Data is explored using algorithms
to find patterns in unsupervised learning since there are no output variables to guide the learning
process. DTs algorithms are used by business organizations in approximating customer lifetime
values plus their churn rates. Nevertheless, DTs algorithms are incorporated in the manufacture
of autonomous vehicles, which help in recognition of pedestrians (Quirynen, Berntorp &

EVALUATION CRITERIA FOR DATA MINING SOFTWARES. 6
Cairano, 2018). DTs algorithms constantly divide data into smaller subsets based on
characteristic features, until they achieve sets that are small enough to be described by some
label. DT algorithms are perfect in solving regression (where values are predicted, for instance,
property prices by machines) and classification (where data are being sorted into classes, for
instance, showing whether an email is a spam or not) problems. Regression trees are utilized
when the targeted variable is continuous or quantitative (for instance, if we want to predict the
probability of experiencing rainfall). Whereas, when the dependent variable is qualitative and
categorical classification trees are used. For instance, if a doctor wants to investigate the blood
group of a patient, a classification tree is the most appropriate. DTs have many applications in
the real world, making them very important. Furthermore, DTs algorithms are mostly used in
ML. Further, they have relevant applications in several industries.
DTs algorithms are used in the early detection of cognitive impairments in the medicine
industry (Su et al., 2019). Besides, they also predict possible development of dementia in
the coming days.
DTs algorithms are used in the manufacture of Chatbots that have revolutionized the
healthcare sector. They gather information from patients through friendly chats.
Nevertheless, Chatbots have completely transformed the customer care sector. Internet
platforms as Google and Amazon are acquiring Chatbots to help them manage their
customer care services (Ikedinachi et al., 2019).
DTs are trained to recognize different causes of forest loss from satellite imagery. They
can be used to predict the possible causes of forest destructors as wildfires, large or small
scale agriculture, logging of tree plantations, and urbanization (Srivastava et al., 2019).
⊘ This is a preview!⊘
Do you want full access?
Subscribe today to unlock all pages.
Trusted by 1+ million students worldwide
EVALUATION CRITERIA FOR DATA MINING SOFTWARES. 7
The organization learns about customers' decision drivers and choices through sentiment
analysis that is conducted by DTs algorithms.
In dealing with invasive species, DTs algorithms help in establishing the best strategy.
DTs algorithms have also enhanced financial fraud detection. This is done by tracing
patterns of credit cards and transactions that rhyme with cases of fraud.
DTs are easy to understand and interpret; this has made them very popular not only in science
but also in the business environment (Ramesh, Rajinikanth & Vasumathi, 2017). Moreover, their
application has expanded to civil areas.
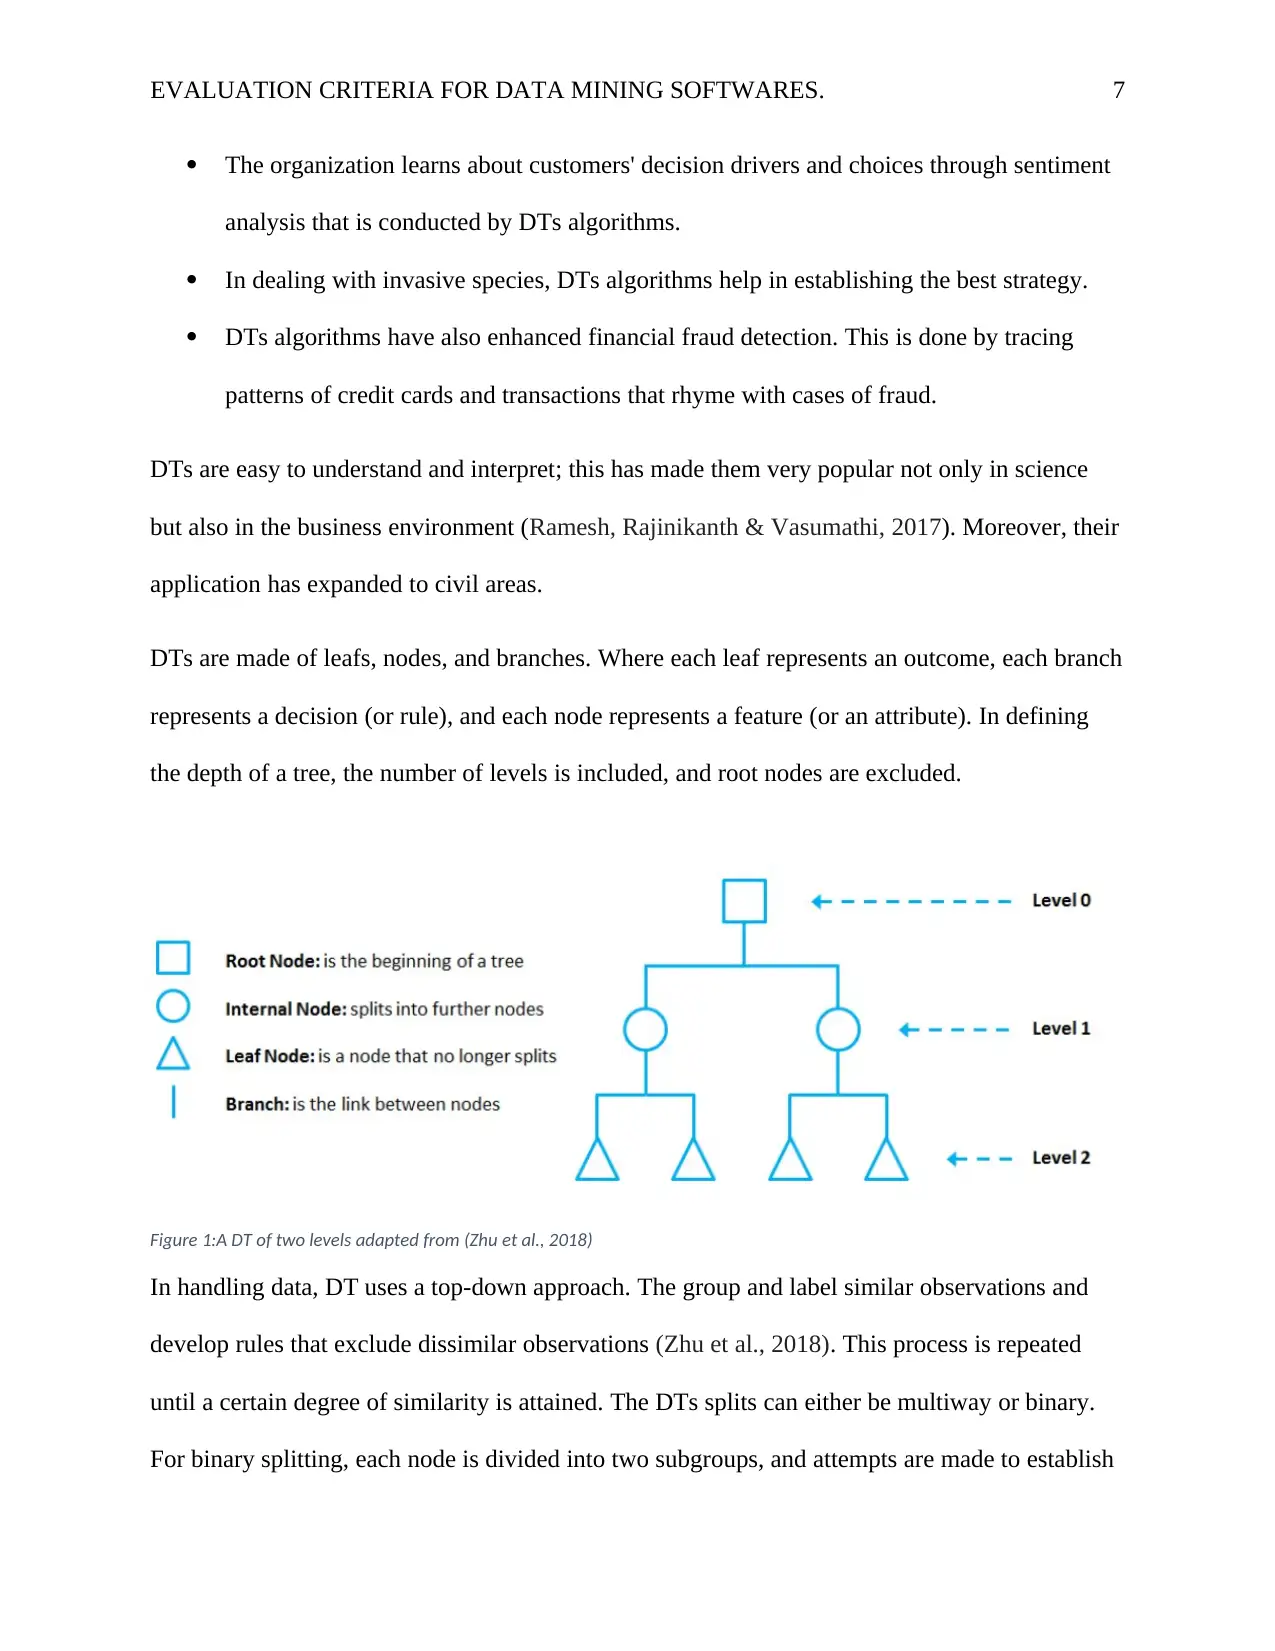
DTs are made of leafs, nodes, and branches. Where each leaf represents an outcome, each branch
represents a decision (or rule), and each node represents a feature (or an attribute). In defining
the depth of a tree, the number of levels is included, and root nodes are excluded.
Figure 1:A DT of two levels adapted from (Zhu et al., 2018)
In handling data, DT uses a top-down approach. The group and label similar observations and
develop rules that exclude dissimilar observations (Zhu et al., 2018). This process is repeated
until a certain degree of similarity is attained. The DTs splits can either be multiway or binary.
For binary splitting, each node is divided into two subgroups, and attempts are made to establish
The organization learns about customers' decision drivers and choices through sentiment
analysis that is conducted by DTs algorithms.
In dealing with invasive species, DTs algorithms help in establishing the best strategy.
DTs algorithms have also enhanced financial fraud detection. This is done by tracing
patterns of credit cards and transactions that rhyme with cases of fraud.
DTs are easy to understand and interpret; this has made them very popular not only in science
but also in the business environment (Ramesh, Rajinikanth & Vasumathi, 2017). Moreover, their
application has expanded to civil areas.
DTs are made of leafs, nodes, and branches. Where each leaf represents an outcome, each branch
represents a decision (or rule), and each node represents a feature (or an attribute). In defining
the depth of a tree, the number of levels is included, and root nodes are excluded.
Figure 1:A DT of two levels adapted from (Zhu et al., 2018)
In handling data, DT uses a top-down approach. The group and label similar observations and
develop rules that exclude dissimilar observations (Zhu et al., 2018). This process is repeated
until a certain degree of similarity is attained. The DTs splits can either be multiway or binary.
For binary splitting, each node is divided into two subgroups, and attempts are made to establish
Paraphrase This Document
Need a fresh take? Get an instant paraphrase of this document with our AI Paraphraser
EVALUATION CRITERIA FOR DATA MINING SOFTWARES. 8
the optimal portioning. Whereas for multiway splitting, nodes are divided into multiple
subgroups using as many partitions as per the existing distinct values. Multiway splitting has
notable advantages over binary splitting. This is because all the information is exhausted in a
nominal attribute in multiway splits. This is not true for binary splits.
Tree pruning
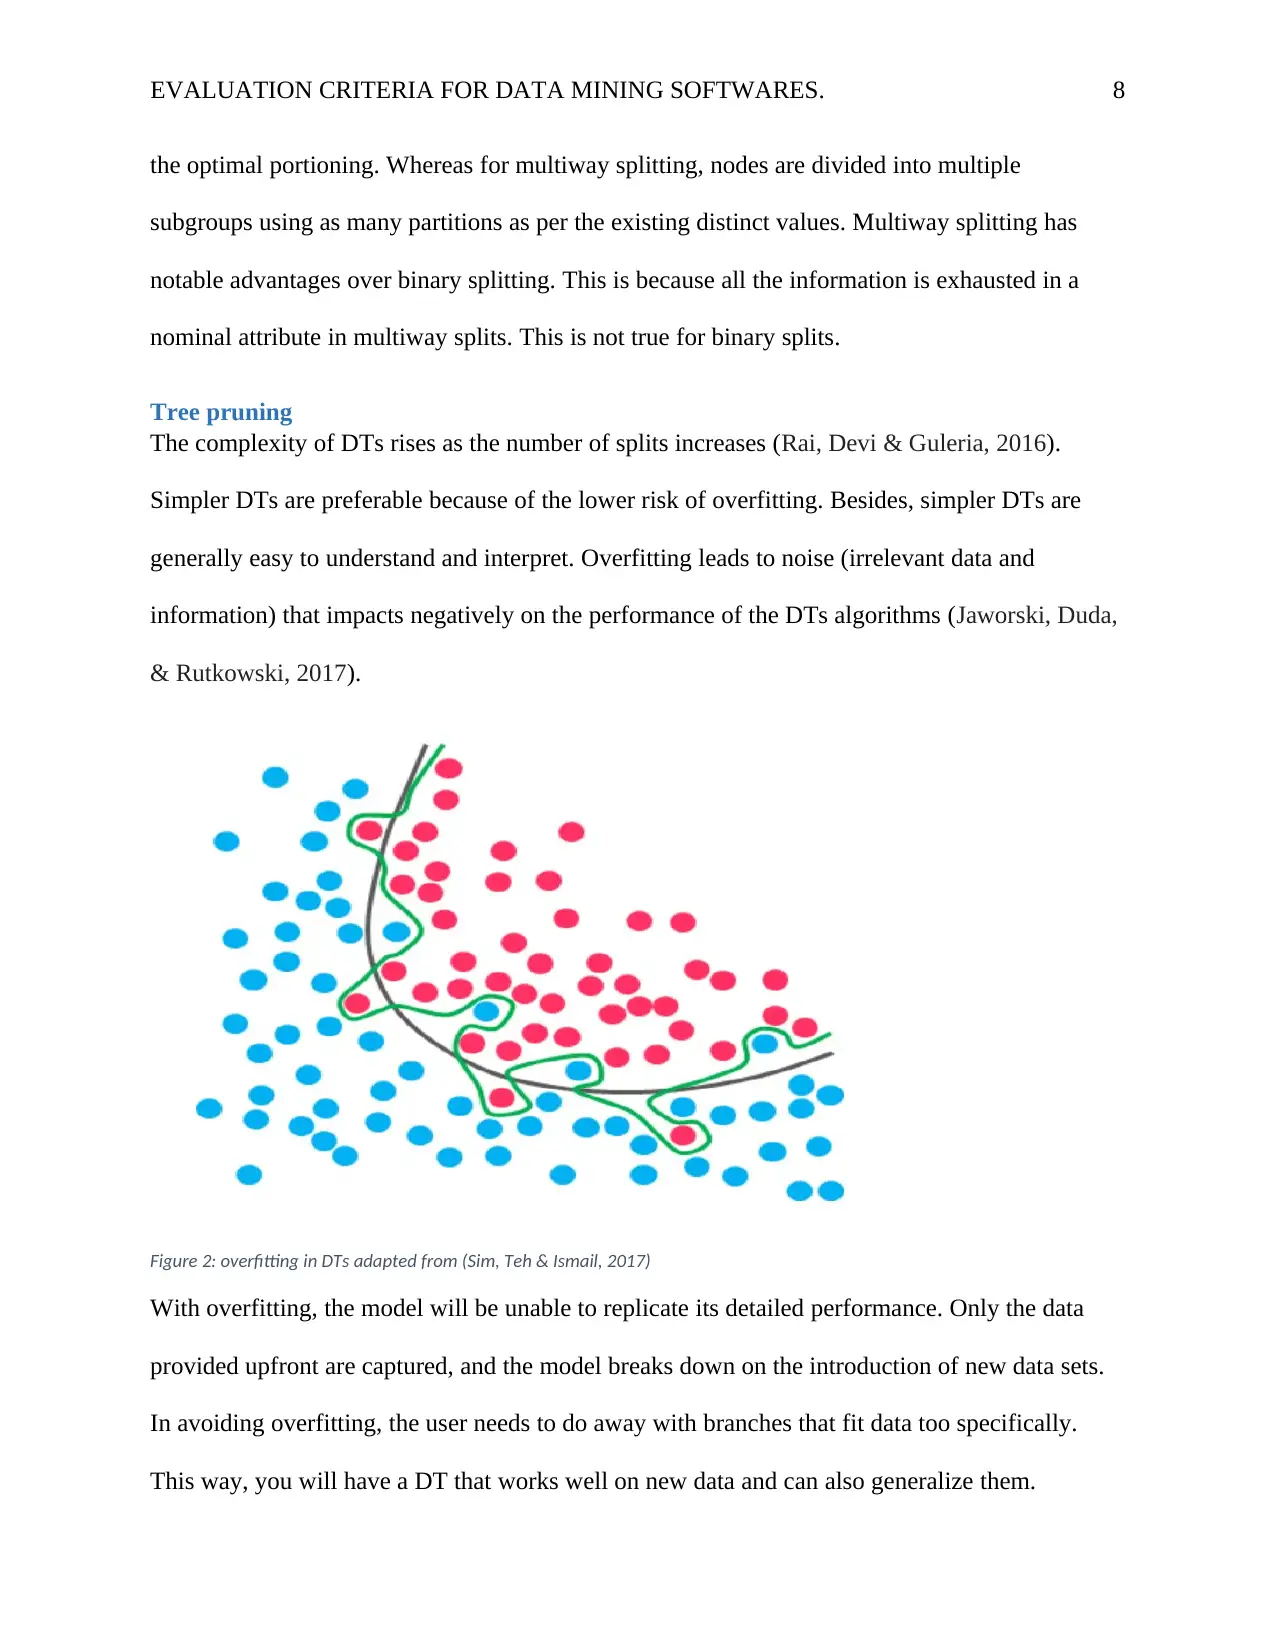
The complexity of DTs rises as the number of splits increases (Rai, Devi & Guleria, 2016).
Simpler DTs are preferable because of the lower risk of overfitting. Besides, simpler DTs are
generally easy to understand and interpret. Overfitting leads to noise (irrelevant data and
information) that impacts negatively on the performance of the DTs algorithms (Jaworski, Duda,
& Rutkowski, 2017).
Figure 2: overfitting in DTs adapted from (Sim, Teh & Ismail, 2017)
With overfitting, the model will be unable to replicate its detailed performance. Only the data
provided upfront are captured, and the model breaks down on the introduction of new data sets.
In avoiding overfitting, the user needs to do away with branches that fit data too specifically.
This way, you will have a DT that works well on new data and can also generalize them.
the optimal portioning. Whereas for multiway splitting, nodes are divided into multiple
subgroups using as many partitions as per the existing distinct values. Multiway splitting has
notable advantages over binary splitting. This is because all the information is exhausted in a
nominal attribute in multiway splits. This is not true for binary splits.
Tree pruning
The complexity of DTs rises as the number of splits increases (Rai, Devi & Guleria, 2016).
Simpler DTs are preferable because of the lower risk of overfitting. Besides, simpler DTs are
generally easy to understand and interpret. Overfitting leads to noise (irrelevant data and
information) that impacts negatively on the performance of the DTs algorithms (Jaworski, Duda,
& Rutkowski, 2017).
Figure 2: overfitting in DTs adapted from (Sim, Teh & Ismail, 2017)
With overfitting, the model will be unable to replicate its detailed performance. Only the data
provided upfront are captured, and the model breaks down on the introduction of new data sets.
In avoiding overfitting, the user needs to do away with branches that fit data too specifically.
This way, you will have a DT that works well on new data and can also generalize them.
EVALUATION CRITERIA FOR DATA MINING SOFTWARES. 9
Although this puts you at risk of losing precision on the training data. In eliminating overfitting,
you need a technique called pruning. Pruning eliminates sections of the tree that give little
classification or predictive power. By doing this, pruning reduces the size of the DTs (Sim, Teh
& Ismail, 2017). Pruning aims to eliminate noise and improves the accuracy of the DTs. Pruning
on DTs can be done using two different strategies;
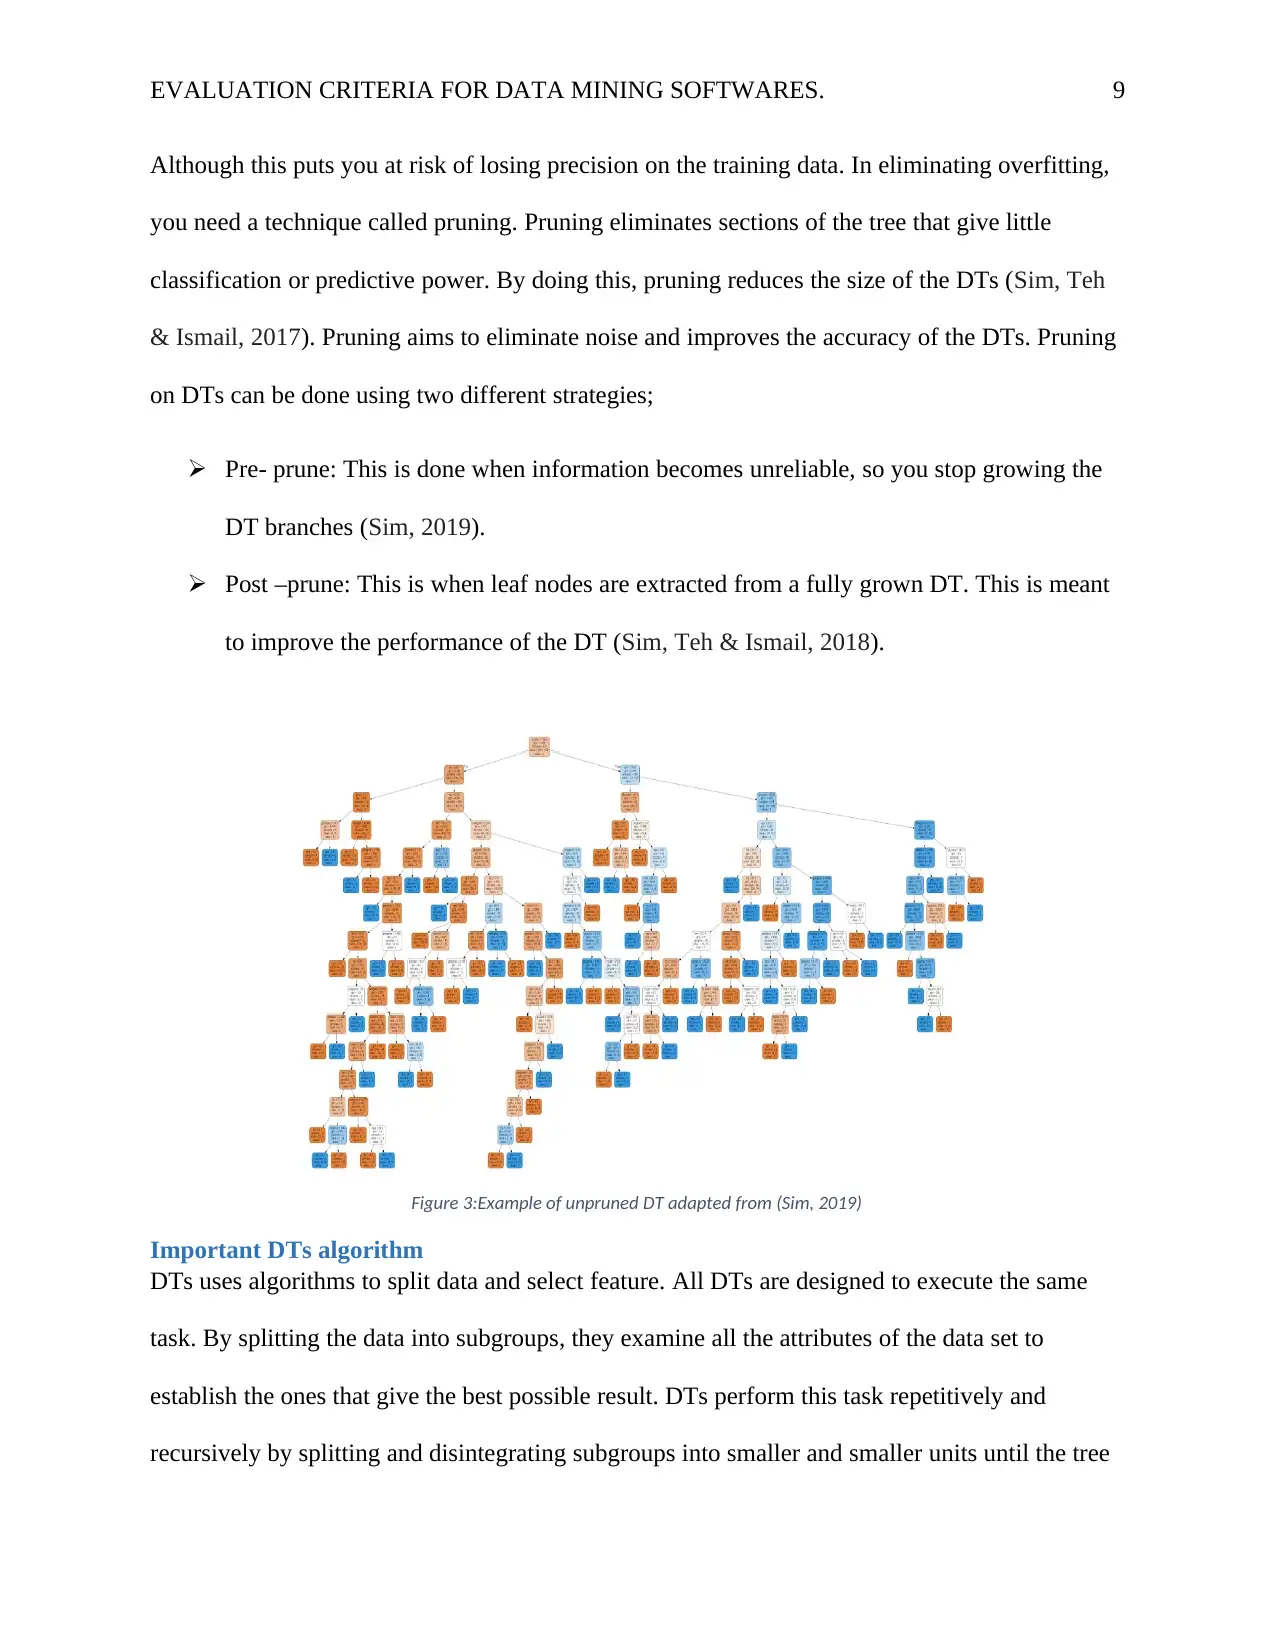
Pre- prune: This is done when information becomes unreliable, so you stop growing the
DT branches (Sim, 2019).
Post –prune: This is when leaf nodes are extracted from a fully grown DT. This is meant
to improve the performance of the DT (Sim, Teh & Ismail, 2018).
Figure 3:Example of unpruned DT adapted from (Sim, 2019)
Important DTs algorithm
DTs uses algorithms to split data and select feature. All DTs are designed to execute the same
task. By splitting the data into subgroups, they examine all the attributes of the data set to
establish the ones that give the best possible result. DTs perform this task repetitively and
recursively by splitting and disintegrating subgroups into smaller and smaller units until the tree
Although this puts you at risk of losing precision on the training data. In eliminating overfitting,
you need a technique called pruning. Pruning eliminates sections of the tree that give little
classification or predictive power. By doing this, pruning reduces the size of the DTs (Sim, Teh
& Ismail, 2017). Pruning aims to eliminate noise and improves the accuracy of the DTs. Pruning
on DTs can be done using two different strategies;
Pre- prune: This is done when information becomes unreliable, so you stop growing the
DT branches (Sim, 2019).
Post –prune: This is when leaf nodes are extracted from a fully grown DT. This is meant
to improve the performance of the DT (Sim, Teh & Ismail, 2018).
Figure 3:Example of unpruned DT adapted from (Sim, 2019)
Important DTs algorithm
DTs uses algorithms to split data and select feature. All DTs are designed to execute the same
task. By splitting the data into subgroups, they examine all the attributes of the data set to
establish the ones that give the best possible result. DTs perform this task repetitively and
recursively by splitting and disintegrating subgroups into smaller and smaller units until the tree
⊘ This is a preview!⊘
Do you want full access?
Subscribe today to unlock all pages.
Trusted by 1+ million students worldwide
EVALUATION CRITERIA FOR DATA MINING SOFTWARES. 10
is exhausted. The splitting process heavily impacts negatively on the tree accuracy and
performance to manage this. DTs can employ different algorithms that differ in the possible
outlook of the tree, for instance, the number of fragmentations per node, when to terminate
splitting, and strategy on how to conduct the splitting. In understanding the attribute to split and
their splitting criteria, insight must be created on the main DTs algorithms
CHAID
One of the ancient DT algorithms methods is the Chi-Squared automatic interaction
detection (CHAID). This algorithm produces multiway DTs (splits of more than two branches)
appropriate for regression and classification tasks. A classification tree is constructed when the
dependent variable is categorical. Besides building classification trees, Chi-square independent
variable forms the basis on which CHAID determines the best split at each step (Akin, Eyduran
& Reed, 2017). Chi-square tests investigate the relationship between two variables and are
utilized at each step to ensure that each branch is significantly related to a statistically significant
predictor of the response variable. In other terms, it settles for the independent variable that
strongly interacts with the dependent variable. Furthermore, if there is no significant difference
between each predictor categories, they are merged concerning the dependent variable.
For the regression trees, the dependent variable is continuous. Here instead of chi-square,
CHAID relies on F-test to find the difference between two population means. A new partition
(child node) is created if the F-test is significant. This means that the child node partition is
statistically dissimilar from the parent node. On the other hand, the categories will be merged
into a single node if the outcomes of the F- tests between target means are not significant.
Missing values are not replaced by CHAID; instead, they are handled as a single class, which can
be merged with other classes if need be. CHAID has no pruning function (Erener, Mutlu &
Paraphrase This Document
Need a fresh take? Get an instant paraphrase of this document with our AI Paraphraser
EVALUATION CRITERIA FOR DATA MINING SOFTWARES. 11
Düzgün, 2016). Additionally, it produces DTs with multiway characteristics meaning the DTs
tend to be wider rather than deeper. These make them hard and short to apply to real business
conditions. Although CHAID is not the most powerful since it finds it hard to detect the smallest
differences. Also, CHAID is not the fastest DT algorithm. On the contrary, CHAID is flexible,
easy to manage, and can be very powerful.
CART
This is a DT algorithm that produces regression trees or binary classifications. The
production of binary classification or regression tree depends on whether the target (or
dependent) variable is categorical or numeric, respectively. It handles unprocessed (raw) data
and can utilize the same variable more than once in different parts of the same DT. This is a way
of revealing complex interdependencies between sets of variables.
CART algorithm relies on a metric named Gini Impunity to come up with decision points
for classification tasks in the case of classification trees. By how mixed the classes are in the two
groups created by the split, Gini Impurity gives an idea of how fine a split is. There is a perfect
classification when all observations belong to the same label and a Gini Impunity value of 0 (Lin
& Luo, 2019). 0 is the minimum Gini Impunity value. However, we face the worst-case split
when all observations are equally distributed among different labels. In this case, the maximum
Gini Impunity value of 1 is given.
CART algorithms use splits that minimizes Least Square Deviation (LSD) in the case of
regression trees. Besides, the partitions chosen are those that minimize results over all possible
options. Between the predicted and observed value, the least square deviation (LSD) metric
minimizes the sum of the squared distances. Residual is the name assigned to the difference
between the predicted and observed values. Therefore, LSD selects the parameter estimates to
EVALUATION CRITERIA FOR DATA MINING SOFTWARES. 12
minimize the sum of the squared residuals. LSD can accurately capture more information on the
quality of the split as compared to other algorithms (Fong, Biuk-Aghai & Millham, 2018).
Besides, LSD is well suited for metric data. The production of a sequence of DTs, each of which
is a candidate to be an optimal tree, is the main idea behind the CART algorithm. By evaluating
the performance of every tree through testing the optimal tree is identified. Testing involves the
use of new data sets, not known by the DT. Also, the optimal tree can be identified by
performing cross-validation. Cross-validation involves subdividing the datasets into "n" number
of folds and perform tests on each fold.
For tree selection, CART doesn't rely on an integral performance measure. Instead, it uses
cross-validation or testing to measure DTs' performances. Only after these evaluations are done,
can the tree selection proceed.
ID3
This is a DT algorithm that is majorly used in the production of classification trees. The
Iterative dichotomize 3 (ID3) is not effective in building regression trees; thus, it is mainly used
in classification tasks. Although a technique like building a numerical interval can improve ID3
performance on regression trees. ID3 dichotomizes (splits data attributes) to establish the most
dominant features (Wei-ming & Yu, 2018). This procedure is performed iteratively in a top-
down approach to choose the DT nodes. In the selection for the most useful attribute, for
classification, ID3 uses the information gain metric. The information gains metric measures the
amount of information a feature gives about a class. ID3 maximizes this metric by splitting first
the attribute with the highest information gain. Information gain is interlinked with the entropy
concept, which measures the amount of randomness or uncertainties in the data (Yang, Guo &
⊘ This is a preview!⊘
Do you want full access?
Subscribe today to unlock all pages.
Trusted by 1+ million students worldwide
1 out of 26
Your All-in-One AI-Powered Toolkit for Academic Success.
+13062052269
info@desklib.com
Available 24*7 on WhatsApp / Email
![[object Object]](/_next/static/media/star-bottom.7253800d.svg)
Unlock your academic potential
Copyright © 2020–2026 A2Z Services. All Rights Reserved. Developed and managed by ZUCOL.