Data Mining Assignment: Universal Bank and Customer Analysis
VerifiedAdded on 2020/04/07
|10
|1148
|43
Homework Assignment
AI Summary
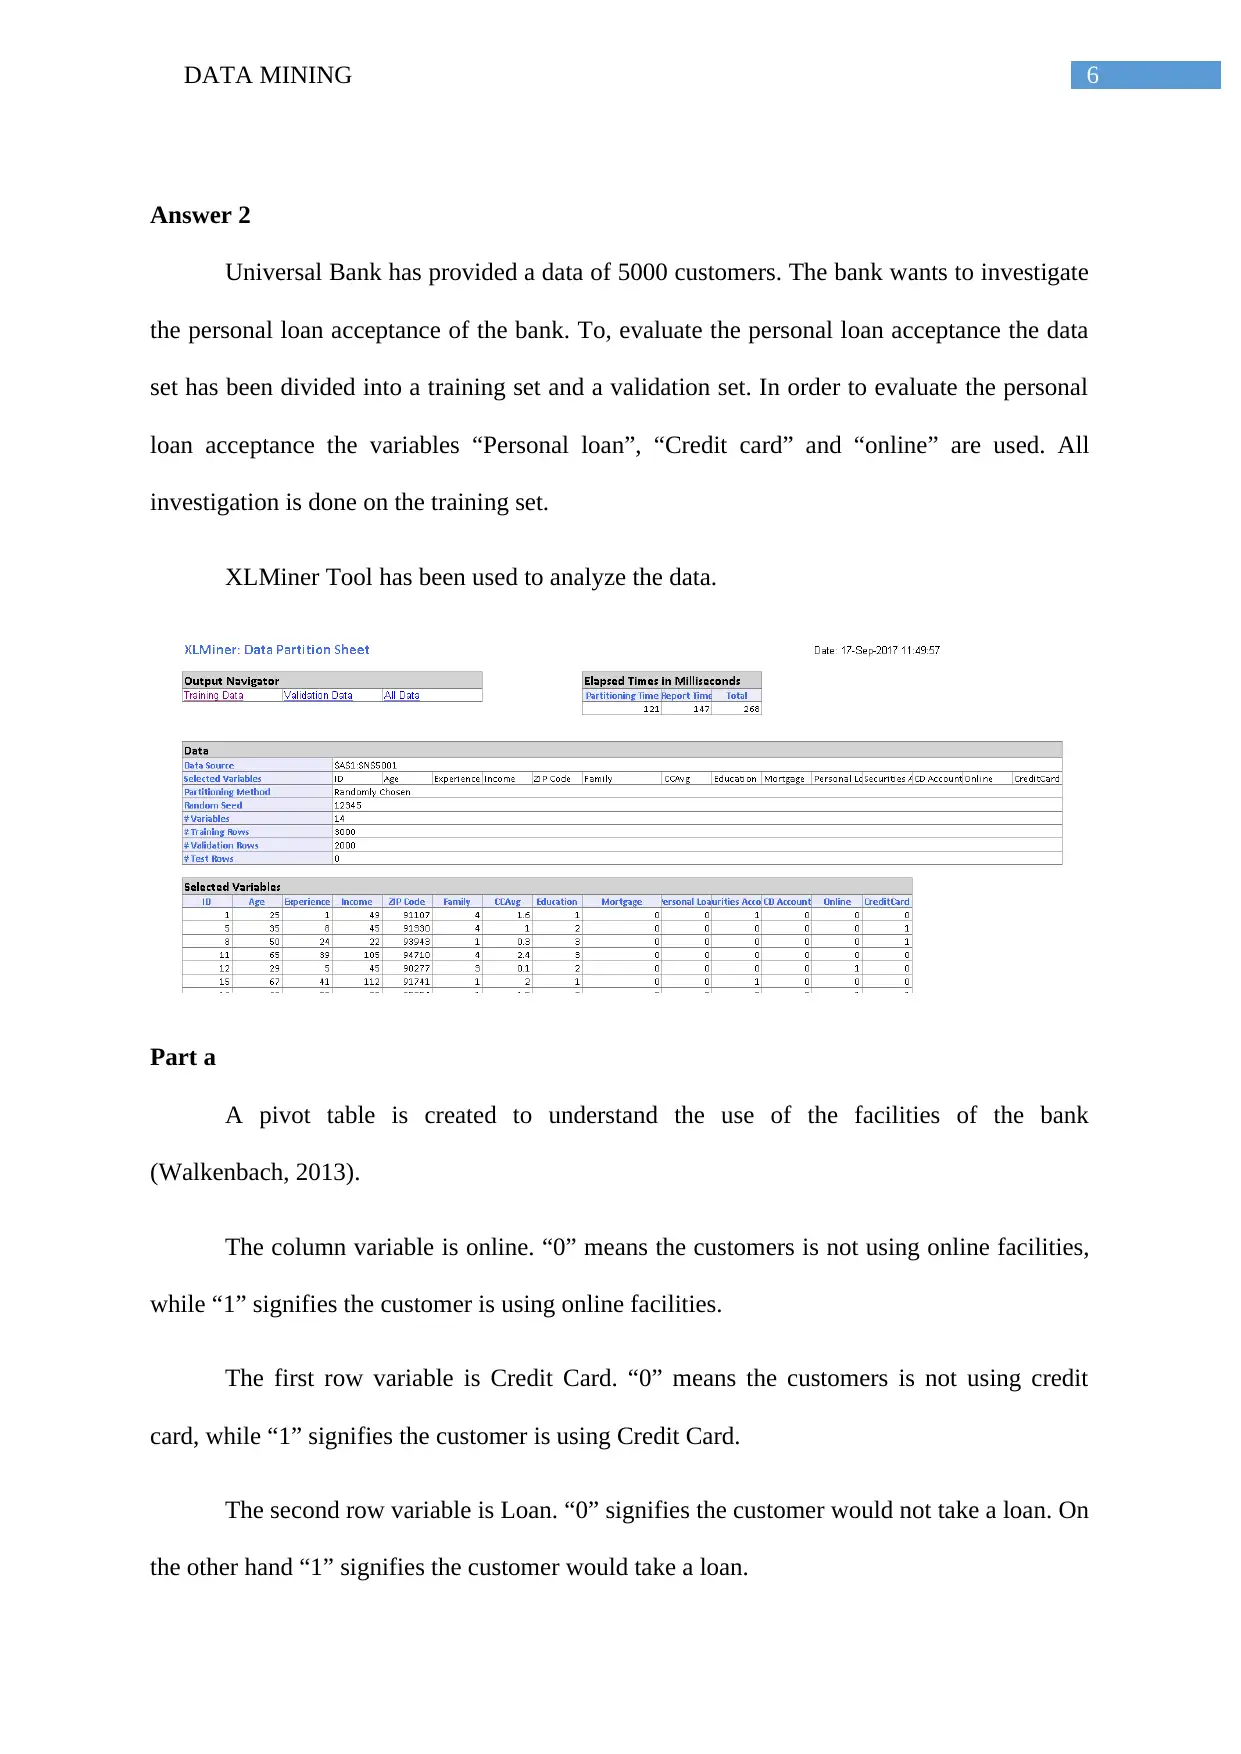
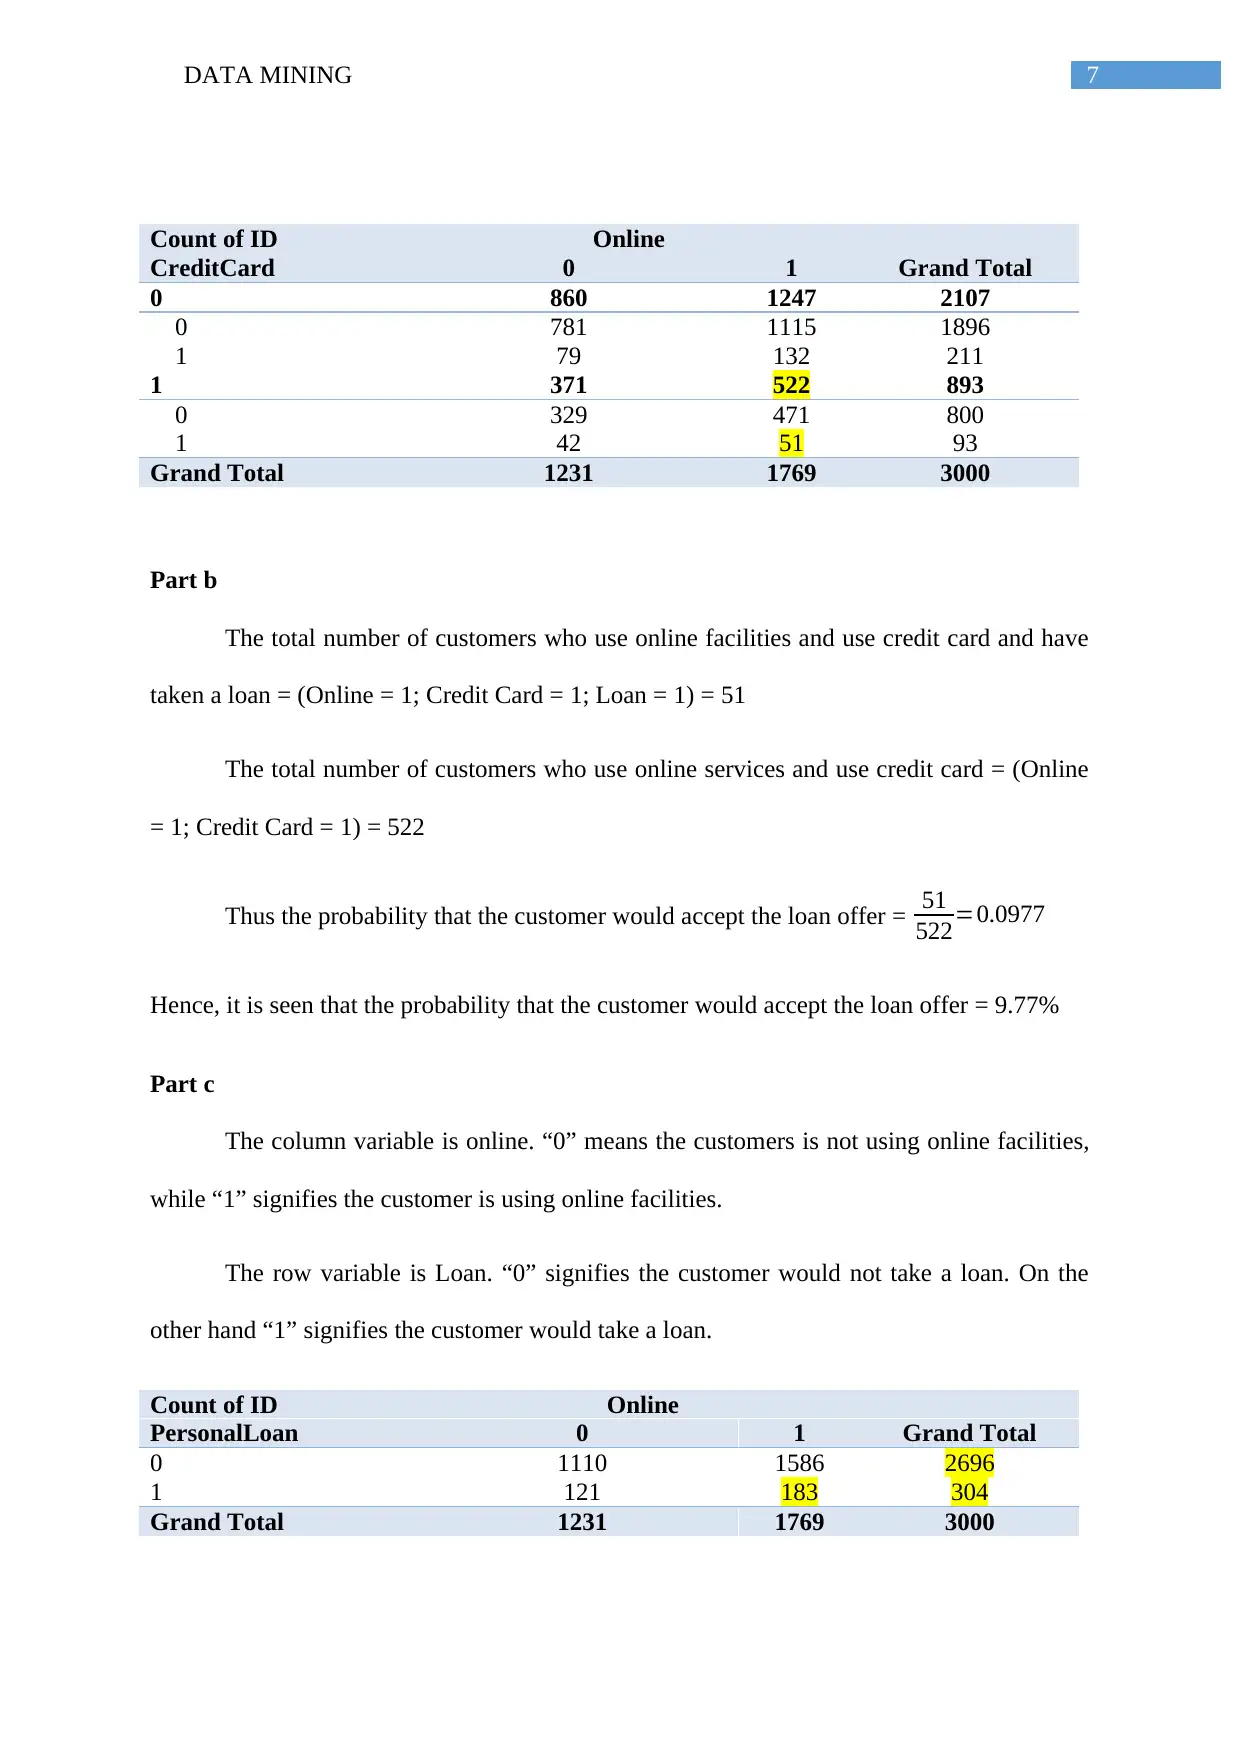
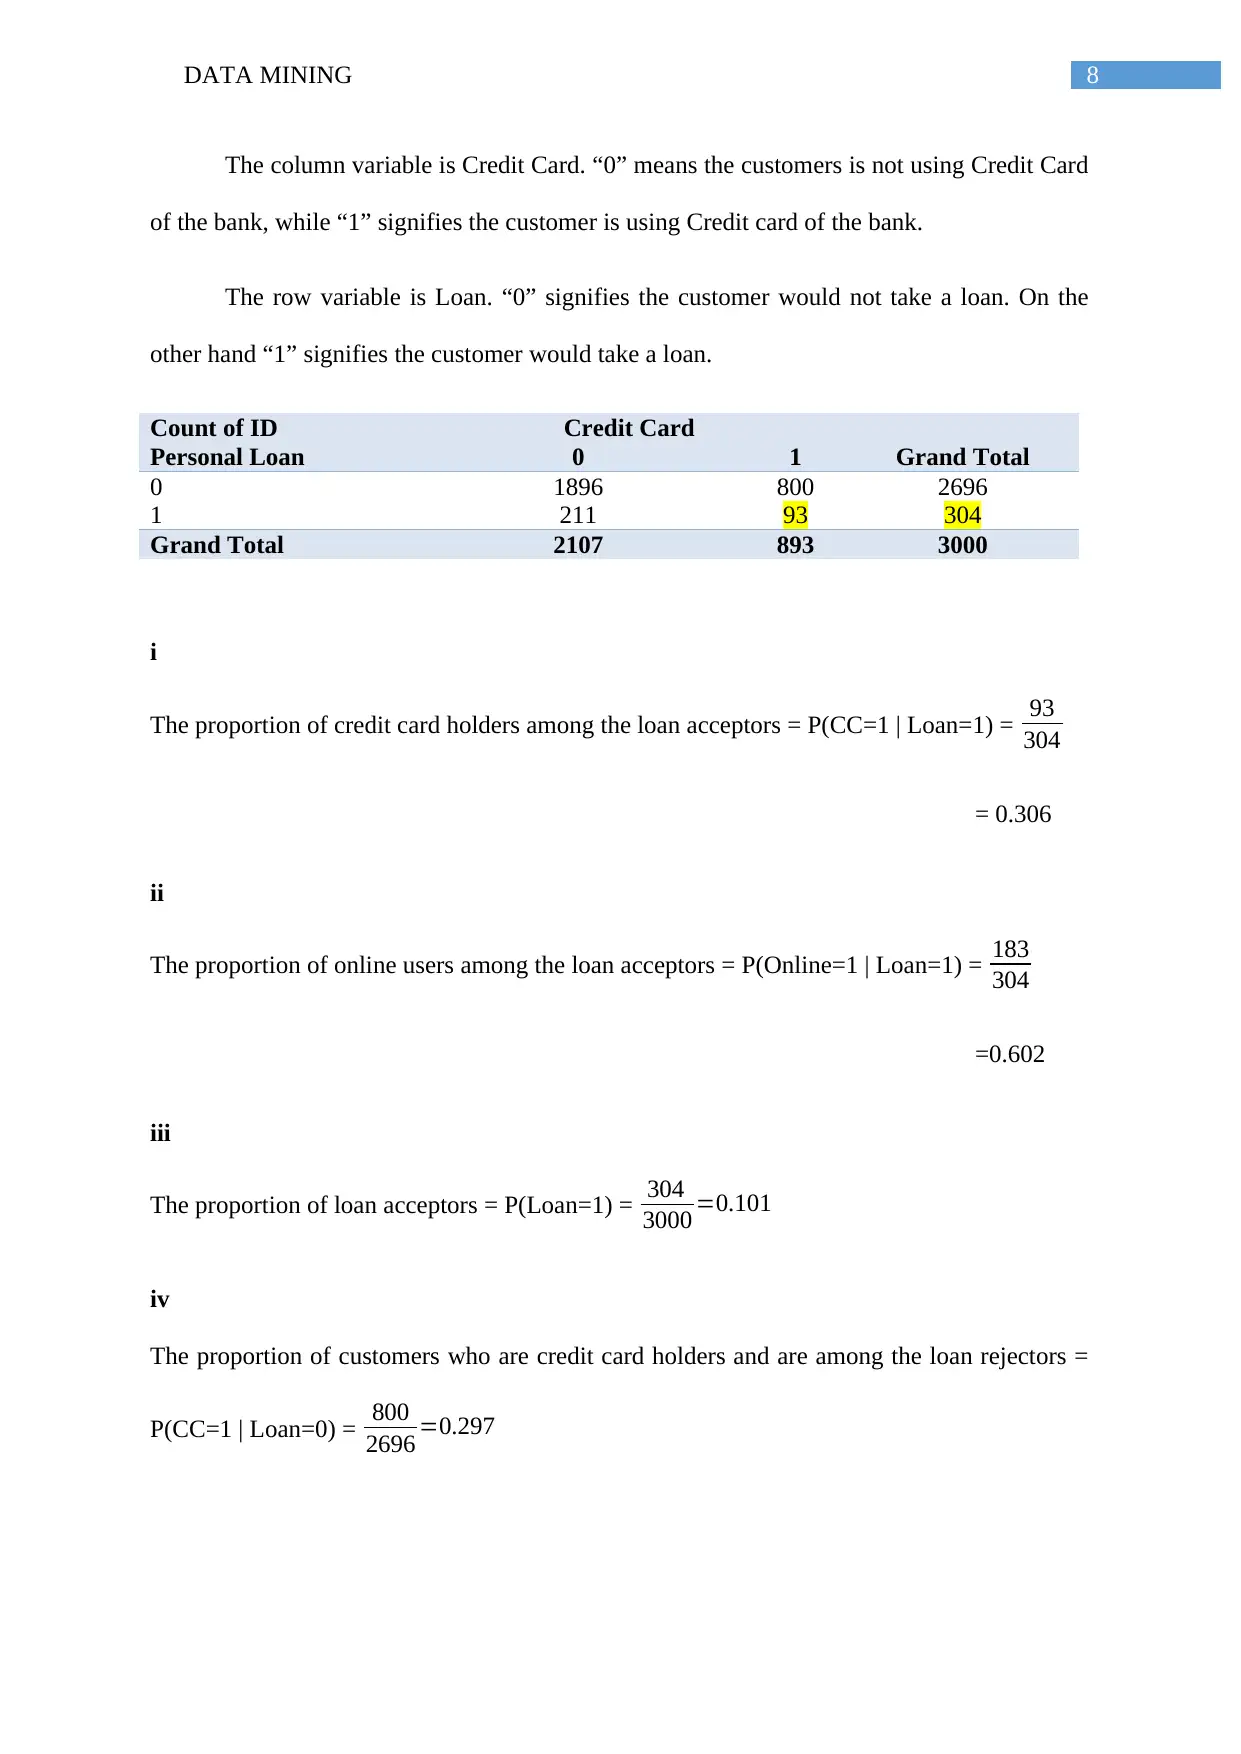
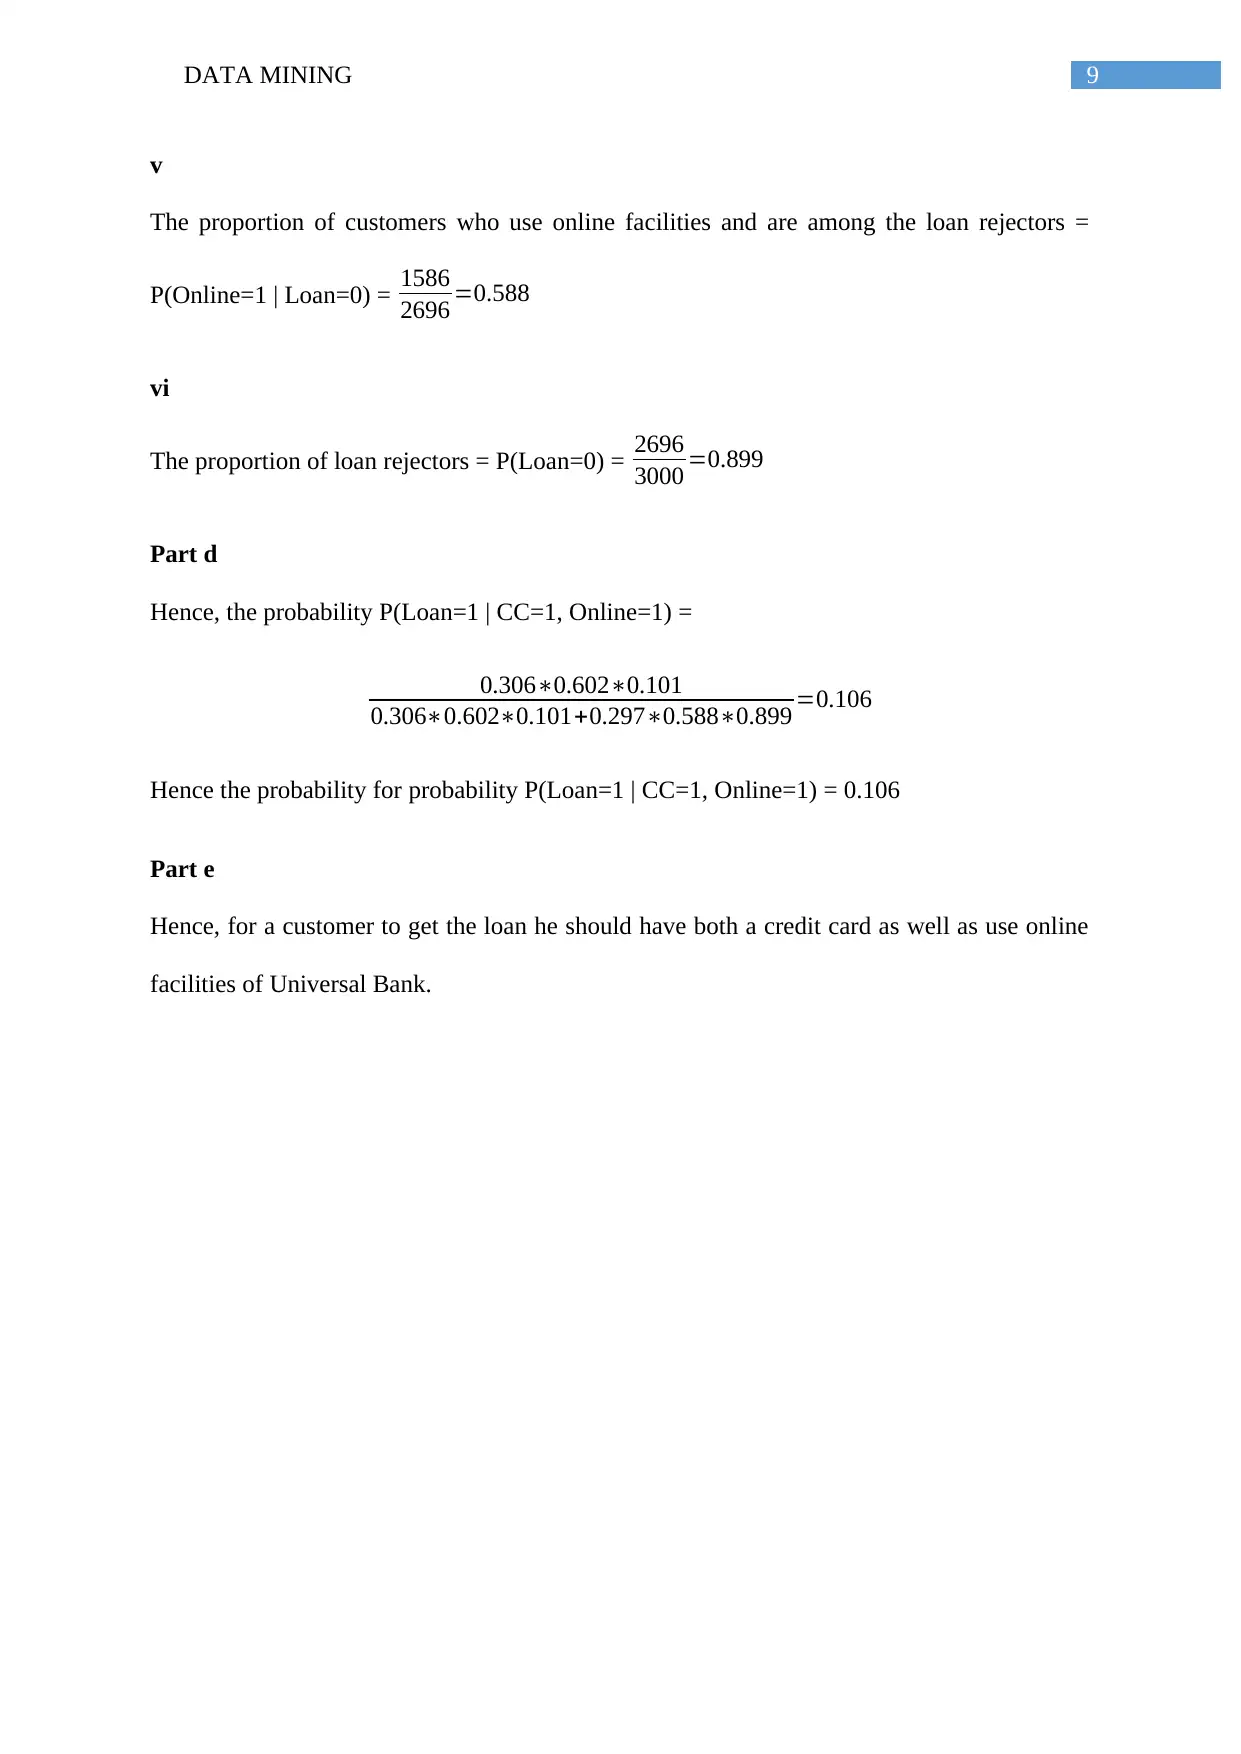
This data mining assignment analyzes data from Universal Bank using PCA (Principal Component Analysis) and pivot tables to assess customer behavior regarding loan acceptance. The first part of the assignment focuses on PCA, identifying key components like financial and operational performance of utilities, and discussing the need for data normalization. The second part involves analyzing customer data to evaluate personal loan acceptance, using variables like 'Personal loan', 'Credit card', and 'online' within XLMiner. The solution creates pivot tables to determine probabilities related to loan acceptance based on online facility usage and credit card ownership, calculating conditional probabilities and proportions for various customer segments. The analysis includes detailed calculations of probabilities, such as the likelihood of a customer accepting a loan given they use online services and have a credit card, and concludes with recommendations for loan eligibility based on customer behavior. The assignment references relevant sources to support its findings.

Running head: DATA MINING
Data Mining
Name of the Student
Name of the University
Author Note
Data Mining
Name of the Student
Name of the University
Author Note
Paraphrase This Document
Need a fresh take? Get an instant paraphrase of this document with our AI Paraphraser

2DATA MINING
Table of Contents
Answer 1....................................................................................................................................3
Part a.......................................................................................................................................3
Part b......................................................................................................................................5
Answer 2....................................................................................................................................6
Part a.......................................................................................................................................6
Part b......................................................................................................................................7
Part c.......................................................................................................................................7
i...........................................................................................................................................8
ii..........................................................................................................................................8
iii........................................................................................................................................8
iv.........................................................................................................................................8
v..........................................................................................................................................8
vi.........................................................................................................................................9
Part d......................................................................................................................................9
Part e.......................................................................................................................................9

3DATA MINING
Answer 1
Part a
The components of PCA can be represented as:
Answer 1
Part a
The components of PCA can be represented as:
⊘ This is a preview!⊘
Do you want full access?
Subscribe today to unlock all pages.

Trusted by 1+ million students worldwide

4DATA MINING
The scores of PCA can be represented as:
Analysis of the PCA matrix.
80% of the variance in the variables can be explained through four PCA components (Franco,
2013).
The first principal components are represented by the utilities X1 and X2. They represent the
financial performance of the utilities.
The second principal components are represented by the utilities X4 and X8. They represent
the operational performance of the utilities.
The third principal components are represented by the utilities X3 and X7. They represent the
production cost of the utilities.
Paraphrase This Document
Need a fresh take? Get an instant paraphrase of this document with our AI Paraphraser

5DATA MINING
The final principal components are represented by the utilities X1 and X3. They represent the
fixed cost in relation to electricity.
Need for Normalization
In the present investigation no variable has an uneven contribution. Thus there are no
components which are overrepresented or underrepresented. Hence there is no need for
normalization of the data. The need for normalization of the data arises when different
variables get magnified due to highest variance. The total variance matrix highlights the
contribution of PCA (Shmueli, Patel and Bruce, 2016).
Part b
The advantages of PCA
1) Useful to reduce the number of predictor variables through the process of analysis of
the input variables.
2) It provides an estimation of the correlation between different components
3) It provides a set of variables (usually three) which can be used to explain the original
set.
4) The components of PCA do not suffer from multicollinearity
The disadvantages of PCA
1) When the variables have a non-linear association then PCA cannot be used
2) PCA assumes that the variables are normally distributed
3) The data provided to PCA should be continuous

6DATA MINING
Answer 2
Universal Bank has provided a data of 5000 customers. The bank wants to investigate
the personal loan acceptance of the bank. To, evaluate the personal loan acceptance the data
set has been divided into a training set and a validation set. In order to evaluate the personal
loan acceptance the variables “Personal loan”, “Credit card” and “online” are used. All
investigation is done on the training set.
XLMiner Tool has been used to analyze the data.
Part a
A pivot table is created to understand the use of the facilities of the bank
(Walkenbach, 2013).
The column variable is online. “0” means the customers is not using online facilities,
while “1” signifies the customer is using online facilities.
The first row variable is Credit Card. “0” means the customers is not using credit
card, while “1” signifies the customer is using Credit Card.
The second row variable is Loan. “0” signifies the customer would not take a loan. On
the other hand “1” signifies the customer would take a loan.
⊘ This is a preview!⊘
Do you want full access?
Subscribe today to unlock all pages.

Trusted by 1+ million students worldwide

7DATA MINING
Count of ID Online
CreditCard 0 1 Grand Total
0 860 1247 2107
0 781 1115 1896
1 79 132 211
1 371 522 893
0 329 471 800
1 42 51 93
Grand Total 1231 1769 3000
Part b
The total number of customers who use online facilities and use credit card and have
taken a loan = (Online = 1; Credit Card = 1; Loan = 1) = 51
The total number of customers who use online services and use credit card = (Online
= 1; Credit Card = 1) = 522
Thus the probability that the customer would accept the loan offer = 51
522=0.0977
Hence, it is seen that the probability that the customer would accept the loan offer = 9.77%
Part c
The column variable is online. “0” means the customers is not using online facilities,
while “1” signifies the customer is using online facilities.
The row variable is Loan. “0” signifies the customer would not take a loan. On the
other hand “1” signifies the customer would take a loan.
Count of ID Online
PersonalLoan 0 1 Grand Total
0 1110 1586 2696
1 121 183 304
Grand Total 1231 1769 3000
Count of ID Online
CreditCard 0 1 Grand Total
0 860 1247 2107
0 781 1115 1896
1 79 132 211
1 371 522 893
0 329 471 800
1 42 51 93
Grand Total 1231 1769 3000
Part b
The total number of customers who use online facilities and use credit card and have
taken a loan = (Online = 1; Credit Card = 1; Loan = 1) = 51
The total number of customers who use online services and use credit card = (Online
= 1; Credit Card = 1) = 522
Thus the probability that the customer would accept the loan offer = 51
522=0.0977
Hence, it is seen that the probability that the customer would accept the loan offer = 9.77%
Part c
The column variable is online. “0” means the customers is not using online facilities,
while “1” signifies the customer is using online facilities.
The row variable is Loan. “0” signifies the customer would not take a loan. On the
other hand “1” signifies the customer would take a loan.
Count of ID Online
PersonalLoan 0 1 Grand Total
0 1110 1586 2696
1 121 183 304
Grand Total 1231 1769 3000
Paraphrase This Document
Need a fresh take? Get an instant paraphrase of this document with our AI Paraphraser

8DATA MINING
The column variable is Credit Card. “0” means the customers is not using Credit Card
of the bank, while “1” signifies the customer is using Credit card of the bank.
The row variable is Loan. “0” signifies the customer would not take a loan. On the
other hand “1” signifies the customer would take a loan.
Count of ID Credit Card
Personal Loan 0 1 Grand Total
0 1896 800 2696
1 211 93 304
Grand Total 2107 893 3000
i
The proportion of credit card holders among the loan acceptors = P(CC=1 | Loan=1) = 93
304
= 0.306
ii
The proportion of online users among the loan acceptors = P(Online=1 | Loan=1) = 183
304
=0.602
iii
The proportion of loan acceptors = P(Loan=1) = 304
3000 =0.101
iv
The proportion of customers who are credit card holders and are among the loan rejectors =
P(CC=1 | Loan=0) = 800
2696 =0.297

9DATA MINING
v
The proportion of customers who use online facilities and are among the loan rejectors =
P(Online=1 | Loan=0) = 1586
2696 =0.588
vi
The proportion of loan rejectors = P(Loan=0) = 2696
3000 =0.899
Part d
Hence, the probability P(Loan=1 | CC=1, Online=1) =
0.306∗0.602∗0.101
0.306∗0.602∗0.101+0.297∗0.588∗0.899 =0.106
Hence the probability for probability P(Loan=1 | CC=1, Online=1) = 0.106
Part e
Hence, for a customer to get the loan he should have both a credit card as well as use online
facilities of Universal Bank.
⊘ This is a preview!⊘
Do you want full access?
Subscribe today to unlock all pages.

Trusted by 1+ million students worldwide

10DATA MINING
References
Franco, D. (2013). Factor analysis and principal component analysis (Vol. 23).
FrancoAngeli.
Shmueli, G., Patel, N. R., & Bruce, P. C. (2016). Data mining for business intelligence:
concepts, techniques, and applications in Microsoft Office Excel with XLMiner. John
Wiley & Sons.
Walkenbach, J. (2013). Excel 2003 bible (Vol. 36). John Wiley & Sons.
1 out of 10
Related Documents

Your All-in-One AI-Powered Toolkit for Academic Success.
+13062052269
info@desklib.com
Available 24*7 on WhatsApp / Email
Unlock your academic potential
Copyright © 2020–2025 A2Z Services. All Rights Reserved. Developed and managed by ZUCOL.