Analysis of Principal Components in Data Mining with XL Miner

Verified

Added on  2020/04/01

|8
|1179
|111
AI Summary
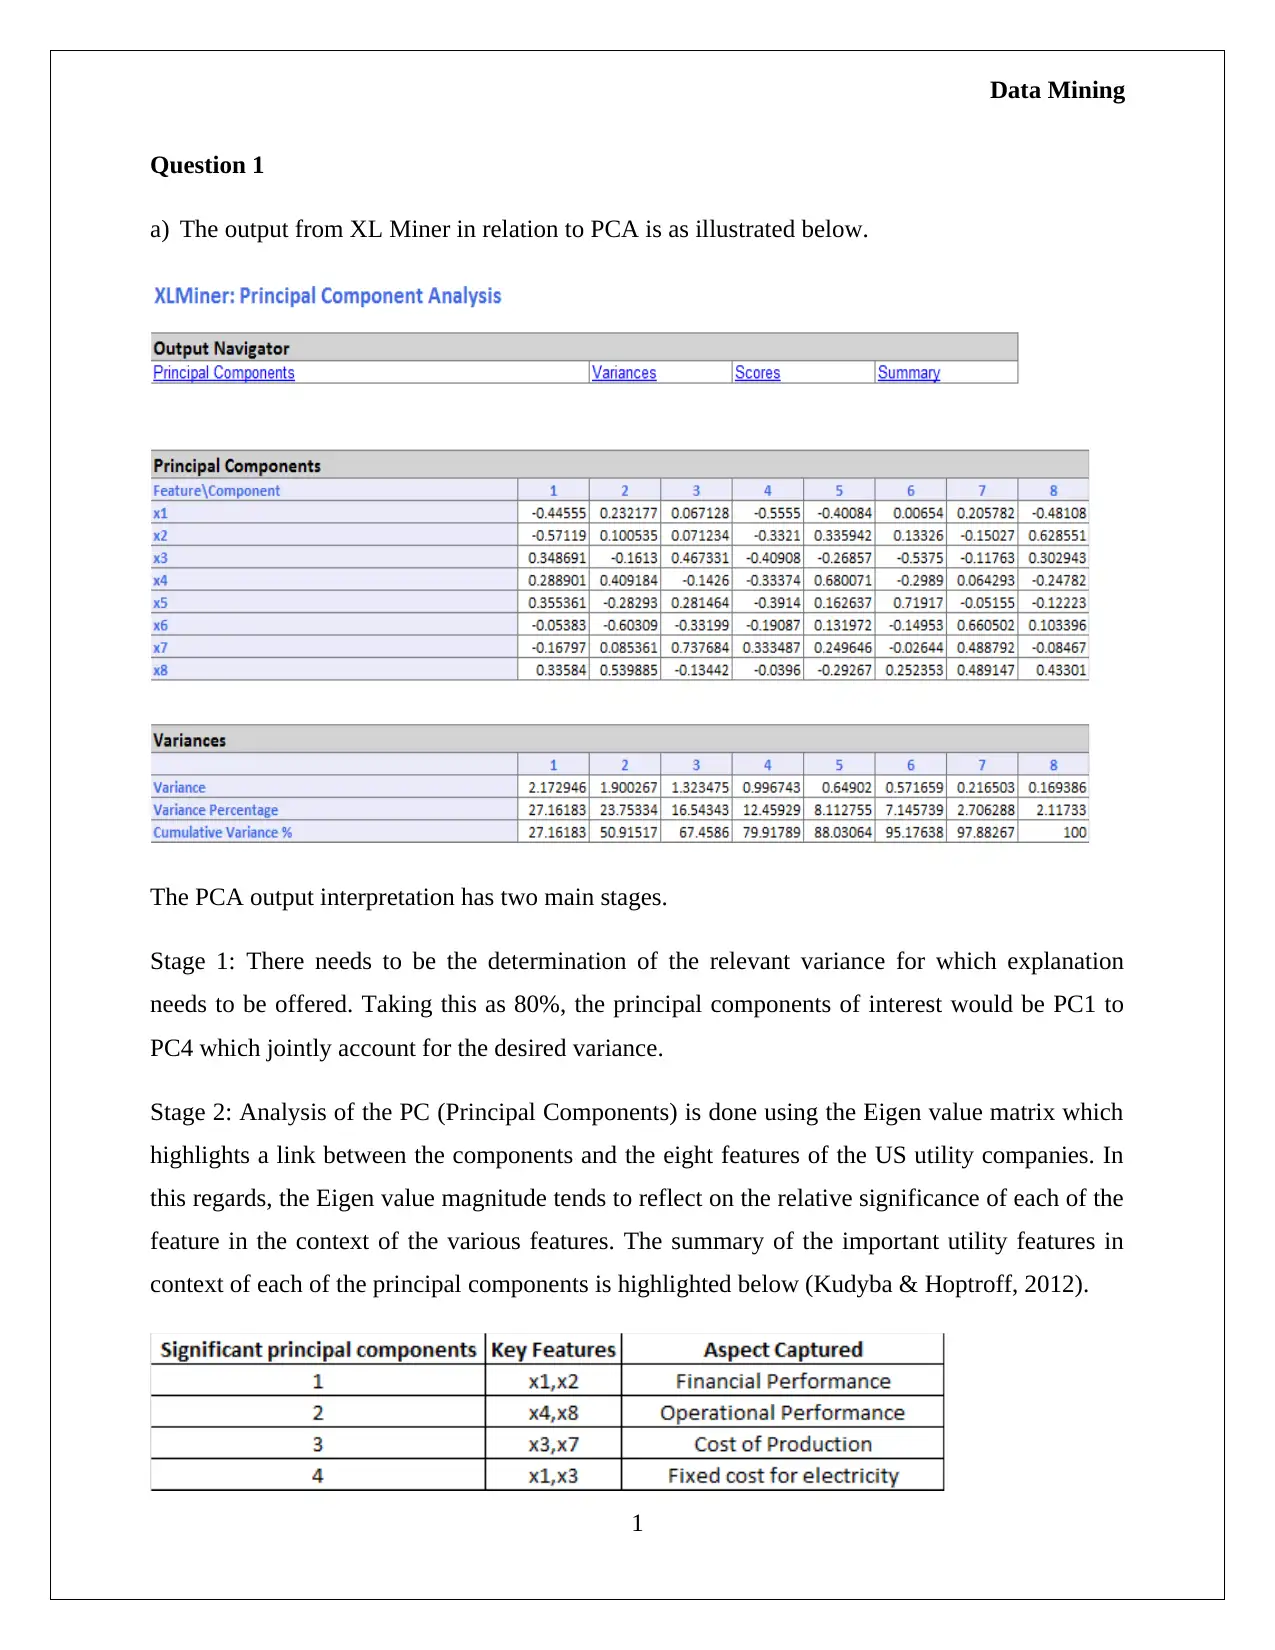
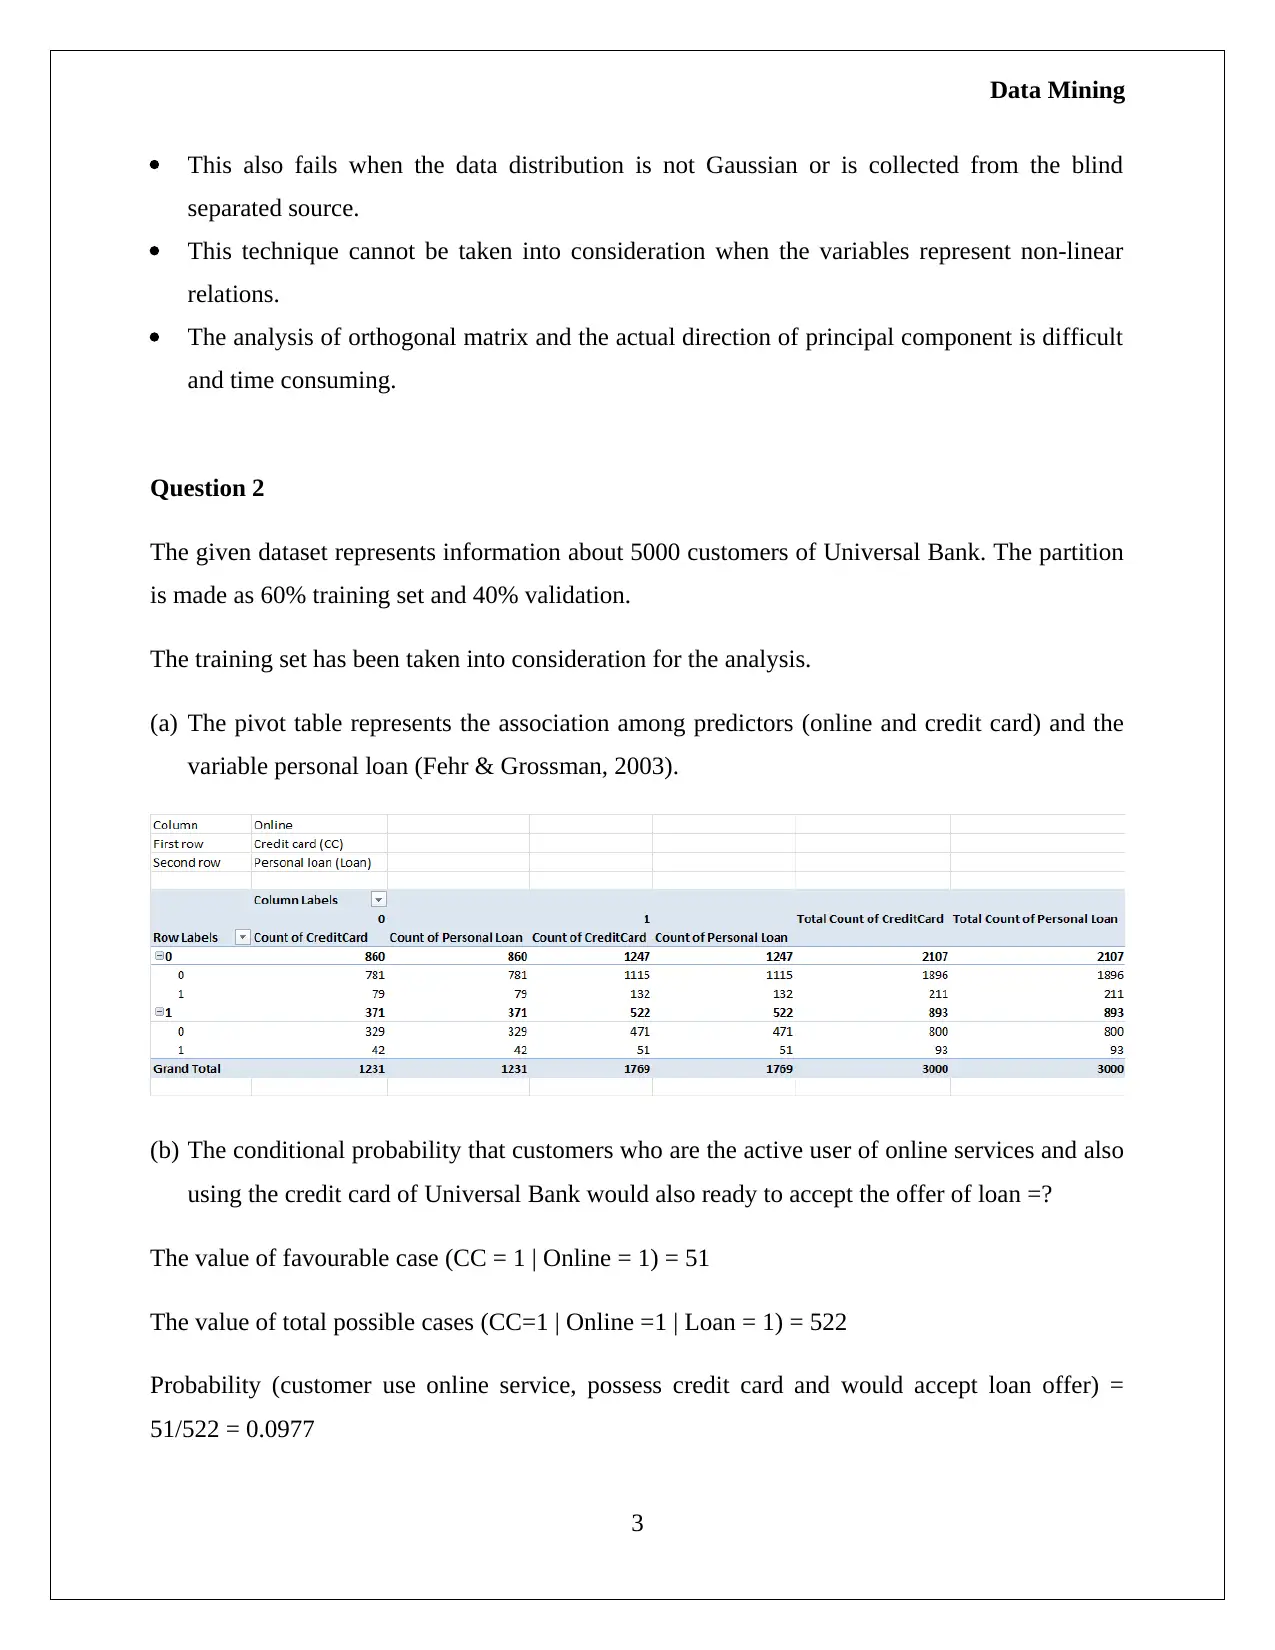
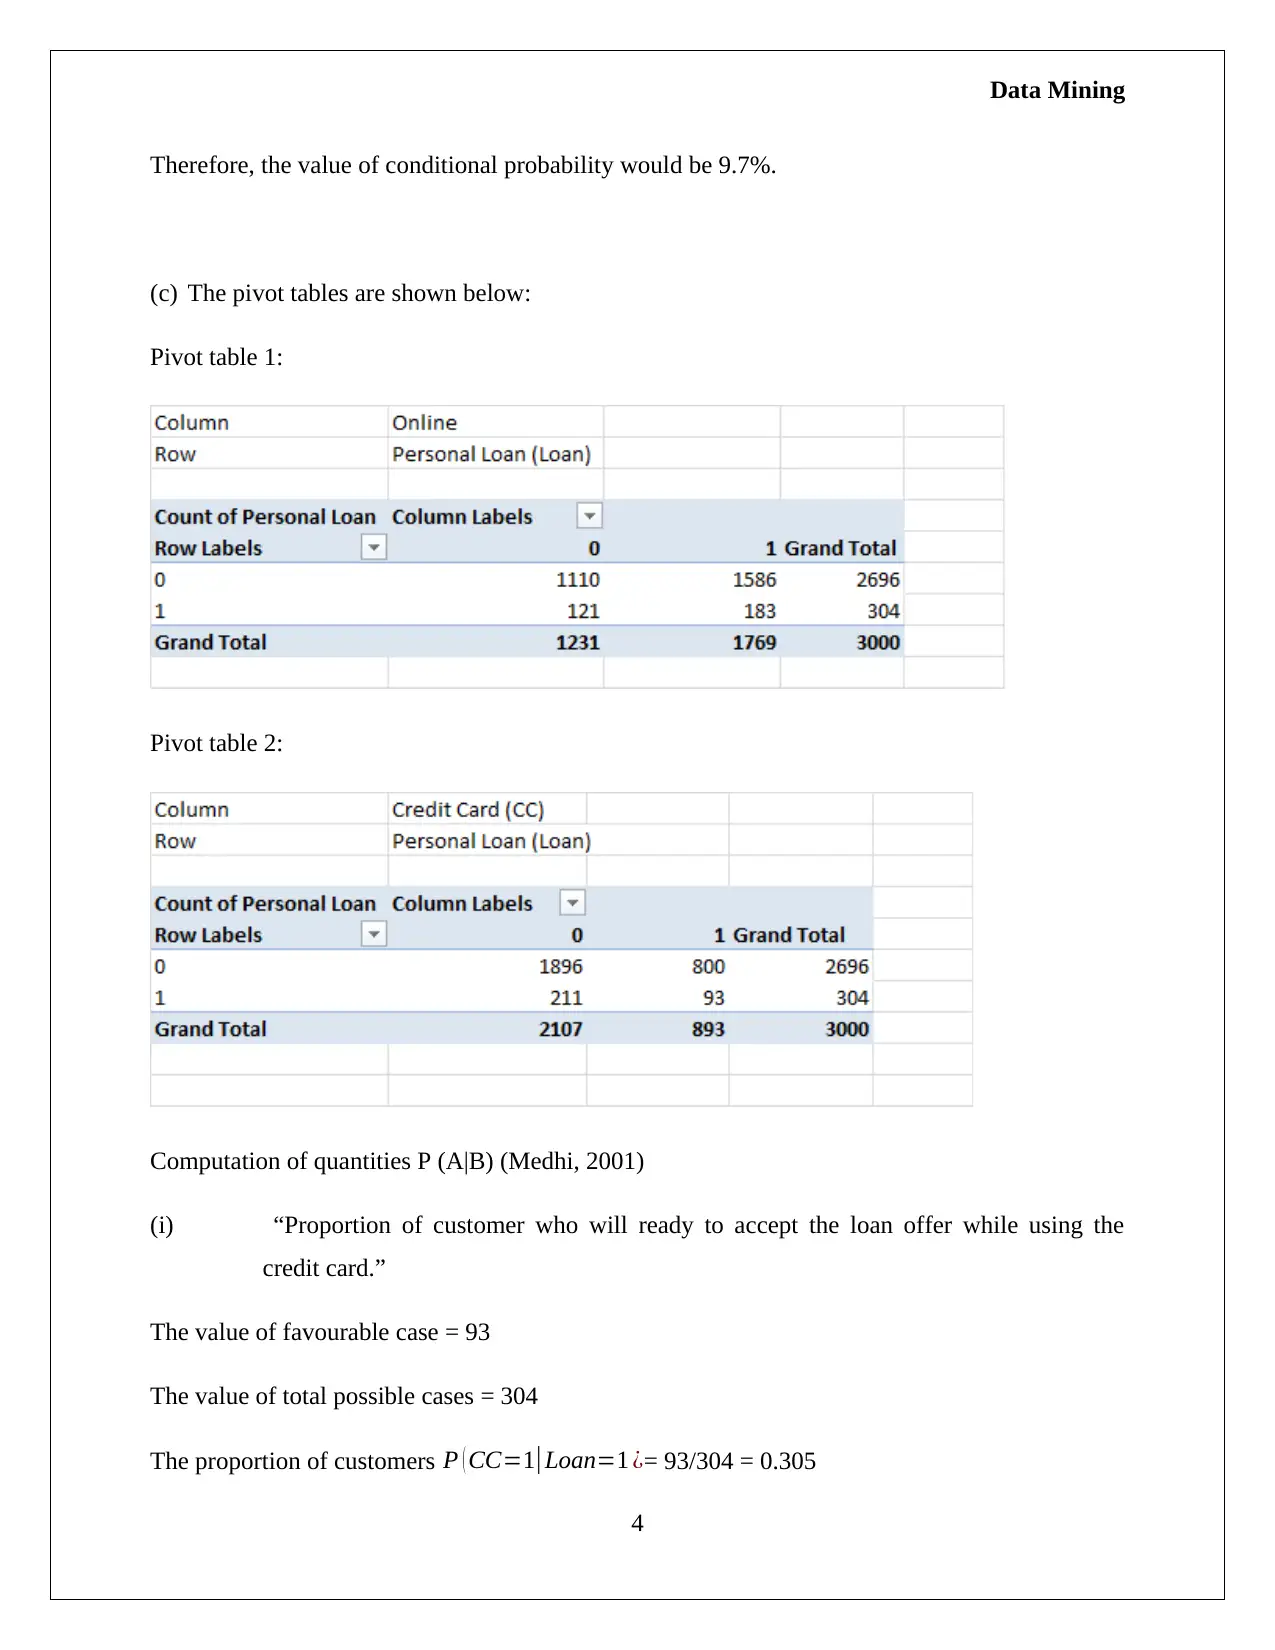
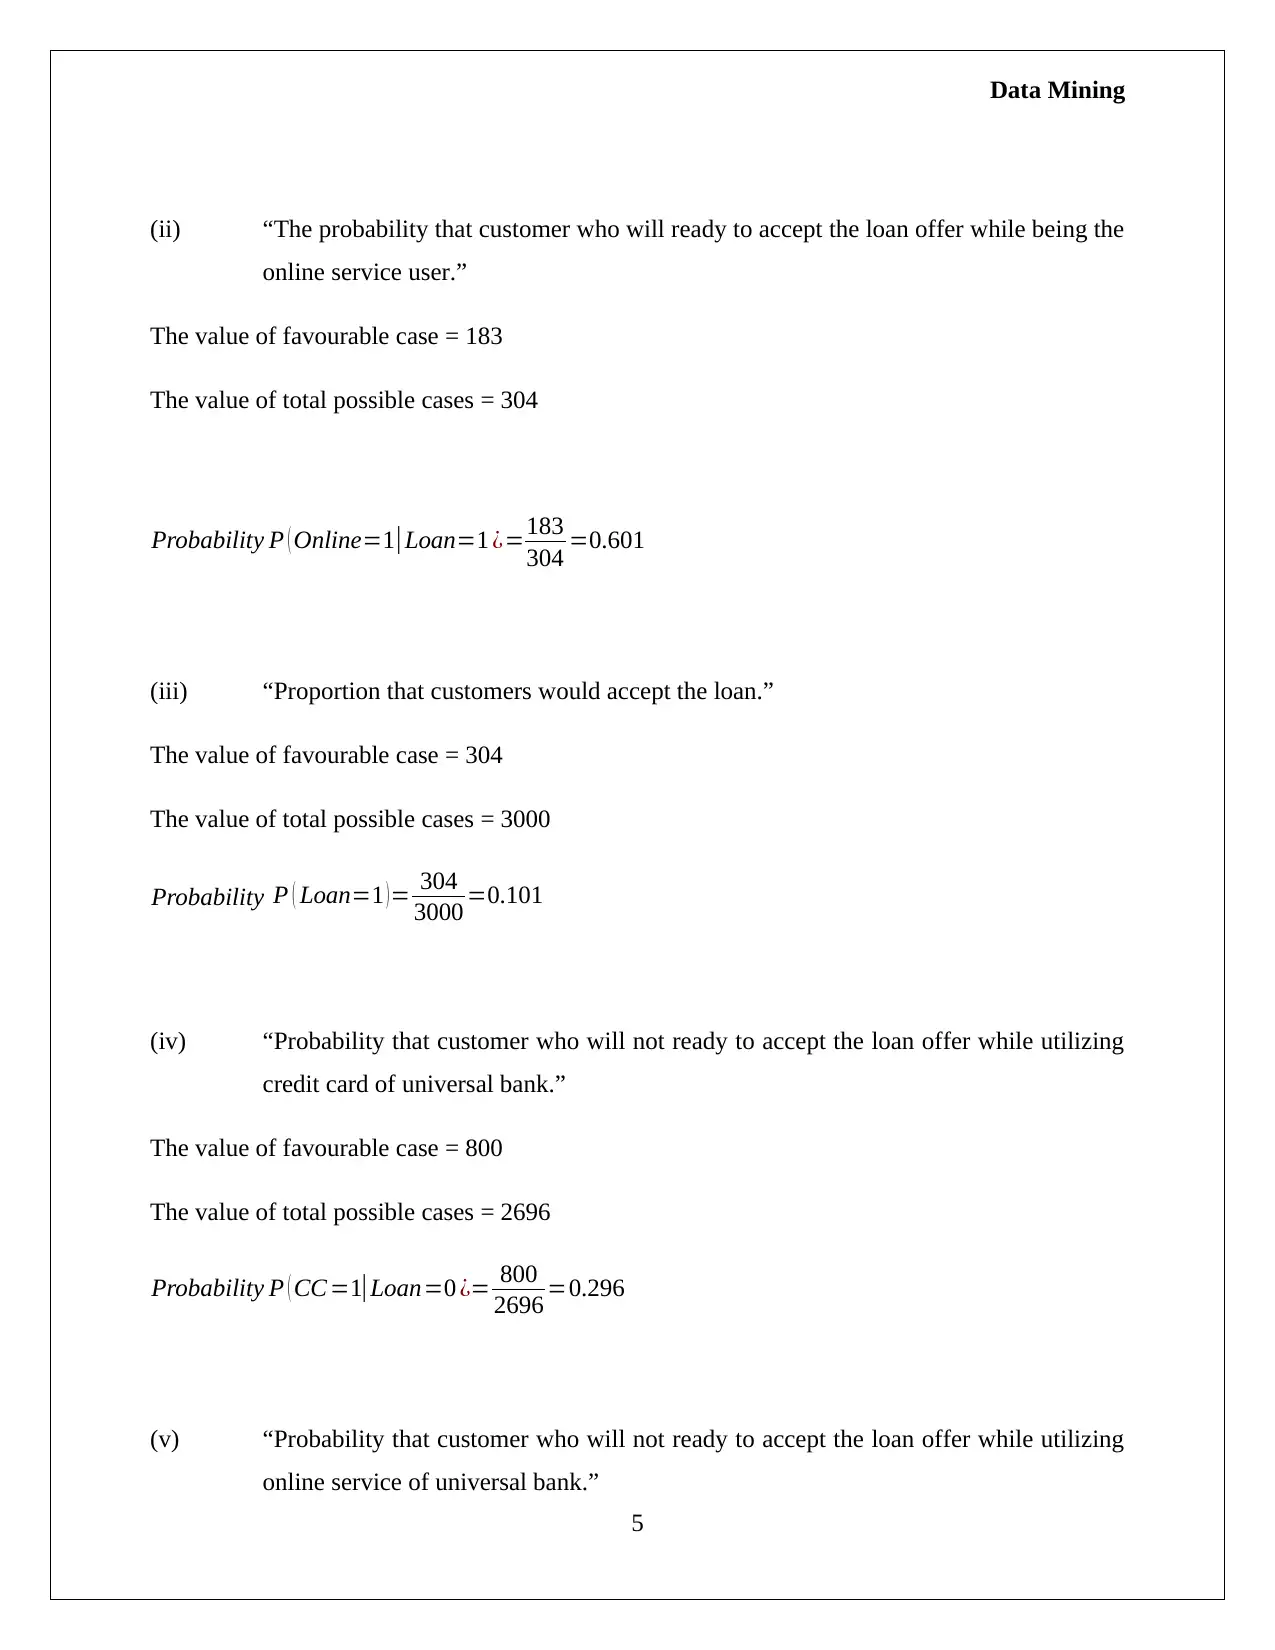
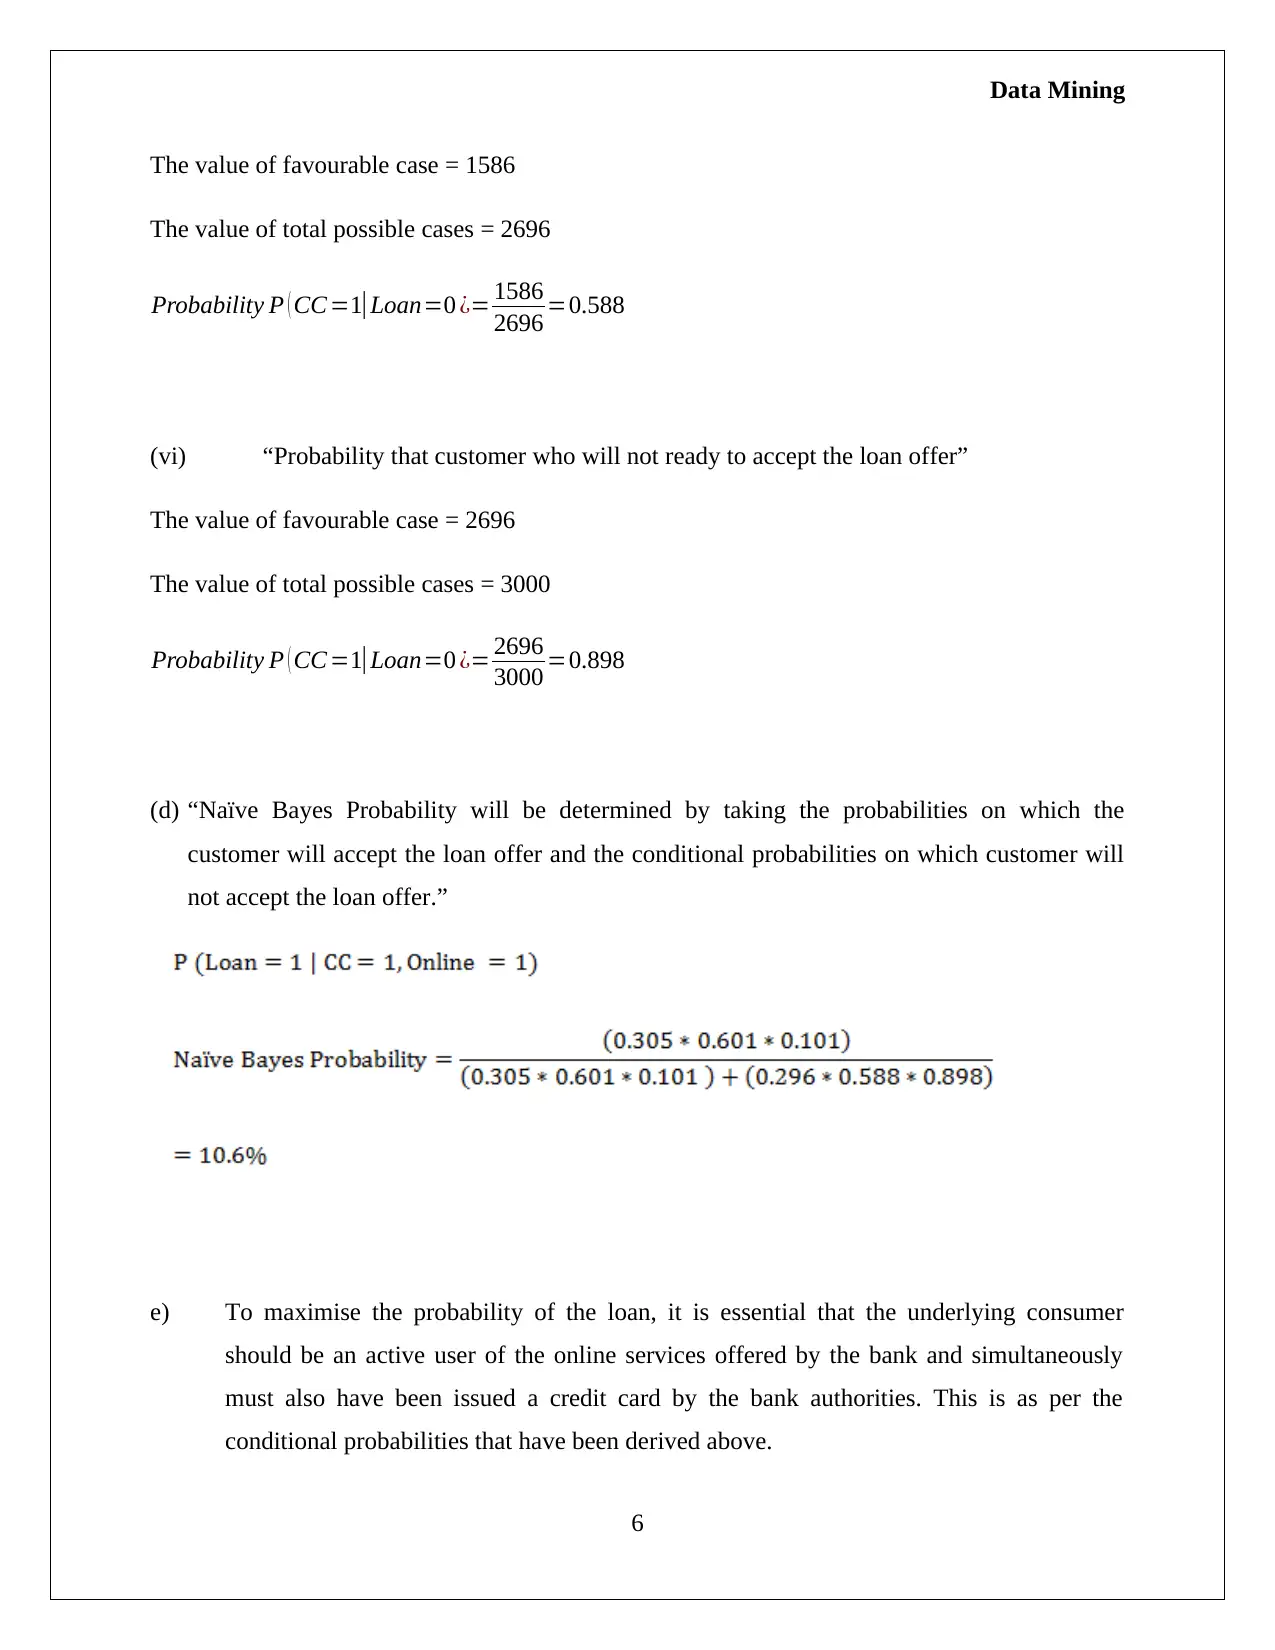
This assignment requires interpreting PCA outputs in the context of US utility companies using XL Miner, focusing on variance explanation and feature significance through eigenvalues. It involves determining principal components accounting for 80% variance and discussing their implications. The task also extends to analyzing a dataset of Universal Bank customers, calculating conditional probabilities related to loan acceptance based on credit card usage and online services, demonstrating the application of data mining techniques in practical scenarios.
Document Page
Data Mining and Visualization
Assessment Item – 2
STUDENT ID & NAME
[Pick the date]
tabler-icon-diamond-filled.svg

Secure Best Marks with AI Grader

Need help grading? Try our AI Grader for instant feedback on your assignments.
Document Page
Data Mining
Question 1
a) The output from XL Miner in relation to PCA is as illustrated below.
The PCA output interpretation has two main stages.
Stage 1: There needs to be the determination of the relevant variance for which explanation
needs to be offered. Taking this as 80%, the principal components of interest would be PC1 to
PC4 which jointly account for the desired variance.
Stage 2: Analysis of the PC (Principal Components) is done using the Eigen value matrix which
highlights a link between the components and the eight features of the US utility companies. In
this regards, the Eigen value magnitude tends to reflect on the relative significance of each of the
feature in the context of the various features. The summary of the important utility features in
context of each of the principal components is highlighted below (Kudyba & Hoptroff, 2012).
1
Document Page
Data Mining
Further reduction of variables can also be enabled by considering the relative significant of the
various PC and the magnitude of the Eigen values (Hofmann & Chisholm, 2016):
At times, PCA is conducted only after data normalisation is performed. This is done for
nullifying the impact of the differences is scales of the variables of interest. The scales are
different for the given utility data also but the output captured by individual variance
representation is not too skewed. Further, conducting PCA with the data normalisation for the
utility data does not lead to higher accuracy and hence no data normalisation is recommended
here (Shumueli, et. al., 2016).
(b) A brief discussion about advantages and disadvantages of principal components is carried out
below (Hofmann & Chisholm, 2016):
Advantages
Principal component analysis is a powerful tool to determine the structure of variables of
dataset.
This is mainly used in dimension reduction processes where large sized variables are lowered
down to lesser number of variables.
This analysis is based on the “max- variance” technique in which the component with less
variance would be eliminated.
The data can be represented in the cloud point in other coordinates system rather than x-y
coordinates.
The new variables after reduction are categorised as principal component and are distributed
in the orthogonal matrix.
The visualization of these new principal components in m or p dimensional space is easy
because the each component has distinguished axis and dot point.
Disadvantages
This sometimes eliminates the imperative variables from the data which show low variance
but have critical role in the analysis.
This is not useful when the variables are of categorical type.
2
Document Page
Data Mining
This also fails when the data distribution is not Gaussian or is collected from the blind
separated source.
This technique cannot be taken into consideration when the variables represent non-linear
relations.
The analysis of orthogonal matrix and the actual direction of principal component is difficult
and time consuming.
Question 2
The given dataset represents information about 5000 customers of Universal Bank. The partition
is made as 60% training set and 40% validation.
The training set has been taken into consideration for the analysis.
(a) The pivot table represents the association among predictors (online and credit card) and the
variable personal loan (Fehr & Grossman, 2003).
(b) The conditional probability that customers who are the active user of online services and also
using the credit card of Universal Bank would also ready to accept the offer of loan =?
The value of favourable case (CC = 1 | Online = 1) = 51
The value of total possible cases (CC=1 | Online =1 | Loan = 1) = 522
Probability (customer use online service, possess credit card and would accept loan offer) =
51/522 = 0.0977
3
tabler-icon-diamond-filled.svg

Secure Best Marks with AI Grader

Need help grading? Try our AI Grader for instant feedback on your assignments.
Document Page
Data Mining
Therefore, the value of conditional probability would be 9.7%.
(c) The pivot tables are shown below:
Pivot table 1:
Pivot table 2:
Computation of quantities P (A|B) (Medhi, 2001)
(i) “Proportion of customer who will ready to accept the loan offer while using the
credit card.”
The value of favourable case = 93
The value of total possible cases = 304
The proportion of customers P ( CC=1|Loan=1 ¿= 93/304 = 0.305
4
Document Page
Data Mining
(ii) “The probability that customer who will ready to accept the loan offer while being the
online service user.”
The value of favourable case = 183
The value of total possible cases = 304
Probability P ( Online=1|Loan=1 ¿=183
304 =0.601
(iii) “Proportion that customers would accept the loan.”
The value of favourable case = 304
The value of total possible cases = 3000
Probability P ( Loan=1 )= 304
3000 =0.101
(iv) “Probability that customer who will not ready to accept the loan offer while utilizing
credit card of universal bank.”
The value of favourable case = 800
The value of total possible cases = 2696
Probability P ( CC =1| Loan=0 ¿= 800
2696 =0.296
(v) “Probability that customer who will not ready to accept the loan offer while utilizing
online service of universal bank.”
5
Document Page
Data Mining
The value of favourable case = 1586
The value of total possible cases = 2696
Probability P ( CC =1|Loan=0 ¿= 1586
2696 =0.588
(vi) “Probability that customer who will not ready to accept the loan offer”
The value of favourable case = 2696
The value of total possible cases = 3000
Probability P ( CC =1|Loan=0 ¿= 2696
3000 =0.898
(d) “Naïve Bayes Probability will be determined by taking the probabilities on which the
customer will accept the loan offer and the conditional probabilities on which customer will
not accept the loan offer.”
e) To maximise the probability of the loan, it is essential that the underlying consumer
should be an active user of the online services offered by the bank and simultaneously
must also have been issued a credit card by the bank authorities. This is as per the
conditional probabilities that have been derived above.
6
tabler-icon-diamond-filled.svg

Paraphrase This Document

Need a fresh take? Get an instant paraphrase of this document with our AI Paraphraser
Document Page
Data Mining
Reference
Fehr, F. H., & Grossman, G. (2003). An introduction to sets, probability and hypothesis testing
(3rd ed.). Ohio: Heath.
Hofmann, M. & Chisholm, A. (2016) Text Mining and Visualization Case Studies Using Open-
Source Tools (4th ed.). London: CRC Press.
Kudyba, S. & Hoptroff, R. (2012) Data Mining and Business Intelligence: A Guide to
Productivity (3rd ed.). London: Idea Griou Inc.
Medhi, J. (2001). Statistical Methods: An Introductory Text (4th ed.). Sydney: New Age
International.
Shumueli, G., Bruce, C.P., Stephens, L.M. & Patel, R.N. (2016) Data Mining for Business
Analytics: Concepts, Techniques, and Applications with JMP Pro. Sydney: John Wiley &
Sons.
7
chevron_up_icon
1 out of 8
circle_padding
hide_on_mobile
zoom_out_icon
logo.png

Your All-in-One AI-Powered Toolkit for Academic Success.

Available 24*7 on WhatsApp / Email

[object Object]