ITC563 Data Mining Assignment 2: PCA, Naive Bayes Analysis and Results

Verified

Added on  2020/04/01

|8
|1369
|444
Homework Assignment
AI Summary
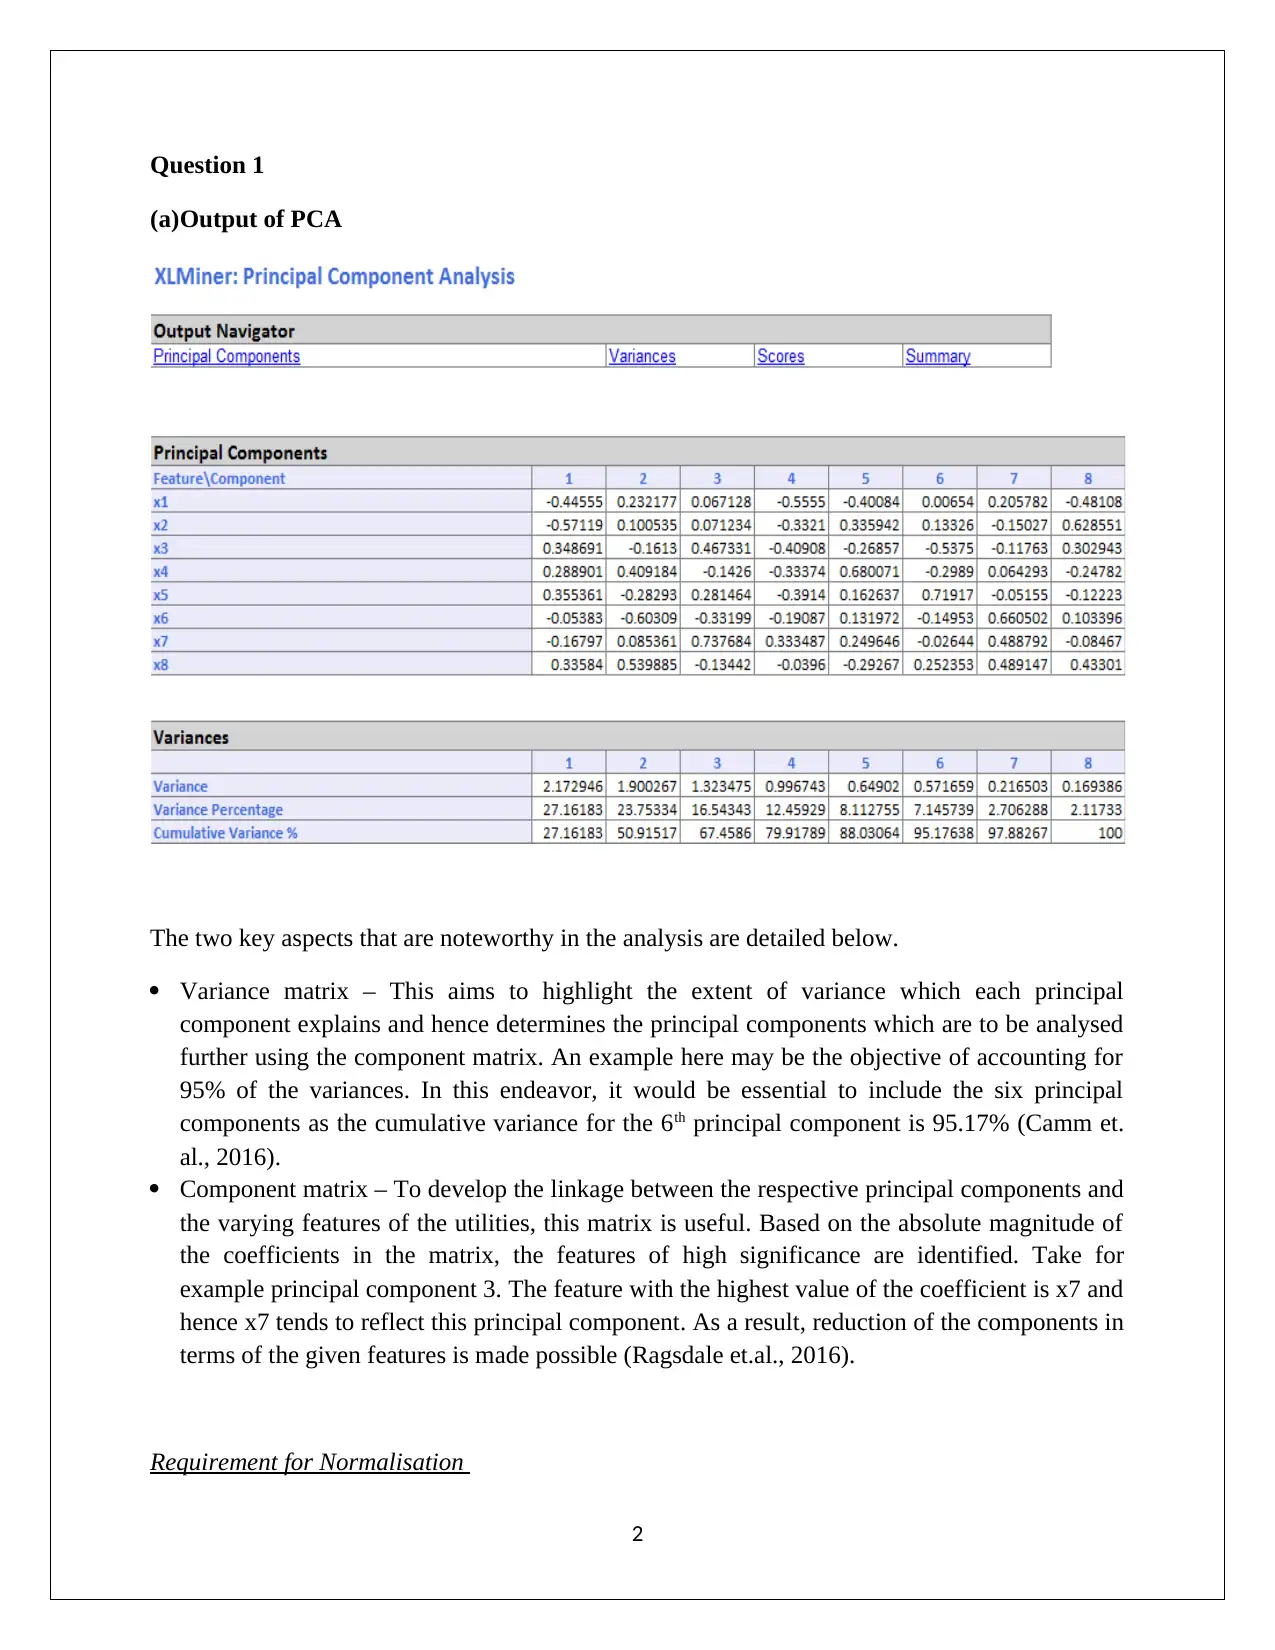
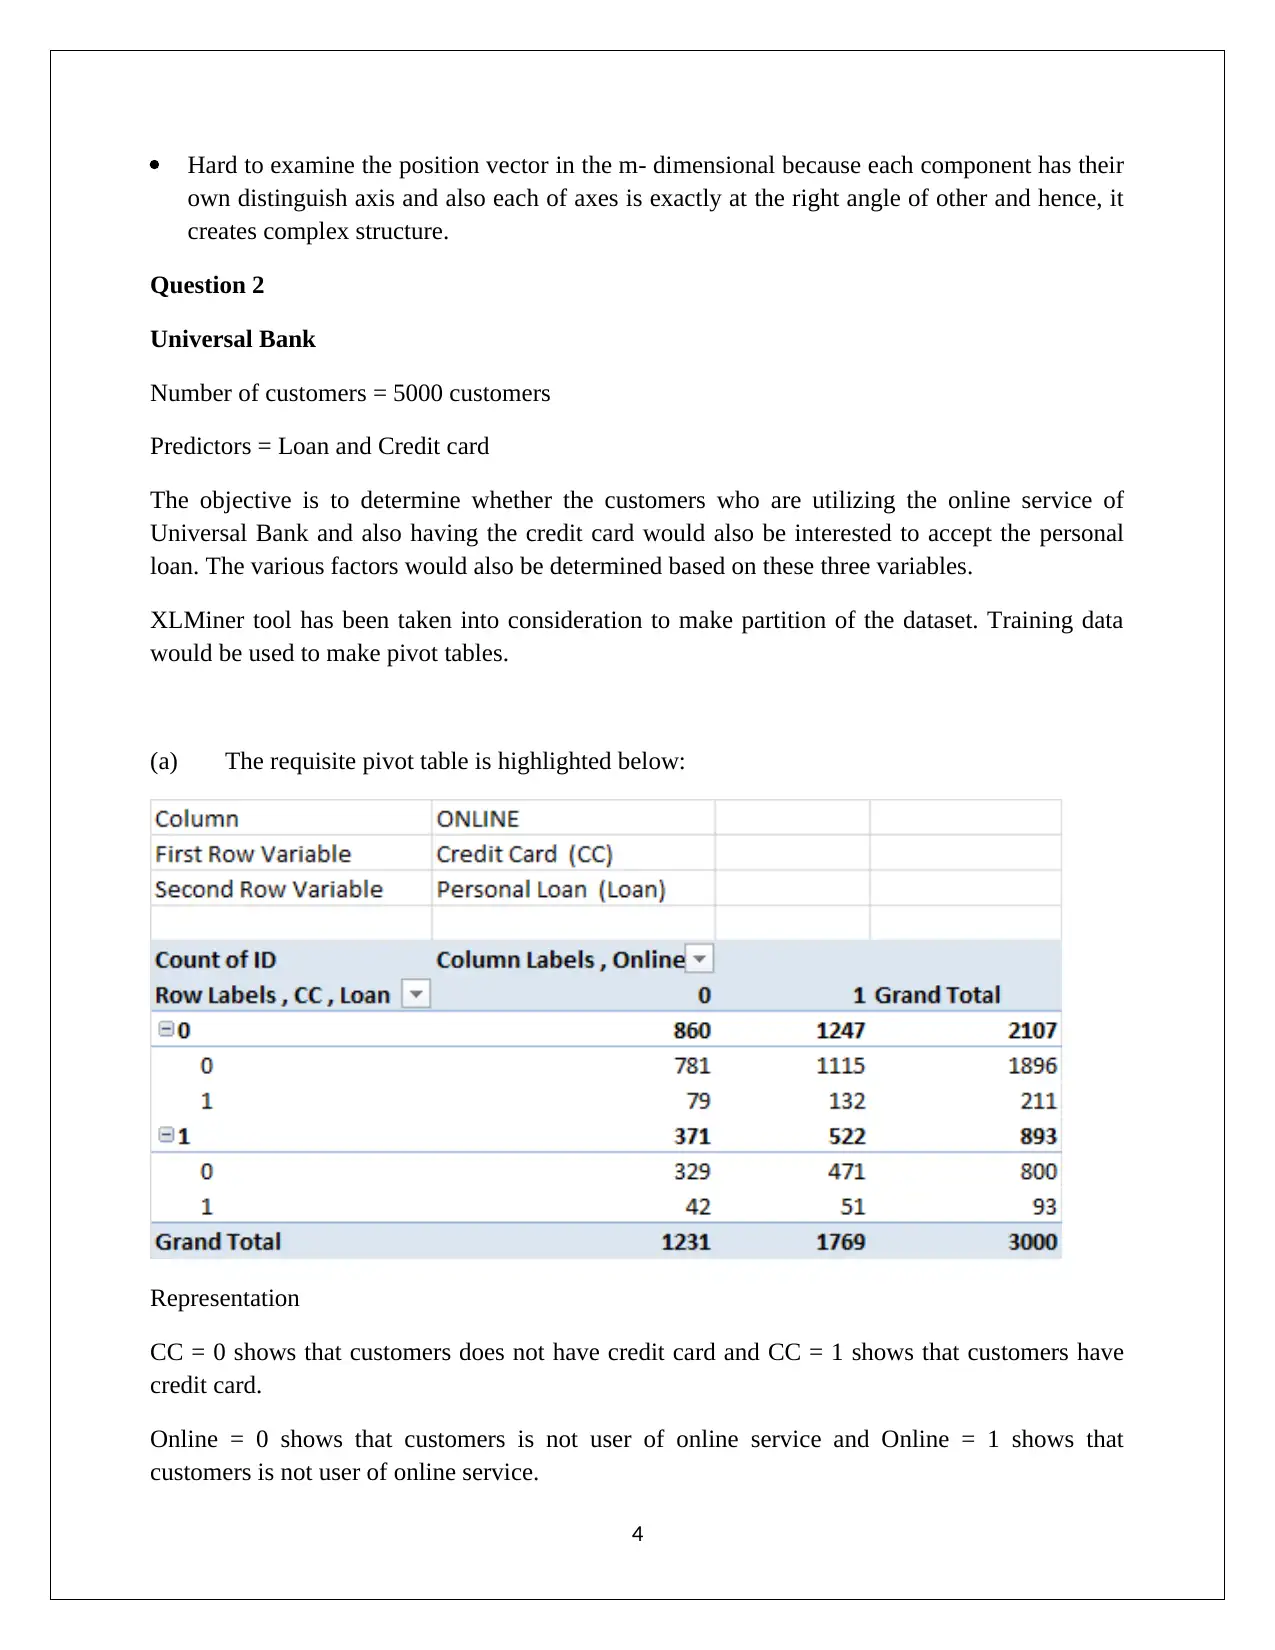
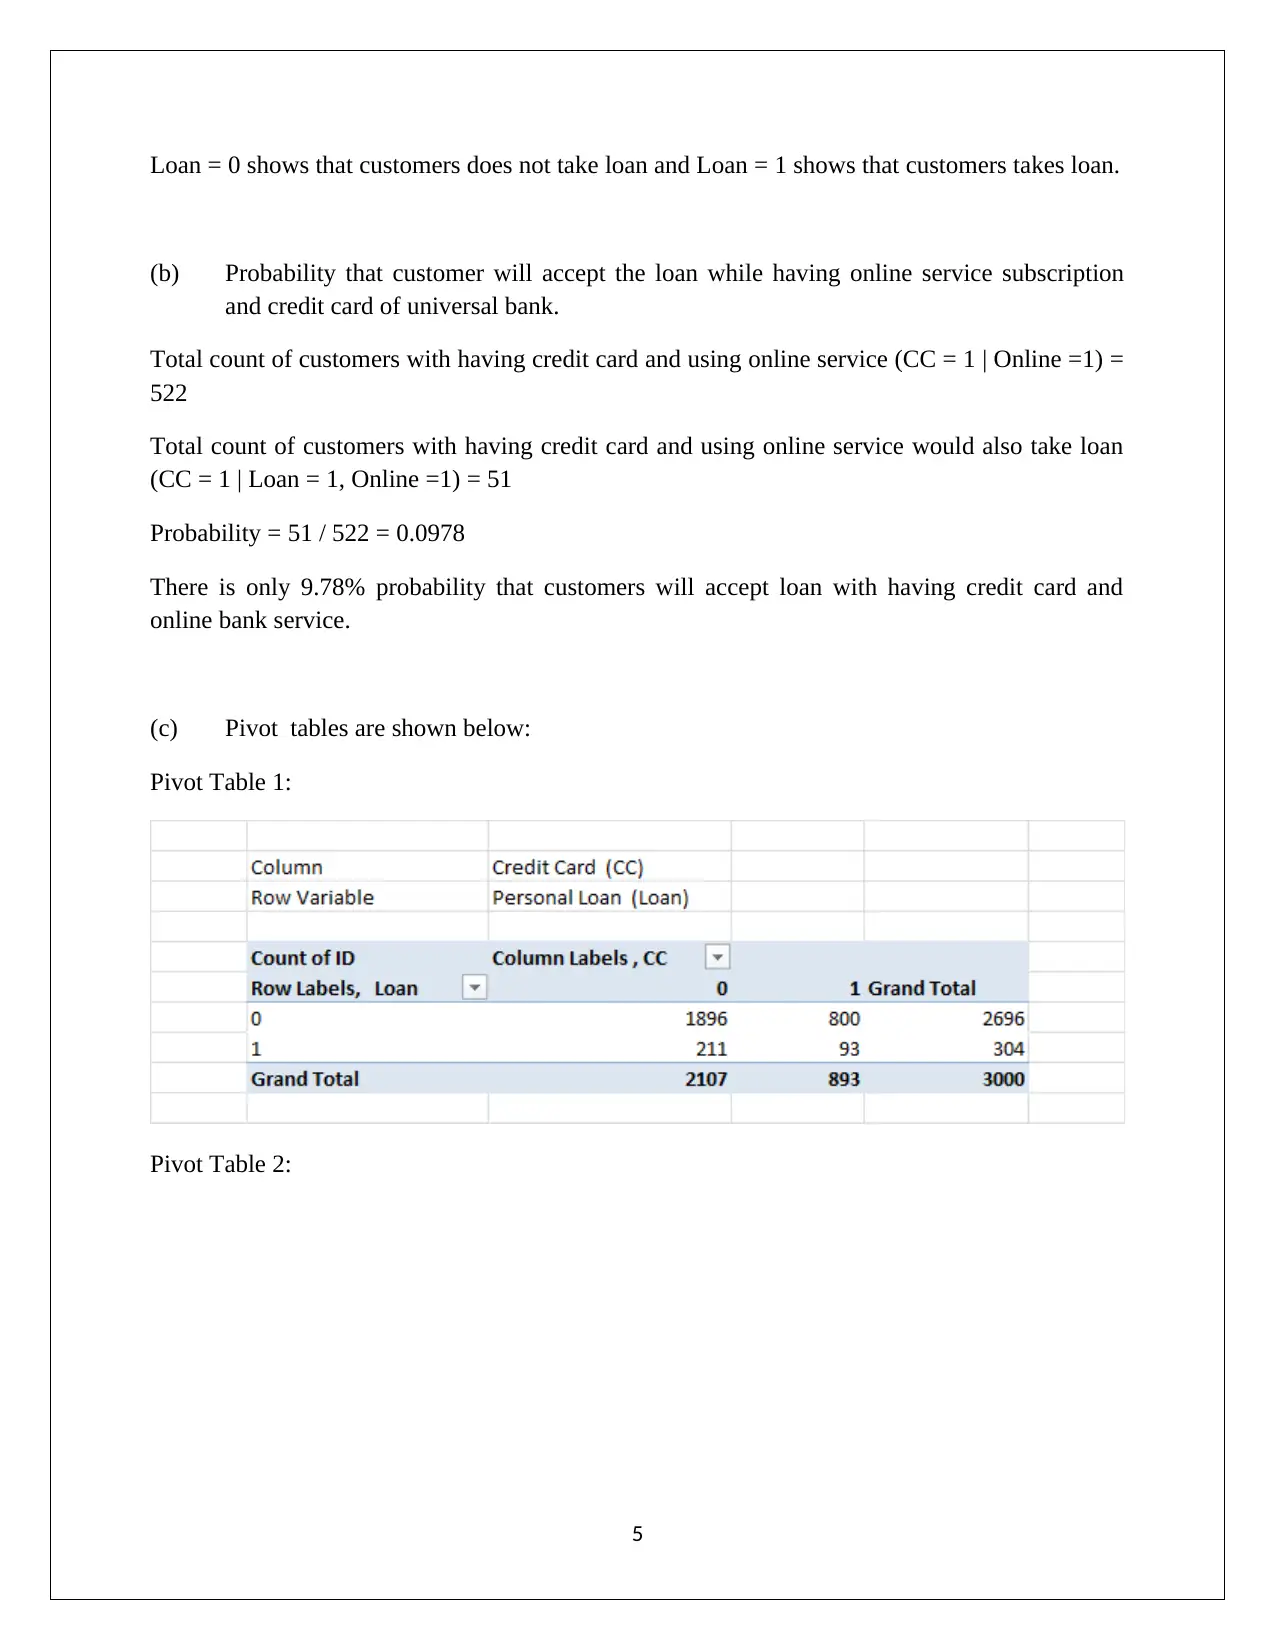
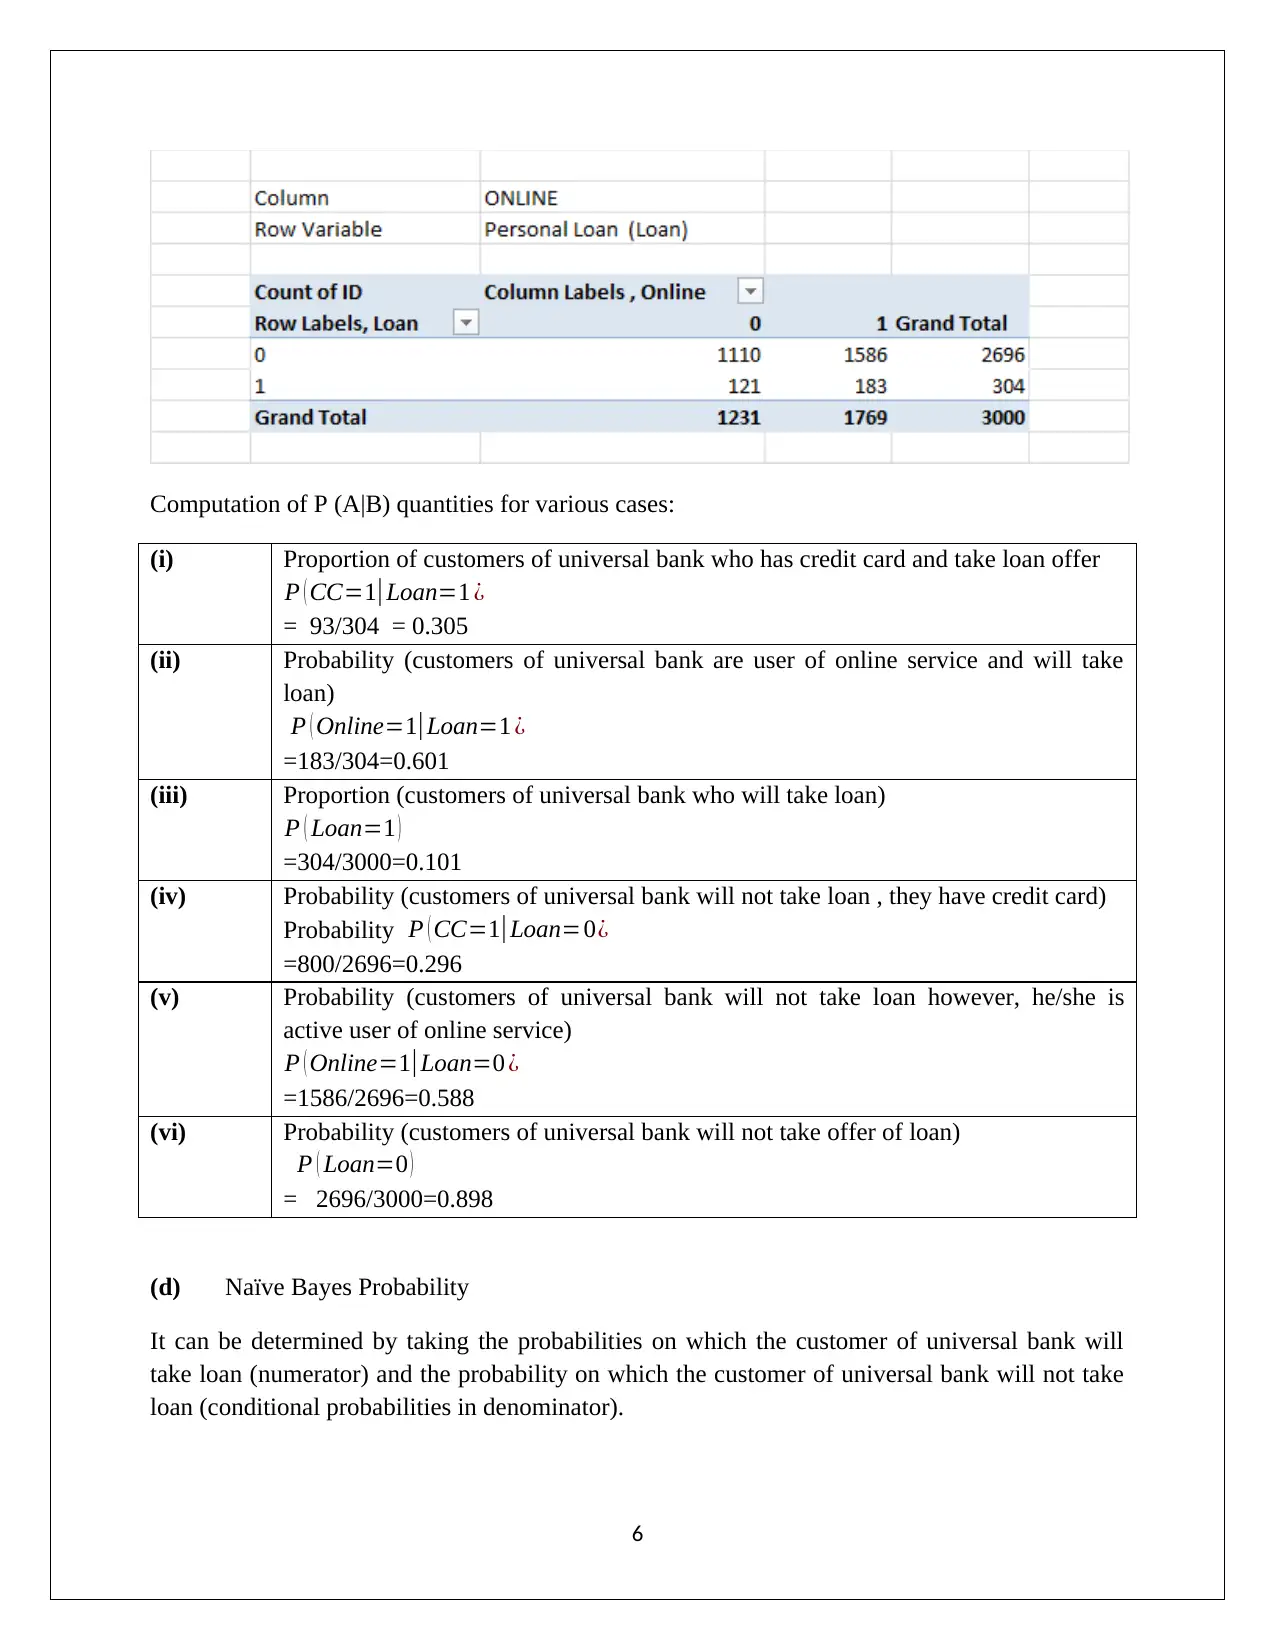
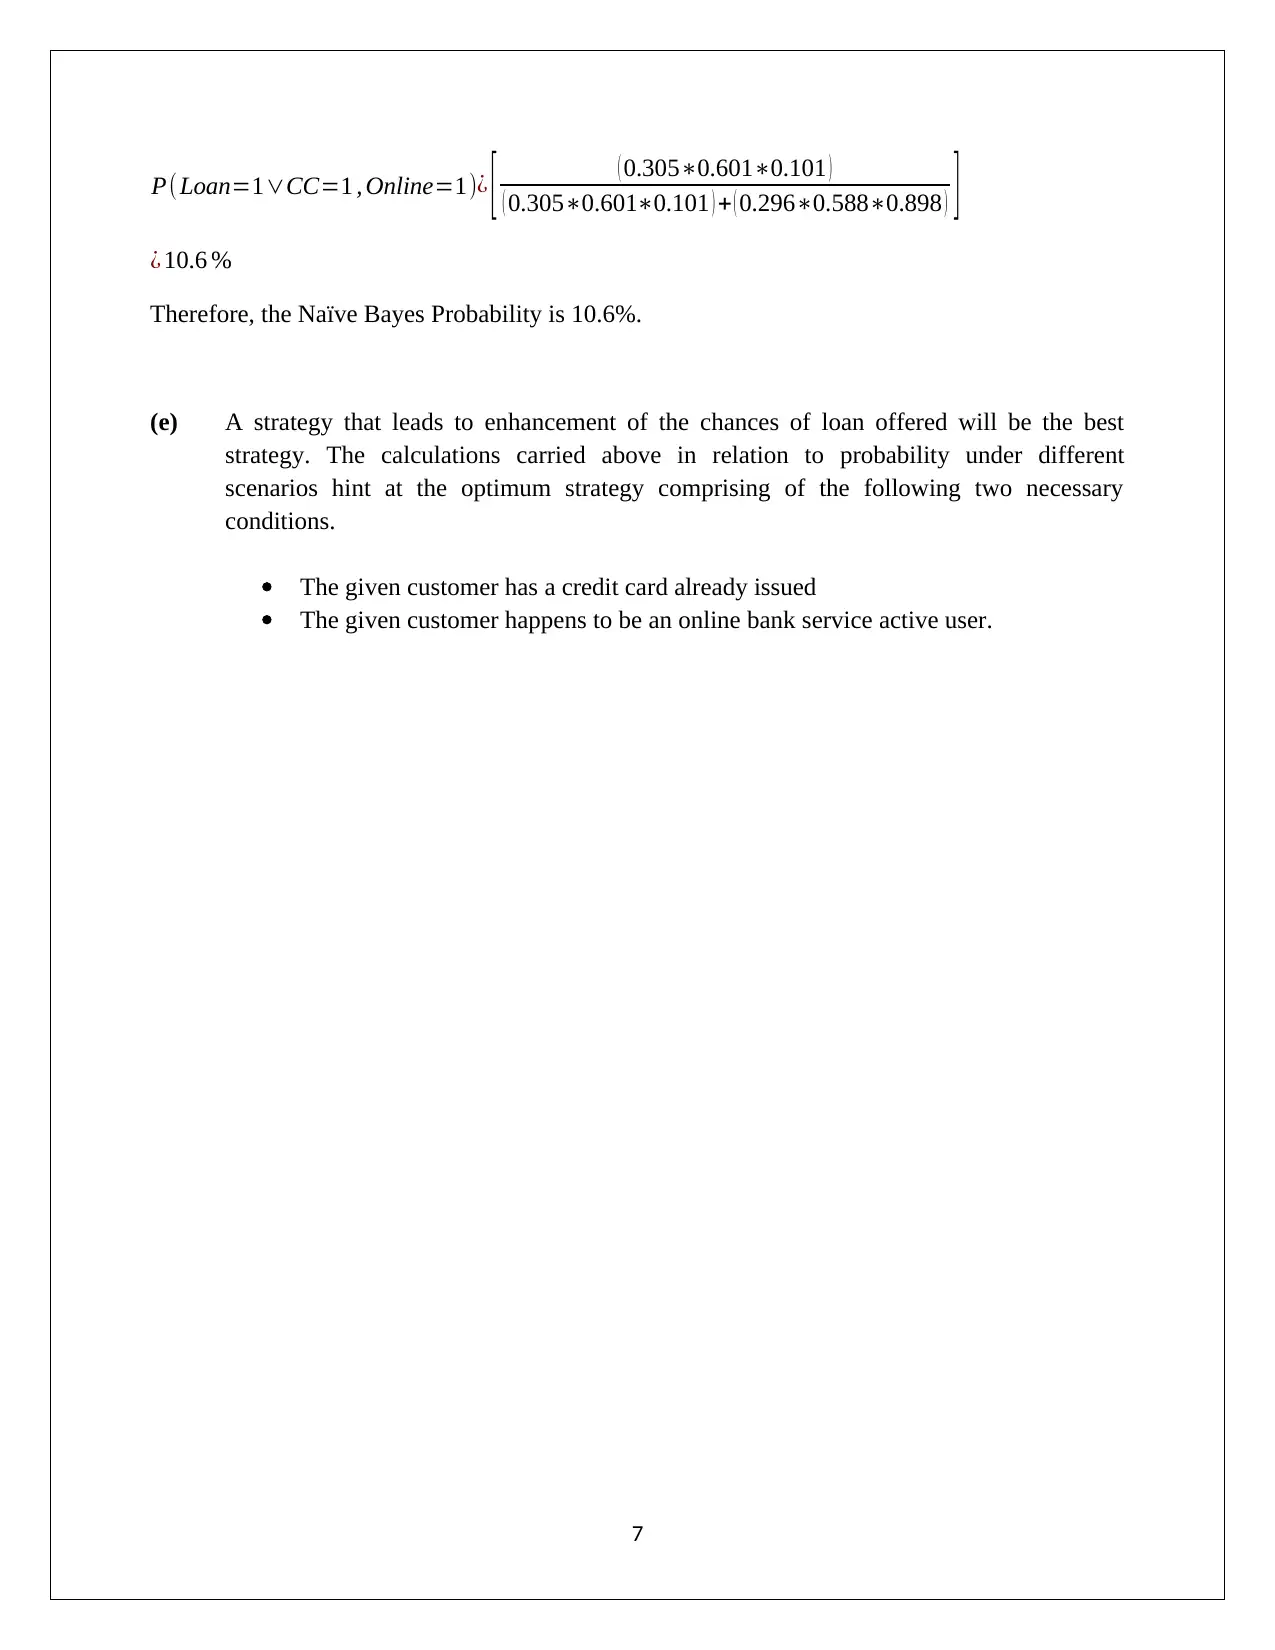
This data mining assignment, submitted by Nipuna Ekanayake, analyzes PCA (Principal Component Analysis) and Naive Bayes techniques using data from Universal Bank. The assignment begins with an examination of PCA, discussing variance matrices, component matrices, and the need for normalization. It outlines the advantages and disadvantages of PCA, including its utility in dimensionality reduction and its limitations in handling non-linear relationships and data distributions. The second part of the assignment focuses on a Universal Bank case study, predicting customer loan acceptance based on credit card usage and online service subscriptions. The analysis involves pivot tables, probability calculations, and Naive Bayes probability to determine the likelihood of customers taking loans under different conditions. The solution identifies key factors for loan offers and suggests strategies to enhance loan acceptance rates. The assignment references several academic sources to support its findings.
Document Page
DATA MINING
Subject Code: ITC563
Subject Name: DMVBI
Assignment No: 2
Lecturer Name: Sarwar Tapar
Student First Name: Nipuna
Student Surname: Ekanayake
Student ID: 11642697
Assignment Due Date: 17/09/2017
Assignment Submission Date: 18/09/2017
1
tabler-icon-diamond-filled.svg

Secure Best Marks with AI Grader

Need help grading? Try our AI Grader for instant feedback on your assignments.
Document Page
Question 1
(a)Output of PCA
The two key aspects that are noteworthy in the analysis are detailed below.
Variance matrix – This aims to highlight the extent of variance which each principal
component explains and hence determines the principal components which are to be analysed
further using the component matrix. An example here may be the objective of accounting for
95% of the variances. In this endeavor, it would be essential to include the six principal
components as the cumulative variance for the 6th principal component is 95.17% (Camm et.
al., 2016).
Component matrix – To develop the linkage between the respective principal components and
the varying features of the utilities, this matrix is useful. Based on the absolute magnitude of
the coefficients in the matrix, the features of high significance are identified. Take for
example principal component 3. The feature with the highest value of the coefficient is x7 and
hence x7 tends to reflect this principal component. As a result, reduction of the components in
terms of the given features is made possible (Ragsdale et.al., 2016).
Requirement for Normalisation
2
Document Page
Normalisation is a common requirement in PCA which arises as the underlying variables of
interest have different measurement scales and hence the variable which has higher values would
have a corresponding greater magnitude of variance which can provide an edge in the total
variance analysis. However, this possibility is not seen for the utility data as no variable seems to
have a very high value which undermines other variables. Also, no noticeable improvement in
PCA on scaling of data is found which implies that normalisation of data has no application for
the data provided (Han, Pei & Kamber, 2011).
(b) Advantages of PCA (John, 2014)
It is a dimensional reduction procedure which reduces large sized dataset into few
dimensional dataset.
This technique is more useful when the data variables are correlated by logical, linear
relationship.
The value of correlation coefficient between the principal component and original data
variable is zero.
This is based on the max- variance technique and hence, it rejects the variables that have low
variances.
This technique is more useful when the aim is to determine the actual structure of the data.
The visualization in PCA is considerably easier because it provides separate path to each
principal component to distribute in the m-dimensional cloud.
The magnitude of the principal component would be determined easily because PCA
provide orthogonal matrix which is easy to understand.
Disadvantage of PCA (Shumeli et. al., 2016).
The procedure of dimension reduction is based on the variance distribution of the
components. Hence, there is high possibility that PCA may remove the components which
show low variance but have statistically significance to the analysis.
This method is not effective for those variables which are showing non-linear relation.
It is essential that data are having orthogonal projection or else the determination of real
direction of component would not be easy.
This is not a useful procedure when the data are derived from separated blind source data.
When the size of orthogonal matrix is high, then the computation of prominent variance of
the principal component is a difficult task.
This is not suitable technique for the data which is distributed with distribution method rather
than Gaussian.
3
Document Page
Hard to examine the position vector in the m- dimensional because each component has their
own distinguish axis and also each of axes is exactly at the right angle of other and hence, it
creates complex structure.
Question 2
Universal Bank
Number of customers = 5000 customers
Predictors = Loan and Credit card
The objective is to determine whether the customers who are utilizing the online service of
Universal Bank and also having the credit card would also be interested to accept the personal
loan. The various factors would also be determined based on these three variables.
XLMiner tool has been taken into consideration to make partition of the dataset. Training data
would be used to make pivot tables.
(a) The requisite pivot table is highlighted below:
Representation
CC = 0 shows that customers does not have credit card and CC = 1 shows that customers have
credit card.
Online = 0 shows that customers is not user of online service and Online = 1 shows that
customers is not user of online service.
4
tabler-icon-diamond-filled.svg

Secure Best Marks with AI Grader

Need help grading? Try our AI Grader for instant feedback on your assignments.
Document Page
Loan = 0 shows that customers does not take loan and Loan = 1 shows that customers takes loan.
(b) Probability that customer will accept the loan while having online service subscription
and credit card of universal bank.
Total count of customers with having credit card and using online service (CC = 1 | Online =1) =
522
Total count of customers with having credit card and using online service would also take loan
(CC = 1 | Loan = 1, Online =1) = 51
Probability = 51 / 522 = 0.0978
There is only 9.78% probability that customers will accept loan with having credit card and
online bank service.
(c) Pivot tables are shown below:
Pivot Table 1:
Pivot Table 2:
5
Document Page
Computation of P (A|B) quantities for various cases:
(i) Proportion of customers of universal bank who has credit card and take loan offer
P ( CC=1|Loan=1 ¿
= 93/304 = 0.305
(ii) Probability (customers of universal bank are user of online service and will take
loan)
P ( Online=1|Loan=1 ¿
=183/304=0.601
(iii) Proportion (customers of universal bank who will take loan)
P ( Loan=1 )
=304/3000=0.101
(iv) Probability (customers of universal bank will not take loan , they have credit card)
Probability P ( CC=1|Loan=0¿
=800/2696=0.296
(v) Probability (customers of universal bank will not take loan however, he/she is
active user of online service)
P ( Online=1|Loan=0 ¿
=1586/2696=0.588
(vi) Probability (customers of universal bank will not take offer of loan)
P ( Loan=0 )
= 2696/3000=0.898
(d) Naïve Bayes Probability
It can be determined by taking the probabilities on which the customer of universal bank will
take loan (numerator) and the probability on which the customer of universal bank will not take
loan (conditional probabilities in denominator).
6
Document Page
P(Loan=1CC=1 , Online=1)¿ [ ( 0.3050.6010.101 )
( 0.3050.6010.101 ) + ( 0.2960.5880.898 ) ]
¿ 10.6 %
Therefore, the Naïve Bayes Probability is 10.6%.
(e) A strategy that leads to enhancement of the chances of loan offered will be the best
strategy. The calculations carried above in relation to probability under different
scenarios hint at the optimum strategy comprising of the following two necessary
conditions.
The given customer has a credit card already issued
The given customer happens to be an online bank service active user.
7
tabler-icon-diamond-filled.svg

Paraphrase This Document

Need a fresh take? Get an instant paraphrase of this document with our AI Paraphraser
Document Page
Reference
Camm, D. J., Cochran, J. J., Fry, J.M., Ohlmann, W.J., Anderson, R.D. (2016) Essentials of
Business Analytics. (5th ed.). Sydney: Cengage Learning.
Han, J., Pei, J. & Kamber, M. (2011) Data Mining: Concepts and Technique (5th ed.). London:
Elsevier.
John, W. (2014) Encyclopaedia of Business Analytics and Optimization (2nd ed.). London: IGI
Global.
Ragsdale, C. (2016) Spread sheet Modelling & Decision Analysis: A Practical Introduction to
Business Analytics (3rd ed.). Sydney: Cengage Learning.
Shumeli, G., Bruce, C. P. & Patel, R. N. (2016) Data Mining for Business Analytics: Concepts
Techniques and Application with XLMiner (4th ed.). New York: John Wiley & Sons.
8
chevron_up_icon
1 out of 8
circle_padding
hide_on_mobile
zoom_out_icon
logo.png

Your All-in-One AI-Powered Toolkit for Academic Success.

Available 24*7 on WhatsApp / Email

[object Object]