Data Mining Assessment 2 - PCA, Naive Bayes Classifier Analysis

Verified

Added on  2020/03/13

|8
|787
|58
Homework Assignment
AI Summary
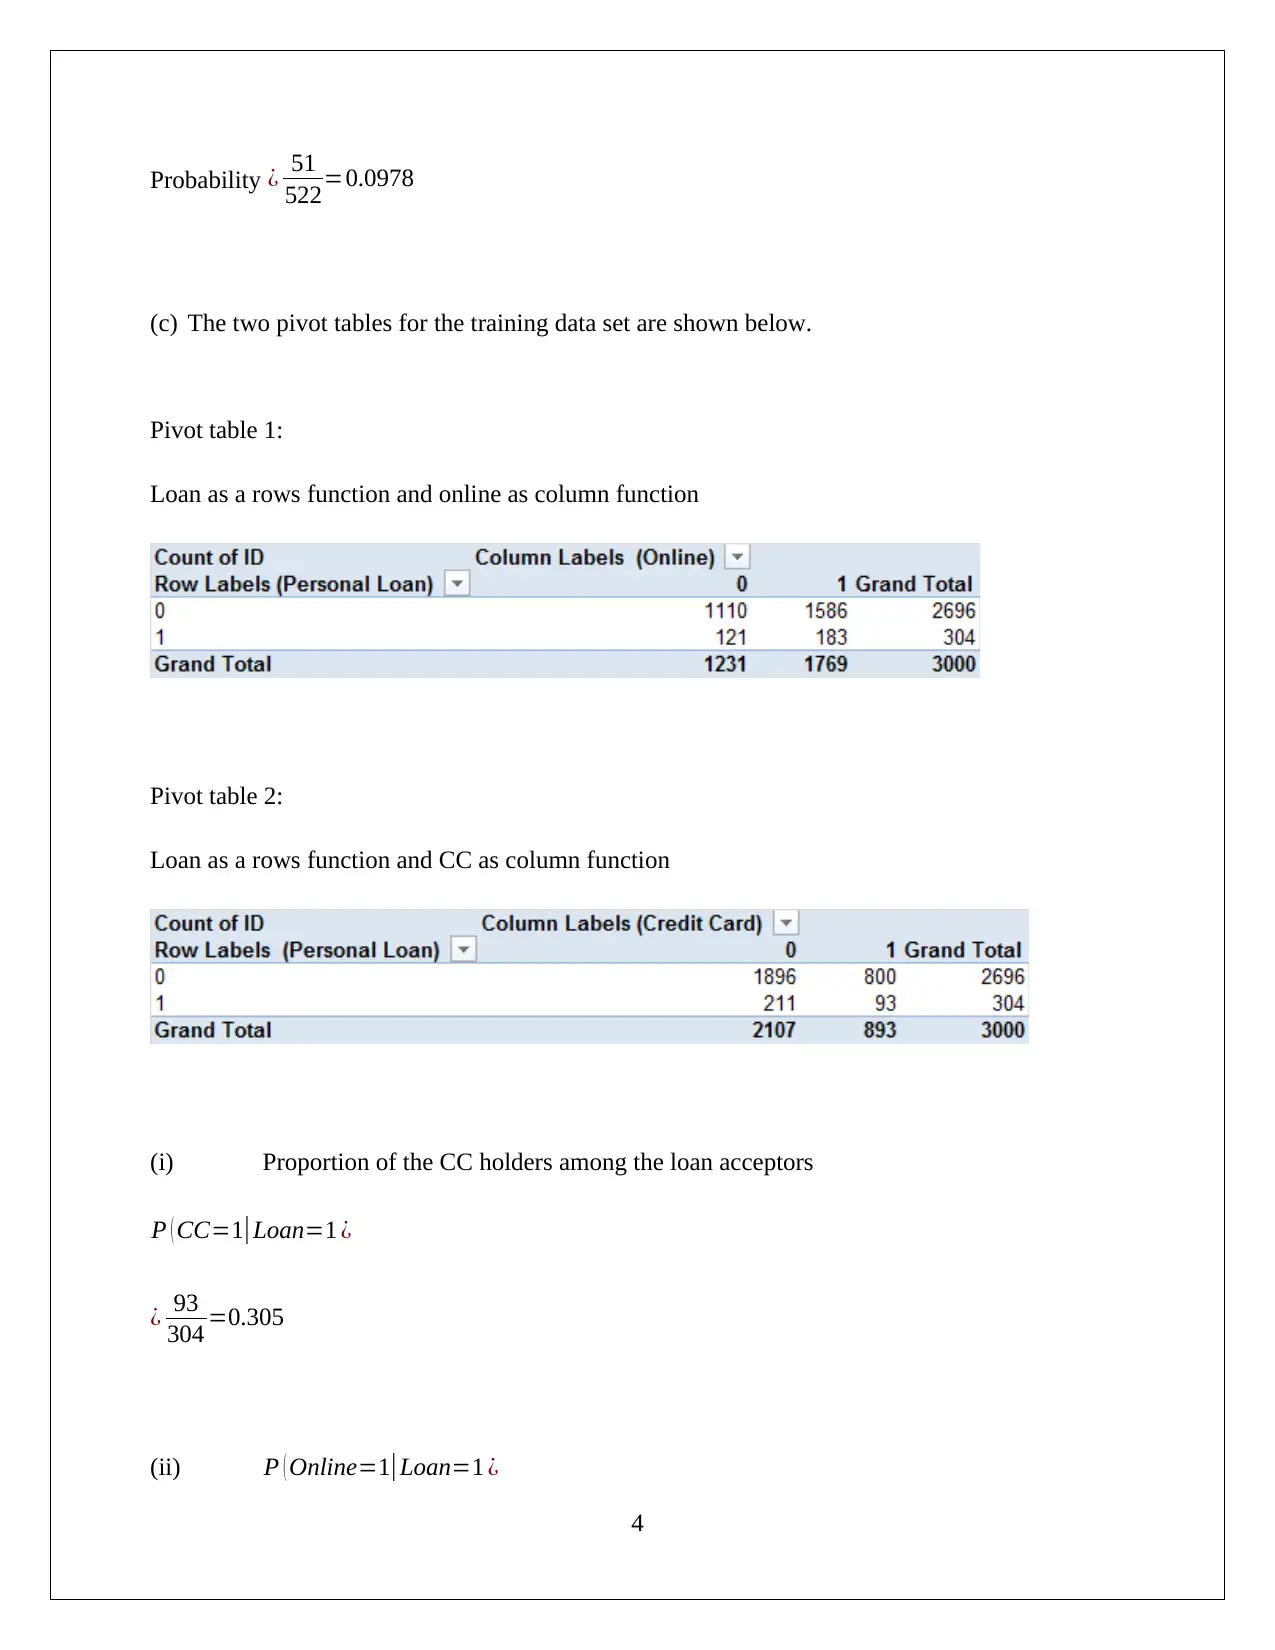
This document presents a solution to Data Mining Assessment Item 2, focusing on Principal Component Analysis (PCA) and the Naive Bayes classifier. The PCA analysis identifies key features (x2, x6, and x7) and evaluates the need for data normalization based on variance contributions. The solution demonstrates the advantages and limitations of PCA, including its applicability to Gaussian distributions. The Naive Bayes section includes pivot tables and probability calculations to predict loan acceptance based on credit card ownership and online service usage. The solution provides a strategy for loan acquisition based on the analysis of the provided data. References to relevant literature are also included.
Document Page
DATA MINING
Assessment Item 2
Student id
[Pick the date]
tabler-icon-diamond-filled.svg

Paraphrase This Document

Need a fresh take? Get an instant paraphrase of this document with our AI Paraphraser
Document Page
Question 1
(a) The principal components obtained through PCA analysis are highlighted below (Liebowitz ,
2013).
However, the variances analysis suggests that 95% of the variances are explained by top 6
principal components and hence the above matrix may be reduced to only the first six principal
components.
The respective principal components and the most significant features are outlined below.
Principal component 1 = x2
Principal component 2 = x6
Principal component 3 = x7
Principal component 4 = x3
Principal component 5 = x4
Principal component 6 = x5
1
Document Page
Considering the contribution to variances, it may be concluded that the most critical features are
x2, x6 and x7.
Data normalization is required when a large amount of variation is seen in a particular variable as
a result of which it accounts for a very high amount of variation in the PCA variance analysis.
The relevant variance analysis is highlighted below (Liebowitz , 2013).
It is evident that in the given utilities data, the first component account for only 27.16% of the
total variance and therefore variance contribution comes from the various components rather
than being contributed overwhelmingly from the first component only. Hence, normalization is
not required in the given data.
(b) The various advantages of PCA over other methods are highlighted below.
It helps in reducing a complex set of data and the multiple dimensions to only a select
few dimensions that are considered the most pivotal based on the most variance method.
Also, there is reduction in the risk related to over-fitting along with bringing down the
complexity of the computation.
The representation of components in the orthogonal form is also advantageous and
simplifies the interpretation.
The various limitations or disadvantages of PCA in comparison with other available tools are
highlighted below (Shumeli, Bruce & Patel, 2016).
It is based on the assumption of linear interrelationship between the variables through
orthogonal projections. However, if the relationships between the variables are non-
linear, then PCA tends to be not a helpful technique and other methods need to be
deployed.
2
Document Page
The underlying principle of identifying the largest variance or variation tends to be a
problem when suppressing of noise is not the objective such as in the case of blind source
separation where other techniques would need to be deployed.
Considering the importance given to mean and variance, the PCA is used only in case of
Gaussian distributions and not in case of other statistical distributions which are not
defined by mean and variance.
Question 2
Naïve Bayes Classifier
(a) The pivot table for “training data set” by taking online variable – column variable and CC
(Credit cards) as first row variable and loan (Personal loan) as secondary row variables is
shown below(Shumeli, Bruce & Patel, 2016).
(b) Probability that a customer who owns bank’s credit card and also using the bank online
services will accept the loan offer is computed below based on the above highlighted pivot
table:
From the pivot table, it is apparent that total customers who will use credit card and online
service i.e. CC = 1 and online =1 is 522.
Out of this number there are 51 customers will accept the loan i.e. CC = 1, loan = 1, online =1.
Therefore,
3
tabler-icon-diamond-filled.svg

Paraphrase This Document

Need a fresh take? Get an instant paraphrase of this document with our AI Paraphraser
Document Page
Probability ¿ 51
522=0.0978
(c) The two pivot tables for the training data set are shown below.
Pivot table 1:
Loan as a rows function and online as column function
Pivot table 2:
Loan as a rows function and CC as column function
(i) Proportion of the CC holders among the loan acceptors
P ( CC=1|Loan=1 ¿
¿ 93
304 =0.305
(ii) P ( Online=1|Loan=1 ¿
4
Document Page
¿ 183
304 =0.601
(iii) P ( Loan=1 )
Proportion of loanacceptors= 304
3000 =0.101
(iv) P ( CC=1|Loan=0¿
¿ 800
2696 =0.296
(v) P ( Online=1|Loan=0 ¿
¿ 1586
2696 =0.588
(vi) P ( Loan=0 )
¿ 2696
3000 =0.898
(d) The Naïve Bayes Probability
P ( Loan=1|CC=1 , Online=1 ¿
Probability= 0.3050.6010.101
( 0.3050.6010.101 ) +(0.2960.5880.898)
5
Document Page
¿ 0.0185
0.0185+0.156
¿ 0.0185
0.174
¿ 0.106
(e) The best possible strategy for the customers to get the loan is that one must not have credit
card and avail the online bank services. This is apparent from the lower probability of loan
for those customers who already have a credit card as the bank may consider credit card as an
additional debt or means of overspending.
6
tabler-icon-diamond-filled.svg

Paraphrase This Document

Need a fresh take? Get an instant paraphrase of this document with our AI Paraphraser
Document Page
References
Shmueli, G. Bruce, C. P. & Patel R.N. (2016) Data Mining for Business Analytics: Concepts,
Techniques, and Applications with XLMiner (3rd ed.). Sydney: John Wiley & Sons.
Liebowitz , J. (2013) Business Analytics: An Introduction (2nd ed.). Florida: CRC Press.
7
chevron_up_icon
1 out of 8
circle_padding
hide_on_mobile
zoom_out_icon
[object Object]