Data Mining Project: US Public Utilities and Customer Data

Verified

Added on  2019/10/30

|13
|1016
|163
Project
AI Summary
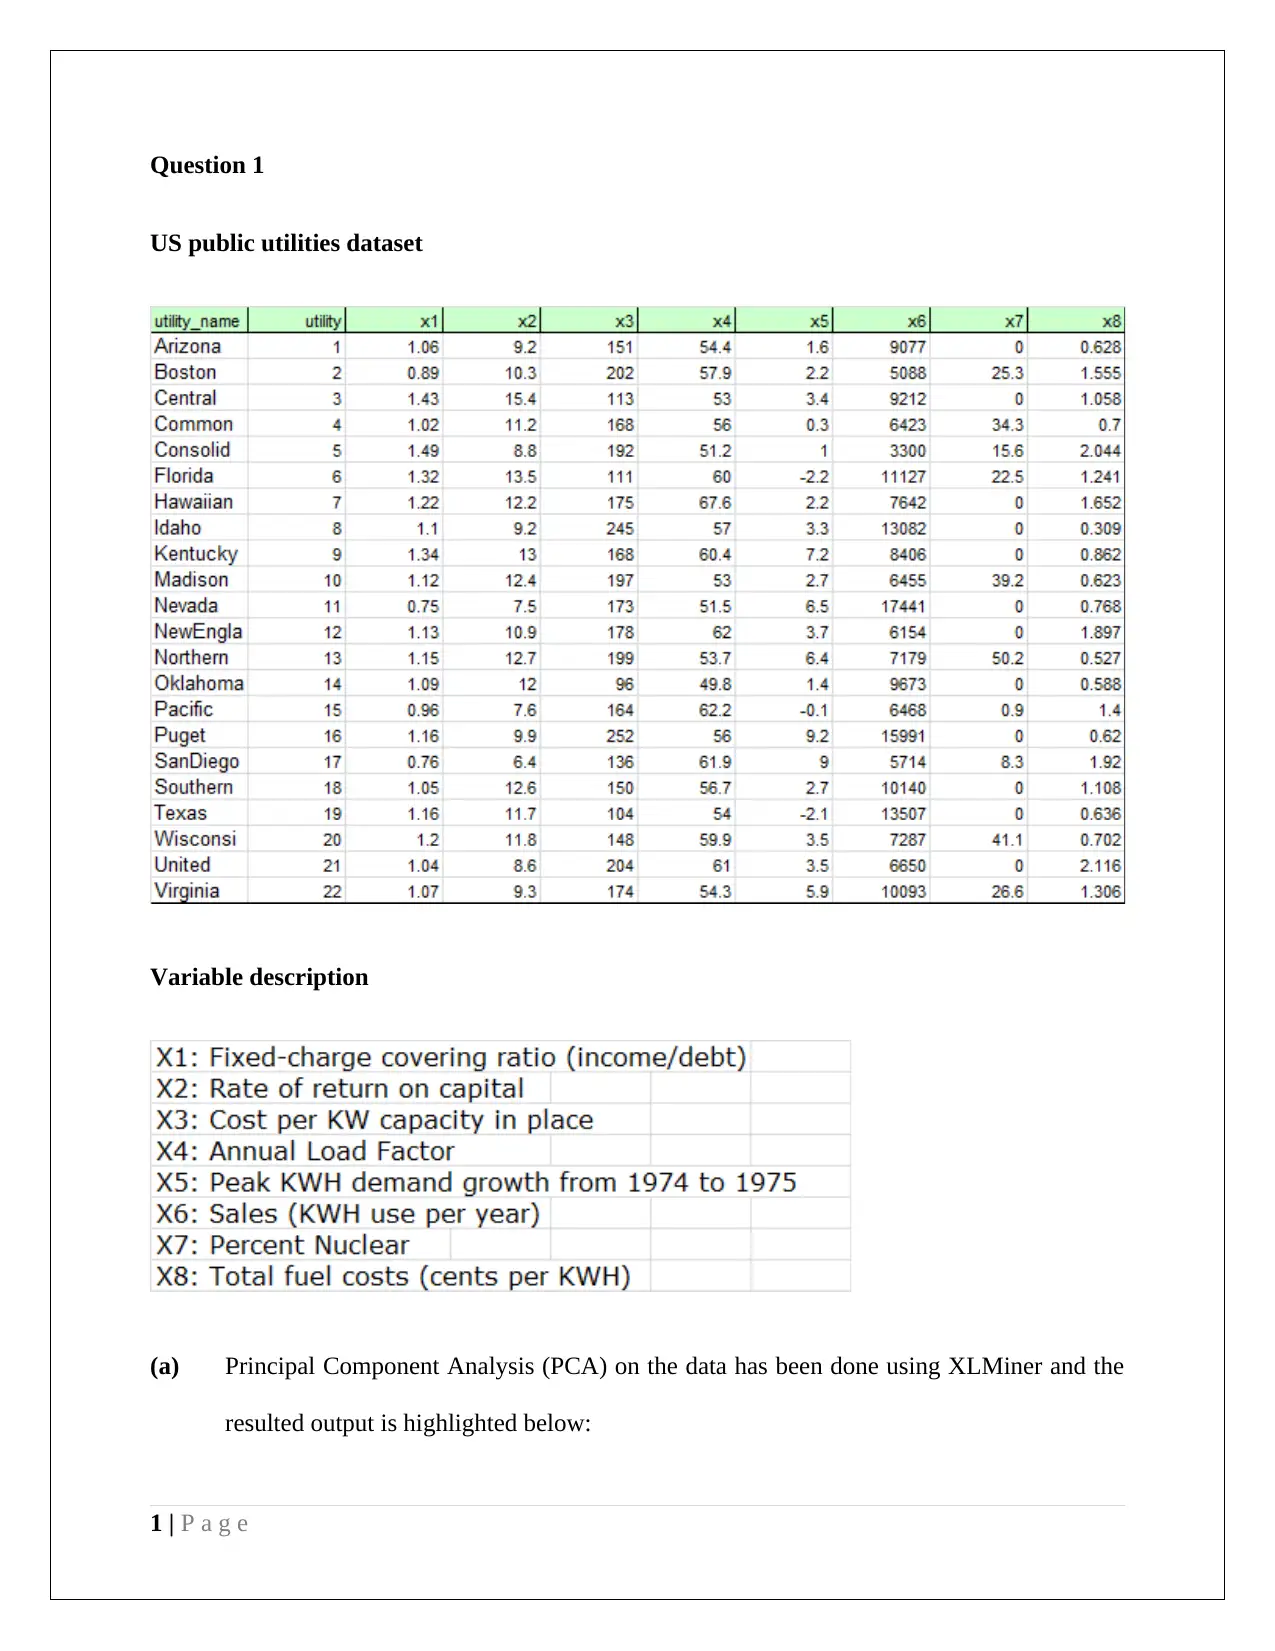
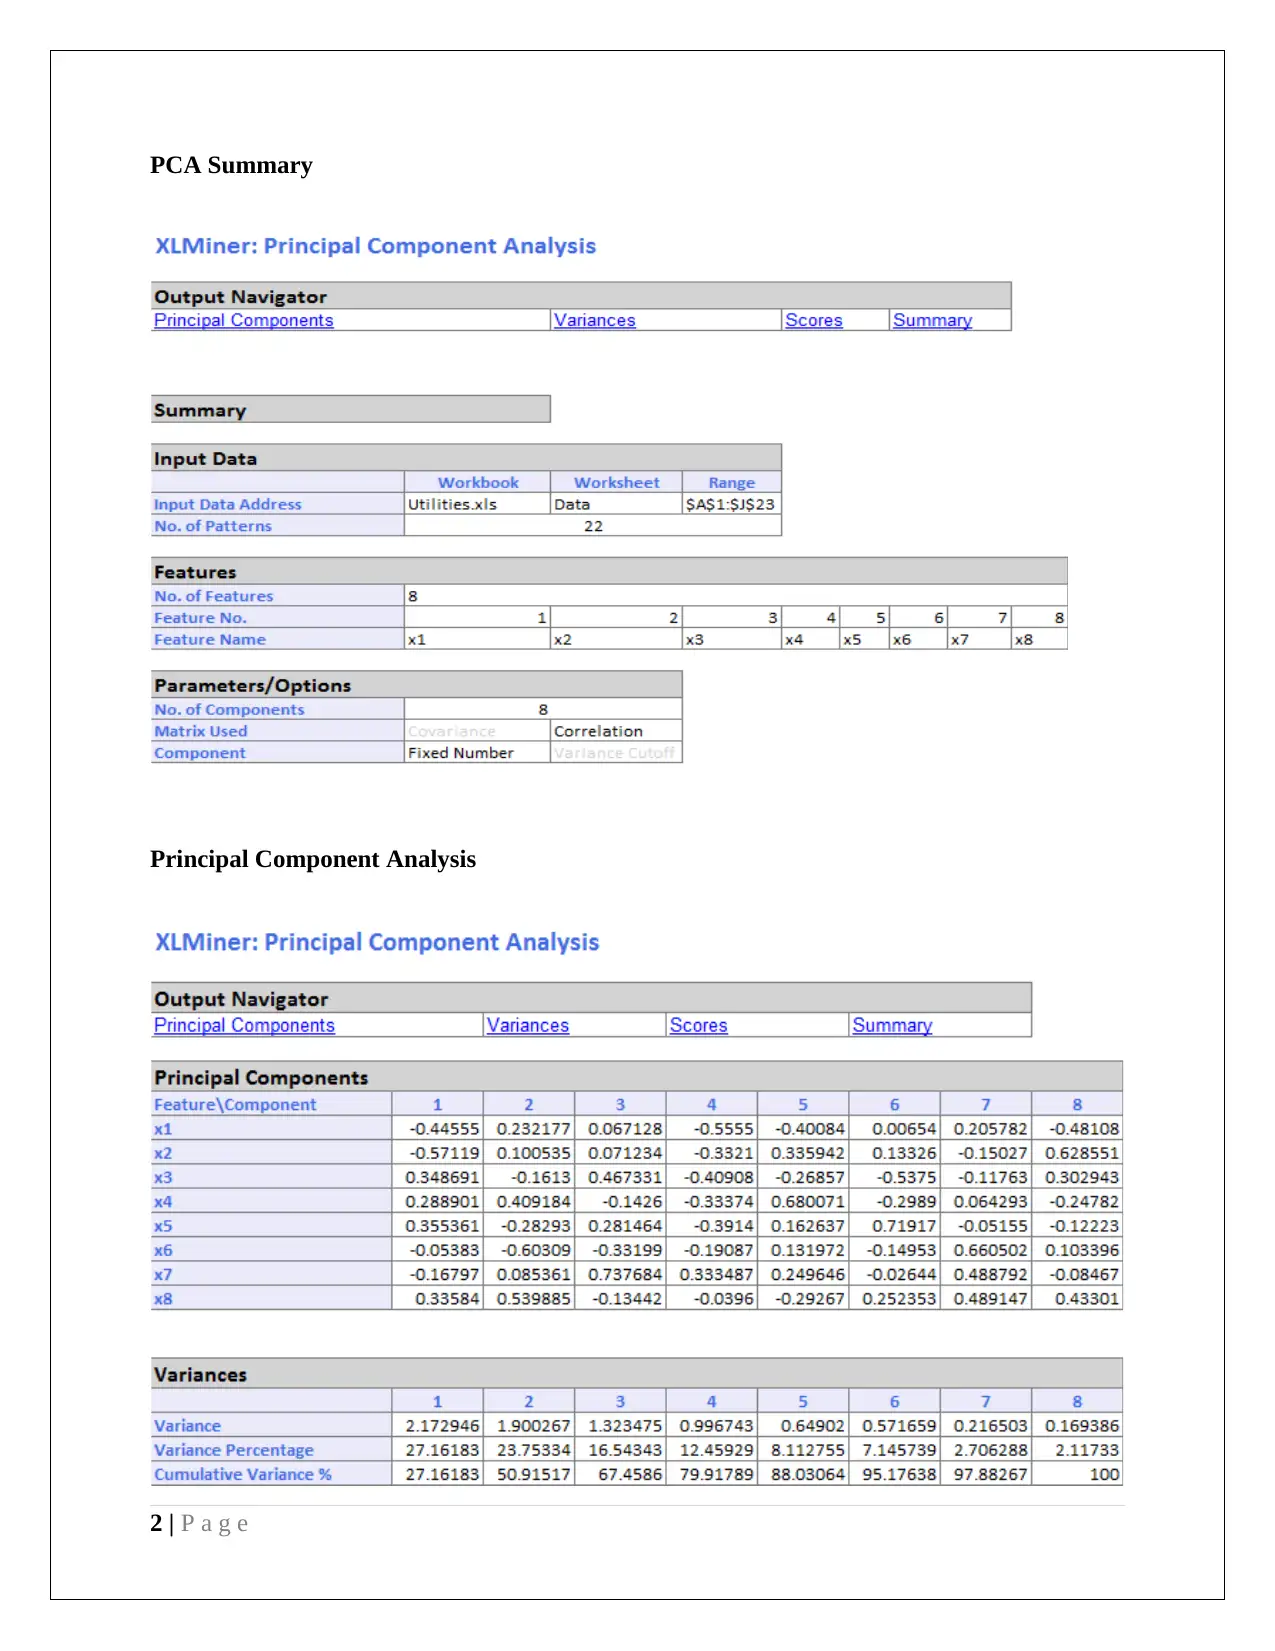
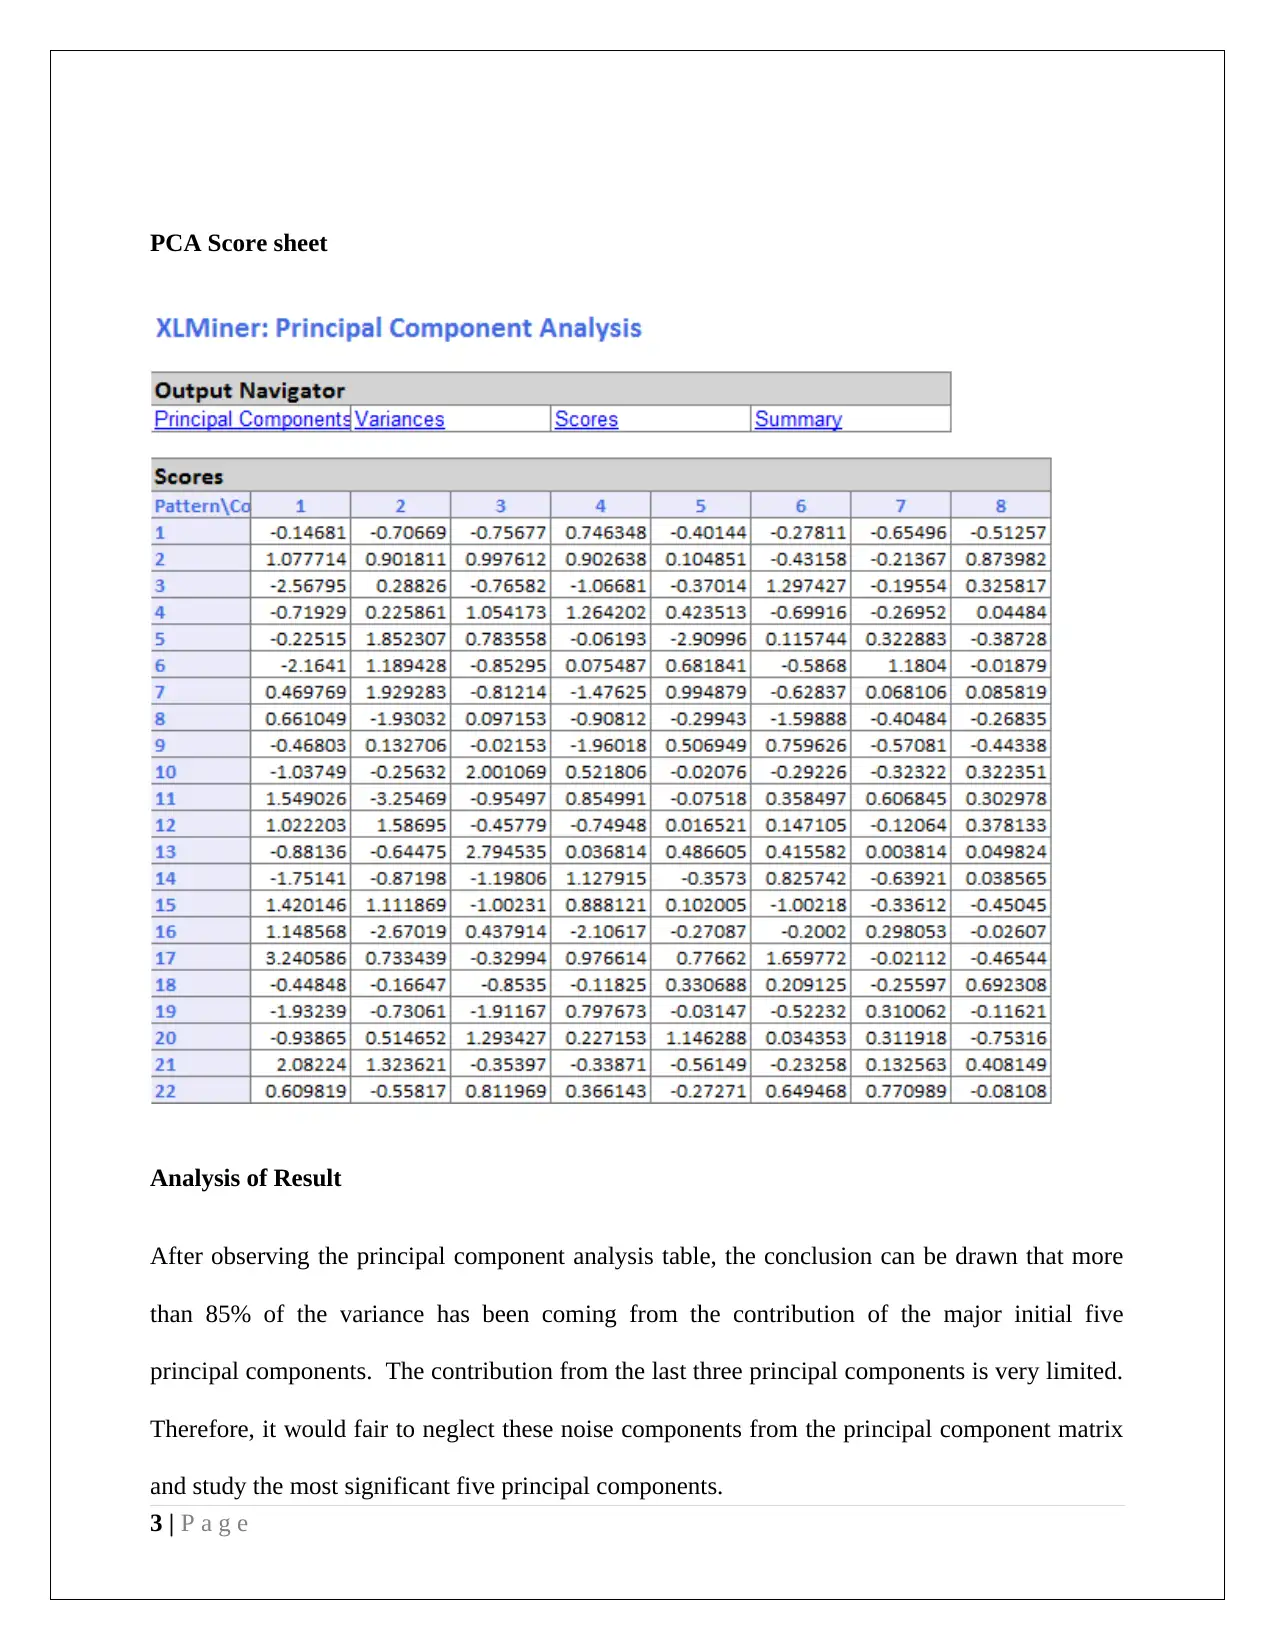
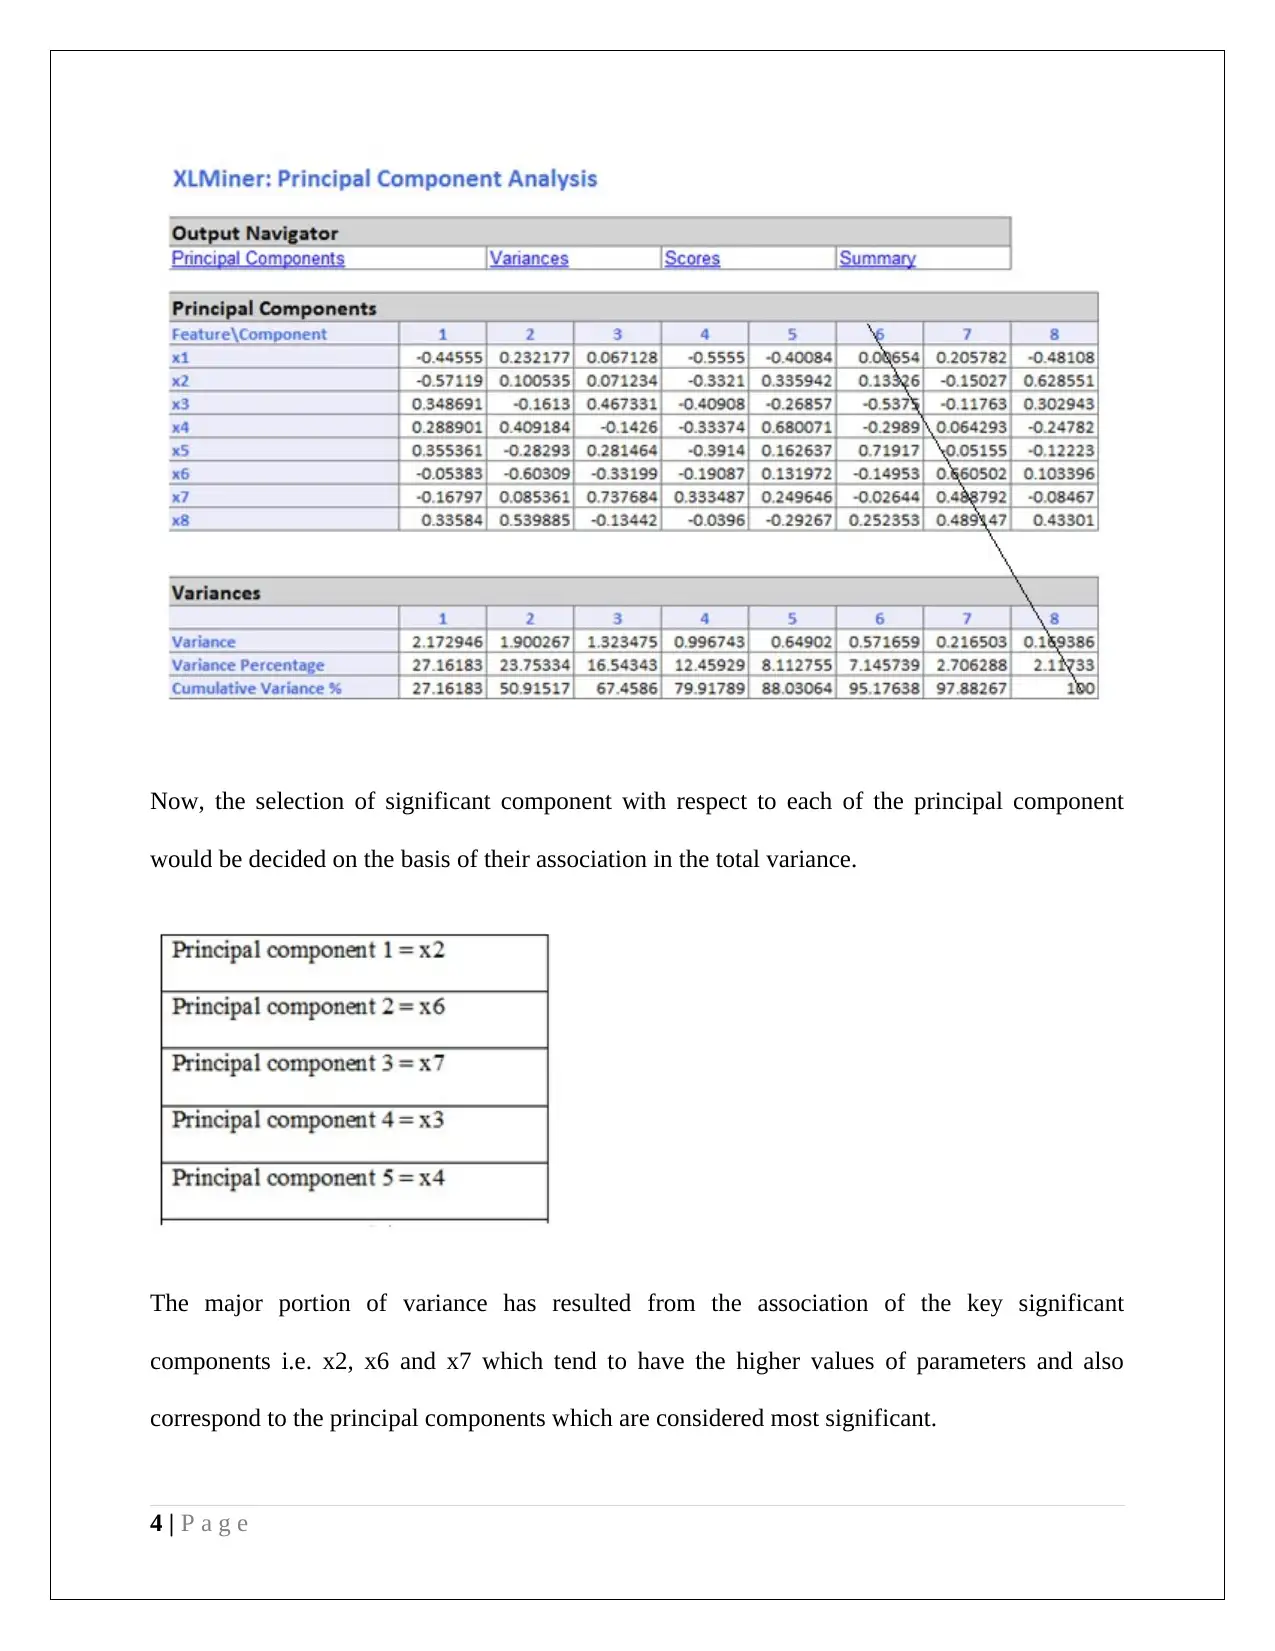
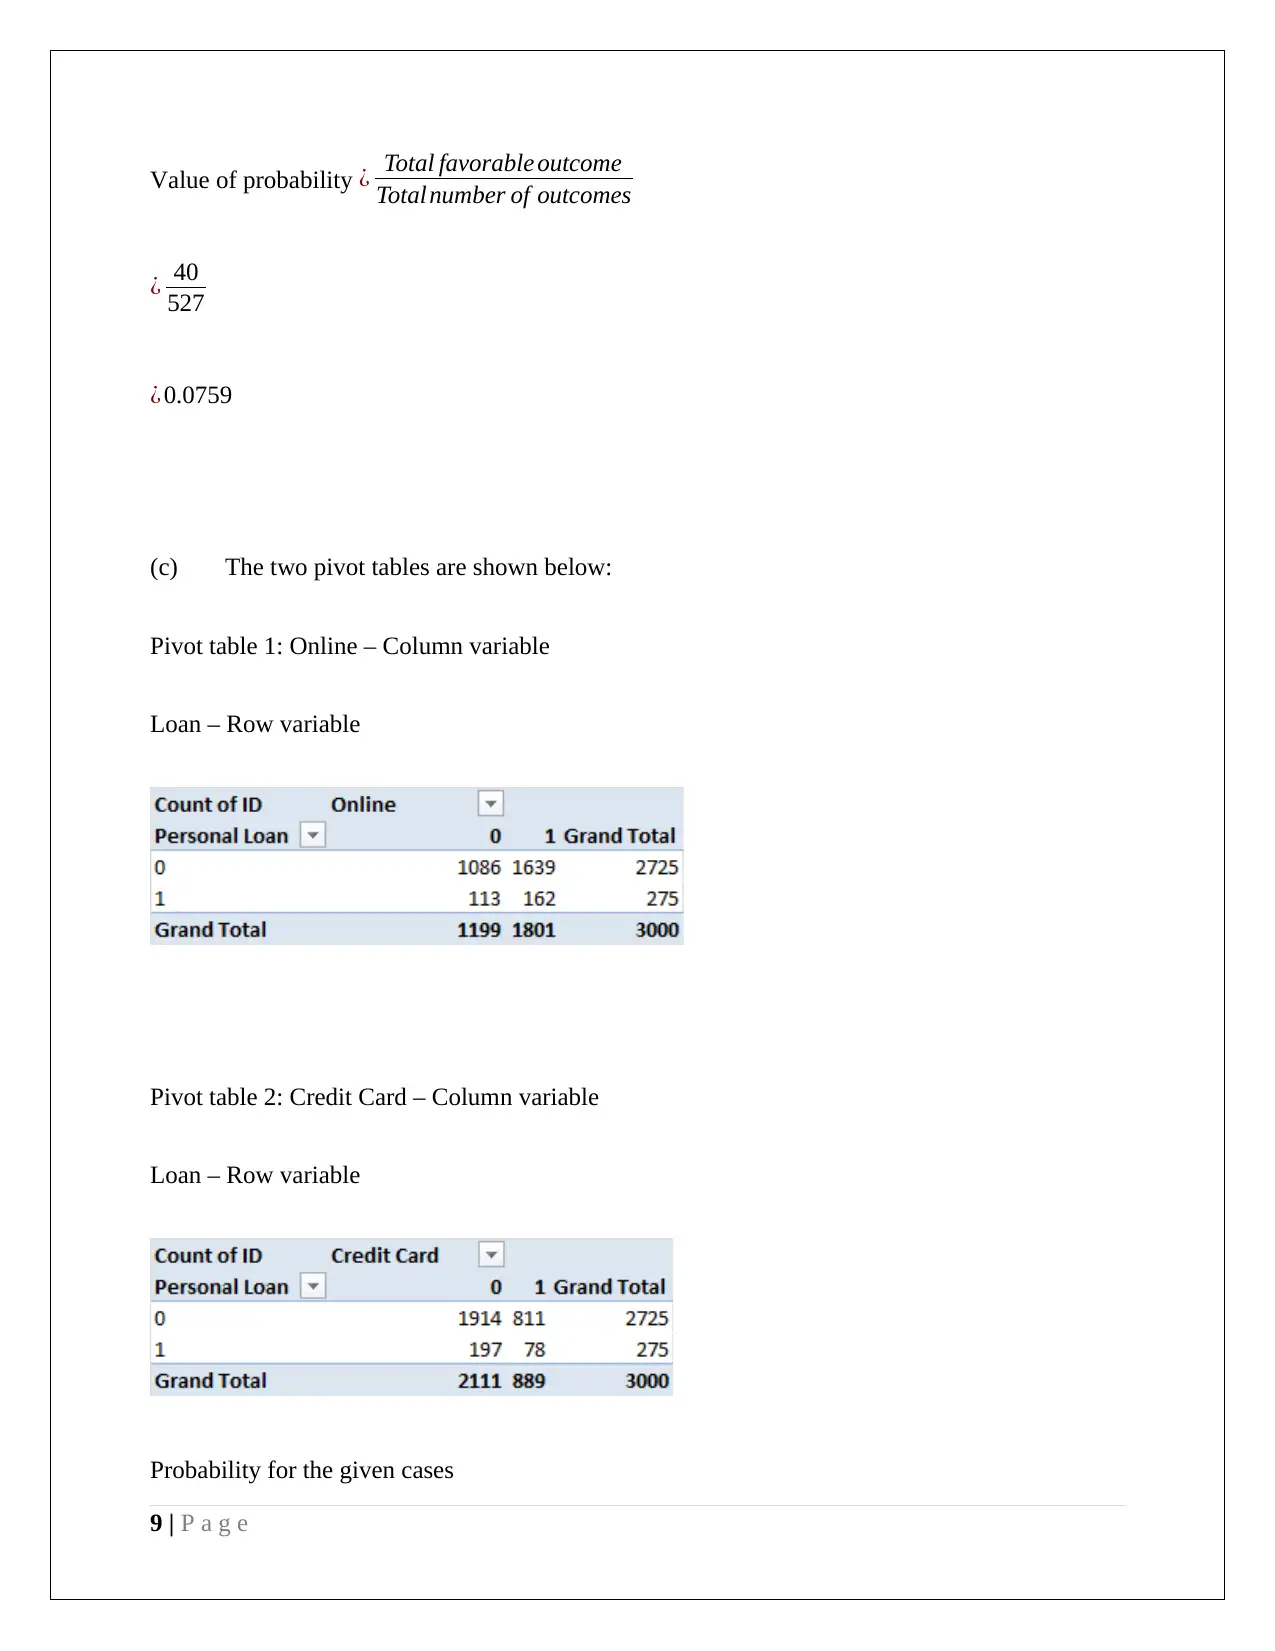
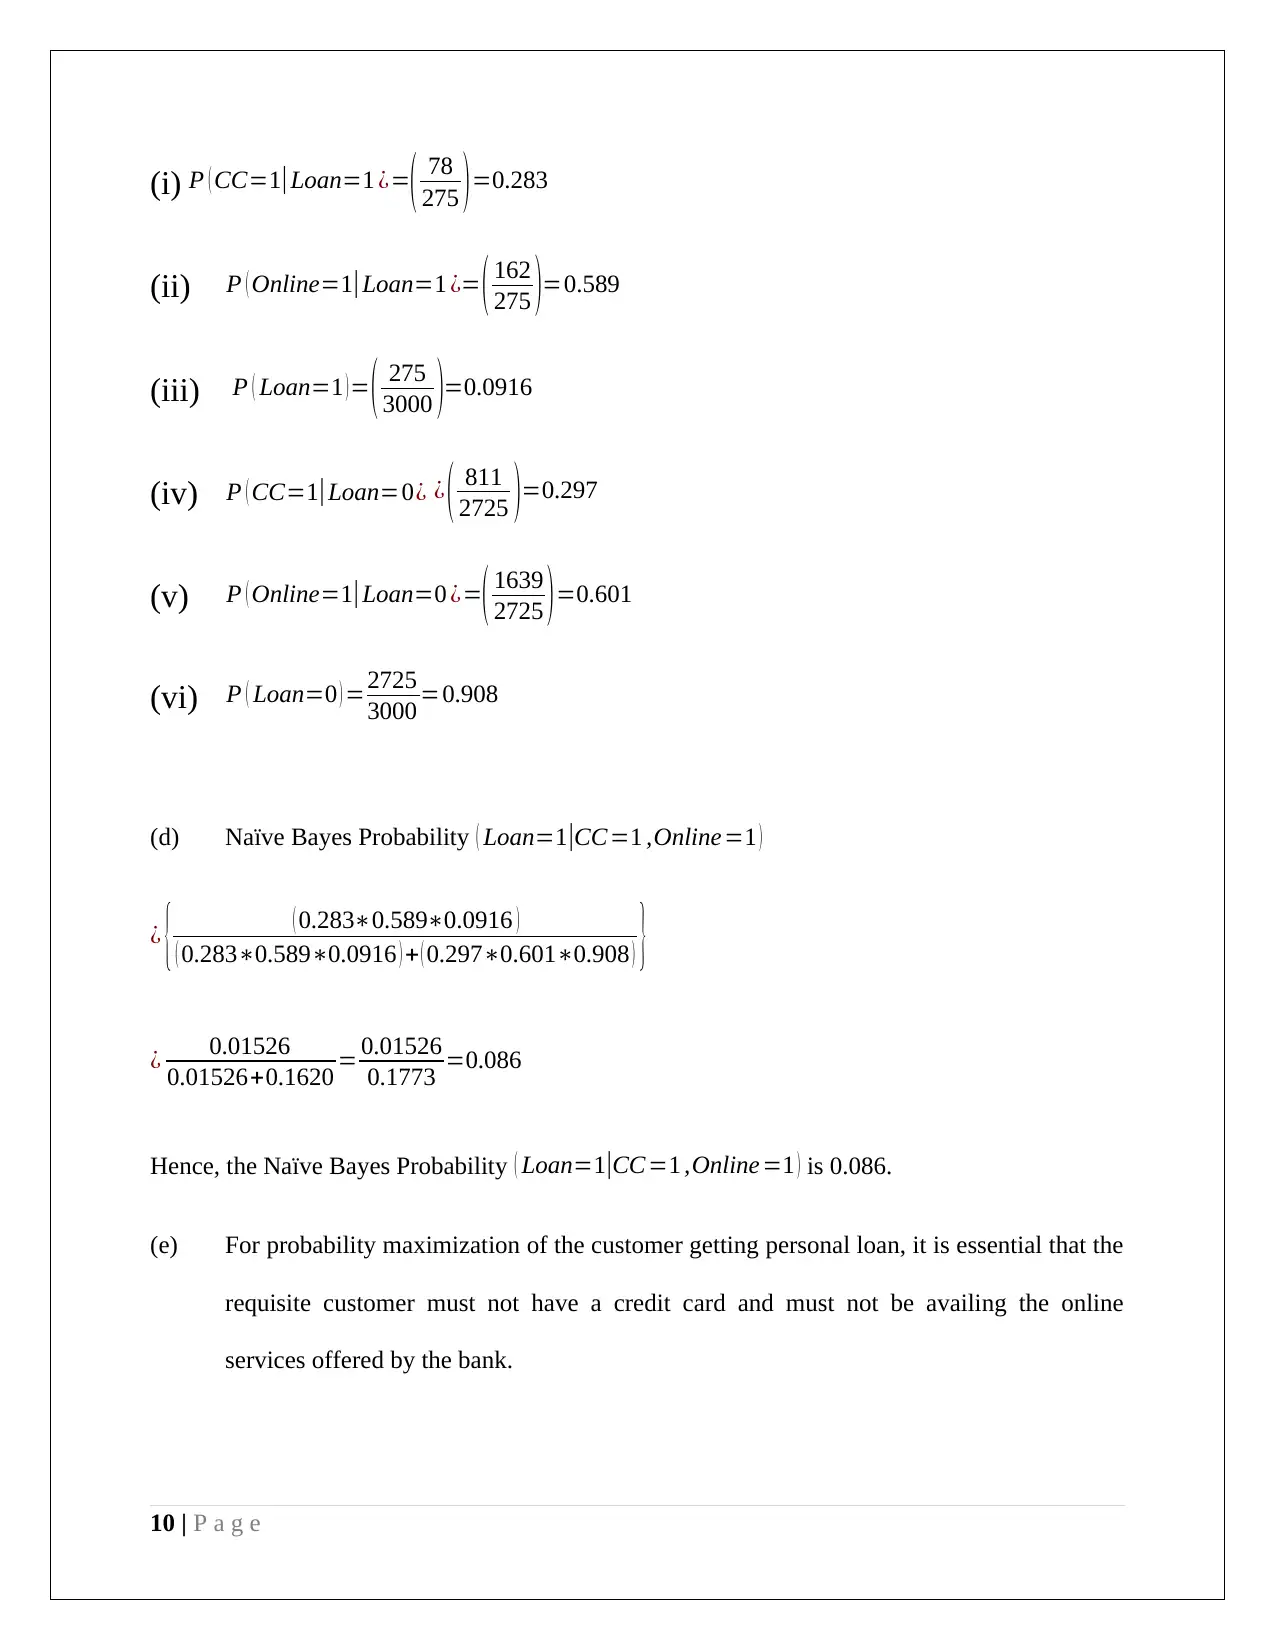
This data mining project analyzes US public utilities and customer data, employing Principal Component Analysis (PCA) and Naive Bayes methods. The PCA section examines variance contributions of principal components, identifying key variables like rate of return on capital, sales, and percent nuclear. It also discusses data normalization and the advantages/disadvantages of PCA. The second part analyzes customer data, using pivot tables to determine the probability of customers accepting personal loans based on credit card usage and online service adoption, applying Naive Bayes probability to derive insights. The analysis includes a partition of data, predictor selection, and probability calculations to maximize loan acceptance, offering a comprehensive business case analysis.
Document Page
DATA MINING
Business Case Analysis
Student Id
[Pick the date]
tabler-icon-diamond-filled.svg

Paraphrase This Document

Need a fresh take? Get an instant paraphrase of this document with our AI Paraphraser
Document Page
Question 1
US public utilities dataset
Variable description
(a) Principal Component Analysis (PCA) on the data has been done using XLMiner and the
resulted output is highlighted below:
1 | P a g e
Document Page
PCA Summary
Principal Component Analysis
2 | P a g e
Document Page
PCA Score sheet
Analysis of Result
After observing the principal component analysis table, the conclusion can be drawn that more
than 85% of the variance has been coming from the contribution of the major initial five
principal components. The contribution from the last three principal components is very limited.
Therefore, it would fair to neglect these noise components from the principal component matrix
and study the most significant five principal components.
3 | P a g e
tabler-icon-diamond-filled.svg

Paraphrase This Document

Need a fresh take? Get an instant paraphrase of this document with our AI Paraphraser
Document Page
Now, the selection of significant component with respect to each of the principal component
would be decided on the basis of their association in the total variance.
The major portion of variance has resulted from the association of the key significant
components i.e. x2, x6 and x7 which tend to have the higher values of parameters and also
correspond to the principal components which are considered most significant.
4 | P a g e
Document Page
Therefore, Rate of return on capital, Sales and percent Nuclear are the three main utility
variables among the other variables. This is because a significantly high contribution of
variances has resulted from these variables.
Data Normalization for PCA
In regards to evaluating the necessity of data normalization in PCA, it is critical to determine
whether each of the components is having some significant amount of variance contribution in
total variance or not. It is because normalized data tends to ensure that importance is provided to
a wider set of variables of the data set. However, when a large contribution in variance has
resulted only by one or two variables, then in order to discriminate this difference, data
normalization is adopted. For present data set, it is noticeable that all the principal components
are having statistically significant influence in the total variance. Also, it is evident that the value
of the maximum variance is just 27.2%, which is not considerably high and hence, the data does
not need normalization before conducting PCA analysis.
(b) Explanation regarding the advantages and disadvantages of applying PCA techniques
rather than using other statistical methods are summarized below:
List of advantages
PCA technique is mainly used to recognize the data structure.
More suitable when the data variables are related to each other with linear relationship.
PCA reduces high and complex data into simplified data
The multiple dimensional data set can be easy to reduce into variables with less dimensions
5 | P a g e
Document Page
Analysis is easier because it produces the result in orthogonal form
The newly generated variables (principal components) are having zero correlation coefficient
with the original data variables and hence, the reduced variables are showing the overall
representation of the initial original data.
It minimizes the risk of data multicollinearity in regression model, especially when the data
is selected from large population.
Data visualization is easier because it shows the components into cloud point of m-
dimensional space
List of disadvantages
It has been not found useful when the variables are showing non-linear or complex
relationship.
As m-dimensional space is used, therefore, the actual direction of component vectors seems
difficult to determine.
Separation source data cannot be analyzed through PCA method owing to the emphasis on
the highest variance.
Data with non-defined mean and variance would not be analyzed by PCA as it is more suited
to distributions captured by variance along with mean.
6 | P a g e
tabler-icon-diamond-filled.svg

Paraphrase This Document

Need a fresh take? Get an instant paraphrase of this document with our AI Paraphraser
Document Page
Question 2
Brief description
Data of 5000 customers has been given for the analysis. The data set contains 14 variables,
which show the information about the customers and the relationship between customer and
bank.
(a) The analysis needs to be performed on training data and hence, the partition of data needs
to be done.
Partition of data into would be as per validation 40% set and training 60% set The partition has
been carried out with the help of standard partition of XLMiner Analytical Tool.
The selected two predictors are highlighted below:
Online (Online bank service)
Credit card (CC)
Pivot table
Online – Column variable
CC – Row variable
Loan – Secondary row variable
7 | P a g e
Document Page
These two variables are having value either 0 or 1 which has the following meanings.
CC = 1 (Customer is holding the credit card)
CC = 0 (Customer is not holding the credit card)
Online = 1 (Customer is using the online service)
Online = 0 (Customer is not using the online service)
The objective of the analysis is to determine the customers who are ready to accept personal
loan.
Loan = 1 (Customer would ready to accept the loan)
Loan = 0 (Customer would not ready to accept the loan)
(b) “Probability that the selected customer will accept the loan offer (Loan=1) conditional on
having a credit card (CC=1) and also an active user of online service (Online =1)” =?
Total favorable outcome = 40 (CC=1 | Online =1, Loan = 1)
Total number of outcomes = 527 (CC = 1 | Online = 1)
8 | P a g e
Document Page
Value of probability ¿ Total favorable outcome
Total number of outcomes
¿ 40
527
¿ 0.0759
(c) The two pivot tables are shown below:
Pivot table 1: Online – Column variable
Loan – Row variable
Pivot table 2: Credit Card – Column variable
Loan – Row variable
Probability for the given cases
9 | P a g e
tabler-icon-diamond-filled.svg

Paraphrase This Document

Need a fresh take? Get an instant paraphrase of this document with our AI Paraphraser
Document Page
(i) P ( CC=1|Loan=1 ¿=( 78
275 )=0.283
(ii) P ( Online=1|Loan=1 ¿= ( 162
275 )=0.589
(iii) P ( Loan=1 )= ( 275
3000 )=0.0916
(iv) P ( CC=1|Loan=0¿ ¿ ( 811
2725 )=0.297
(v) P ( Online=1|Loan=0 ¿=( 1639
2725 )=0.601
(vi) P ( Loan=0 ) =2725
3000 =0.908
(d) Naïve Bayes Probability ( Loan=1|CC=1 ,Online =1 )
¿ { ( 0.2830.5890.0916 )
( 0.2830.5890.0916 ) + ( 0.2970.6010.908 ) }
¿ 0.01526
0.01526+0.1620 = 0.01526
0.1773 =0.086
Hence, the Naïve Bayes Probability ( Loan=1|CC =1 ,Online=1 ) is 0.086.
(e) For probability maximization of the customer getting personal loan, it is essential that the
requisite customer must not have a credit card and must not be availing the online
services offered by the bank.
10 | P a g e
Document Page
11 | P a g e
chevron_up_icon
1 out of 13
circle_padding
hide_on_mobile
zoom_out_icon
[object Object]