Analyzing Data Handling and Business Intelligence for Sales and Profit
VerifiedAdded on 2023/01/12
|13
|3095
|99
Report
AI Summary
This report delves into the realms of data handling and business intelligence, examining current trends in data warehousing, business intelligence, and data mining. It presents an analysis of sales and profit trends, evaluating the application of Excel for data preprocessing and analysis. The report further explores the use of Weka, illustrating its conjunction through an example and contrasting its advantages and disadvantages with Excel. Various data mining methods used in business are presented, providing a comprehensive overview of the subject matter. The report offers insights into the practical application of data analysis techniques, including the use of Weka for clustering and the interpretation of results in a business context. The analysis covers the impact of different shipment modes on sales and profit, providing a detailed examination of data analysis techniques in the context of a case study.

Data handling and business Intelligence
Paraphrase This Document
Need a fresh take? Get an instant paraphrase of this document with our AI Paraphraser
Table of Contents
INTRODUCTION...........................................................................................................................2
PART 1............................................................................................................................................2
Describing the current trend in data warehousing, business intelligence and data mining.........2
Presenting the sales and profit over the years..............................................................................3
Evaluating the use of excel for pre- processing the data, analyzing the data..............................4
PART 2............................................................................................................................................6
2.1 Providing the conjunction with Weka through an example...................................................6
2.2 Presenting the most common data mining methods used in business...................................8
2.3 Advantages and disadvantages of Weka over excel............................................................10
CONCLUSION..............................................................................................................................10
REFERENCES..............................................................................................................................12
INTRODUCTION
Business intelligence are those methods which are comply with advance technology
which actually convert raw data into a proper information in order to generate better sales for a
business. While on the other side, data handling is that process which makes sure that research
information is stored, archived and disposed off in safe manner to make sure that proper
conclusion is generated. Further, the current report is based upon the case study and provides the
importance of using Weka that helps to generate the better results. In the same way, the present
report will describe the current trends of advance technology such that Data warehousing,
business intelligence and data mining. Further, shows the decline in sales and profit through a
given data set and through an example, it also shows the conjunction with Weka. Lastly it
provide common data methods used in a business with a real world.
PART 1
Describing the current trend in data warehousing, business intelligence and data mining
In the modern era of digitalization, most of the company uses advance technology for
smoothing their business operations. In the same way, there are varieties of advance techniques
available in the market through which company run their overall operations and some of them
are as mention below:
Data Warehousing: A Data warehousing is a subject- oriented, integrated collection of
data which support management decision making process. Generally it is used for analytical
purpose and business reporting, therefore, it is a store historical data that is integrating by copies
of transaction from a disparate source (Furtado, 2020). Hence, with this advance technique,
business use real time data feeds for the report which uses the most current and integrated
information. Such that Redshift is the most popular cloud services tool from web services.
Business Intelligence: It is a process or collection of architectures and technologies who
help business to convert the input into output. This is actually used in business to help the
corporate executives, business managers and other operational workers in order to make the
work in better manner (Cheng, Zhong and Cao, 2020). On the other side, most of the company
⊘ This is a preview!⊘
Do you want full access?
Subscribe today to unlock all pages.
Trusted by 1+ million students worldwide
uses business intelligence for cost cutting purpose as well as determine the new business
opportunity so that company will take better action accordingly. In order to run the business in
better manner, companies must have a skilled labor workforce and IT specialist who must
possess SQL programming, Problem solving techniques etc.
Data Mining: It is the process which is used by the companies in order to turn the raw
data into useful information. Thus, it is a process of findings pattern as well as correlations
within large data sets for predicts outcomes. Its main goal is to extract information from a data
set and also transform the information into a structural manner (Roiger, 2017). Thus, through this
software, most of the companies uses more about their customers in order to develop more
effective marketing strategies which in turn assist to increases sales and decrease cost as well.
Thus, it is consider one of the most important advance technique that is used by most of the
company to remain viable and top in competition.
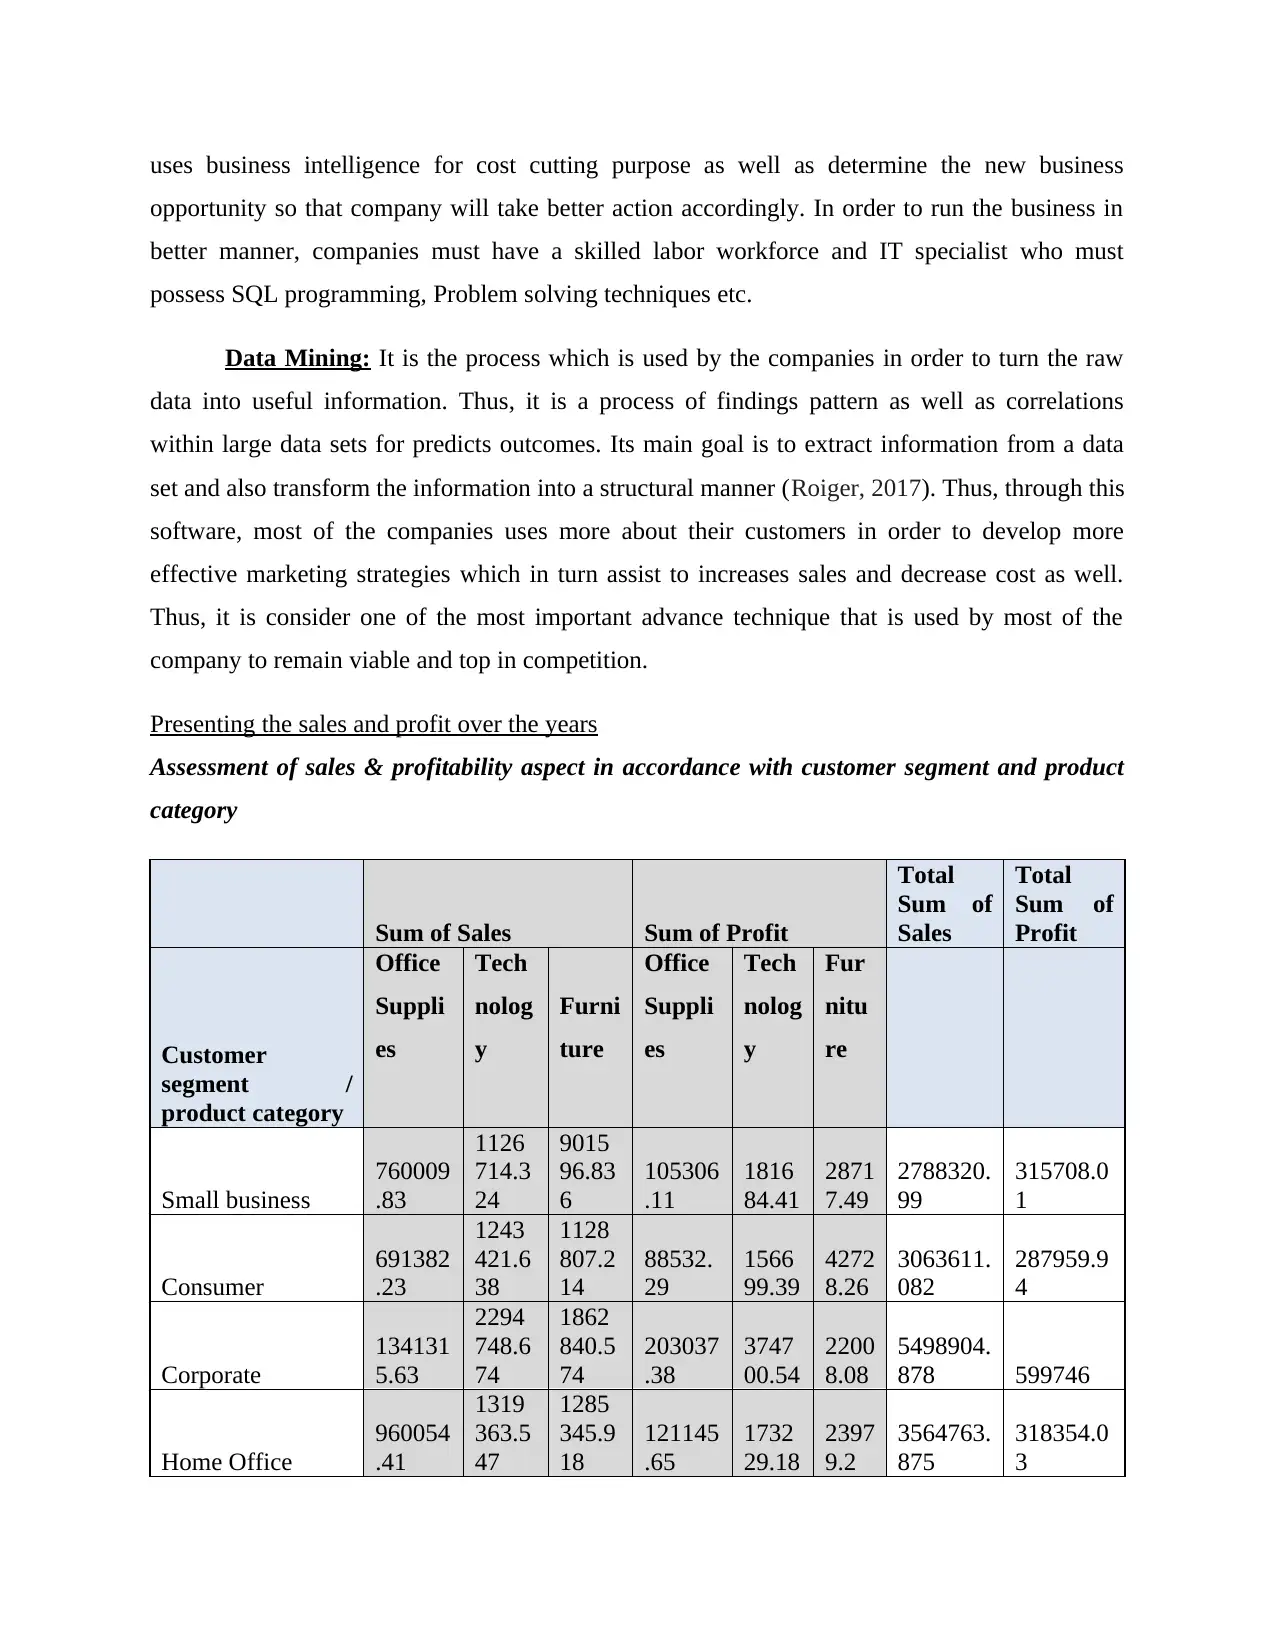
Presenting the sales and profit over the years
Assessment of sales & profitability aspect in accordance with customer segment and product
category
Sum of Sales Sum of Profit
Total
Sum of
Sales
Total
Sum of
Profit
Customer
segment /
product category
Office
Suppli
es
Tech
nolog
y
Furni
ture
Office
Suppli
es
Tech
nolog
y
Fur
nitu
re
Small business
760009
.83
1126
714.3
24
9015
96.83
6
105306
.11
1816
84.41
2871
7.49
2788320.
99
315708.0
1
Consumer
691382
.23
1243
421.6
38
1128
807.2
14
88532.
29
1566
99.39
4272
8.26
3063611.
082
287959.9
4
Corporate
134131
5.63
2294
748.6
74
1862
840.5
74
203037
.38
3747
00.54
2200
8.08
5498904.
878 599746
Home Office
960054
.41
1319
363.5
47
1285
345.9
18
121145
.65
1732
29.18
2397
9.2
3564763.
875
318354.0
3
opportunity so that company will take better action accordingly. In order to run the business in
better manner, companies must have a skilled labor workforce and IT specialist who must
possess SQL programming, Problem solving techniques etc.
Data Mining: It is the process which is used by the companies in order to turn the raw
data into useful information. Thus, it is a process of findings pattern as well as correlations
within large data sets for predicts outcomes. Its main goal is to extract information from a data
set and also transform the information into a structural manner (Roiger, 2017). Thus, through this
software, most of the companies uses more about their customers in order to develop more
effective marketing strategies which in turn assist to increases sales and decrease cost as well.
Thus, it is consider one of the most important advance technique that is used by most of the
company to remain viable and top in competition.
Presenting the sales and profit over the years
Assessment of sales & profitability aspect in accordance with customer segment and product
category
Sum of Sales Sum of Profit
Total
Sum of
Sales
Total
Sum of
Profit
Customer
segment /
product category
Office
Suppli
es
Tech
nolog
y
Furni
ture
Office
Suppli
es
Tech
nolog
y
Fur
nitu
re
Small business
760009
.83
1126
714.3
24
9015
96.83
6
105306
.11
1816
84.41
2871
7.49
2788320.
99
315708.0
1
Consumer
691382
.23
1243
421.6
38
1128
807.2
14
88532.
29
1566
99.39
4272
8.26
3063611.
082
287959.9
4
Corporate
134131
5.63
2294
748.6
74
1862
840.5
74
203037
.38
3747
00.54
2200
8.08
5498904.
878 599746
Home Office
960054
.41
1319
363.5
47
1285
345.9
18
121145
.65
1732
29.18
2397
9.2
3564763.
875
318354.0
3
Paraphrase This Document
Need a fresh take? Get an instant paraphrase of this document with our AI Paraphraser
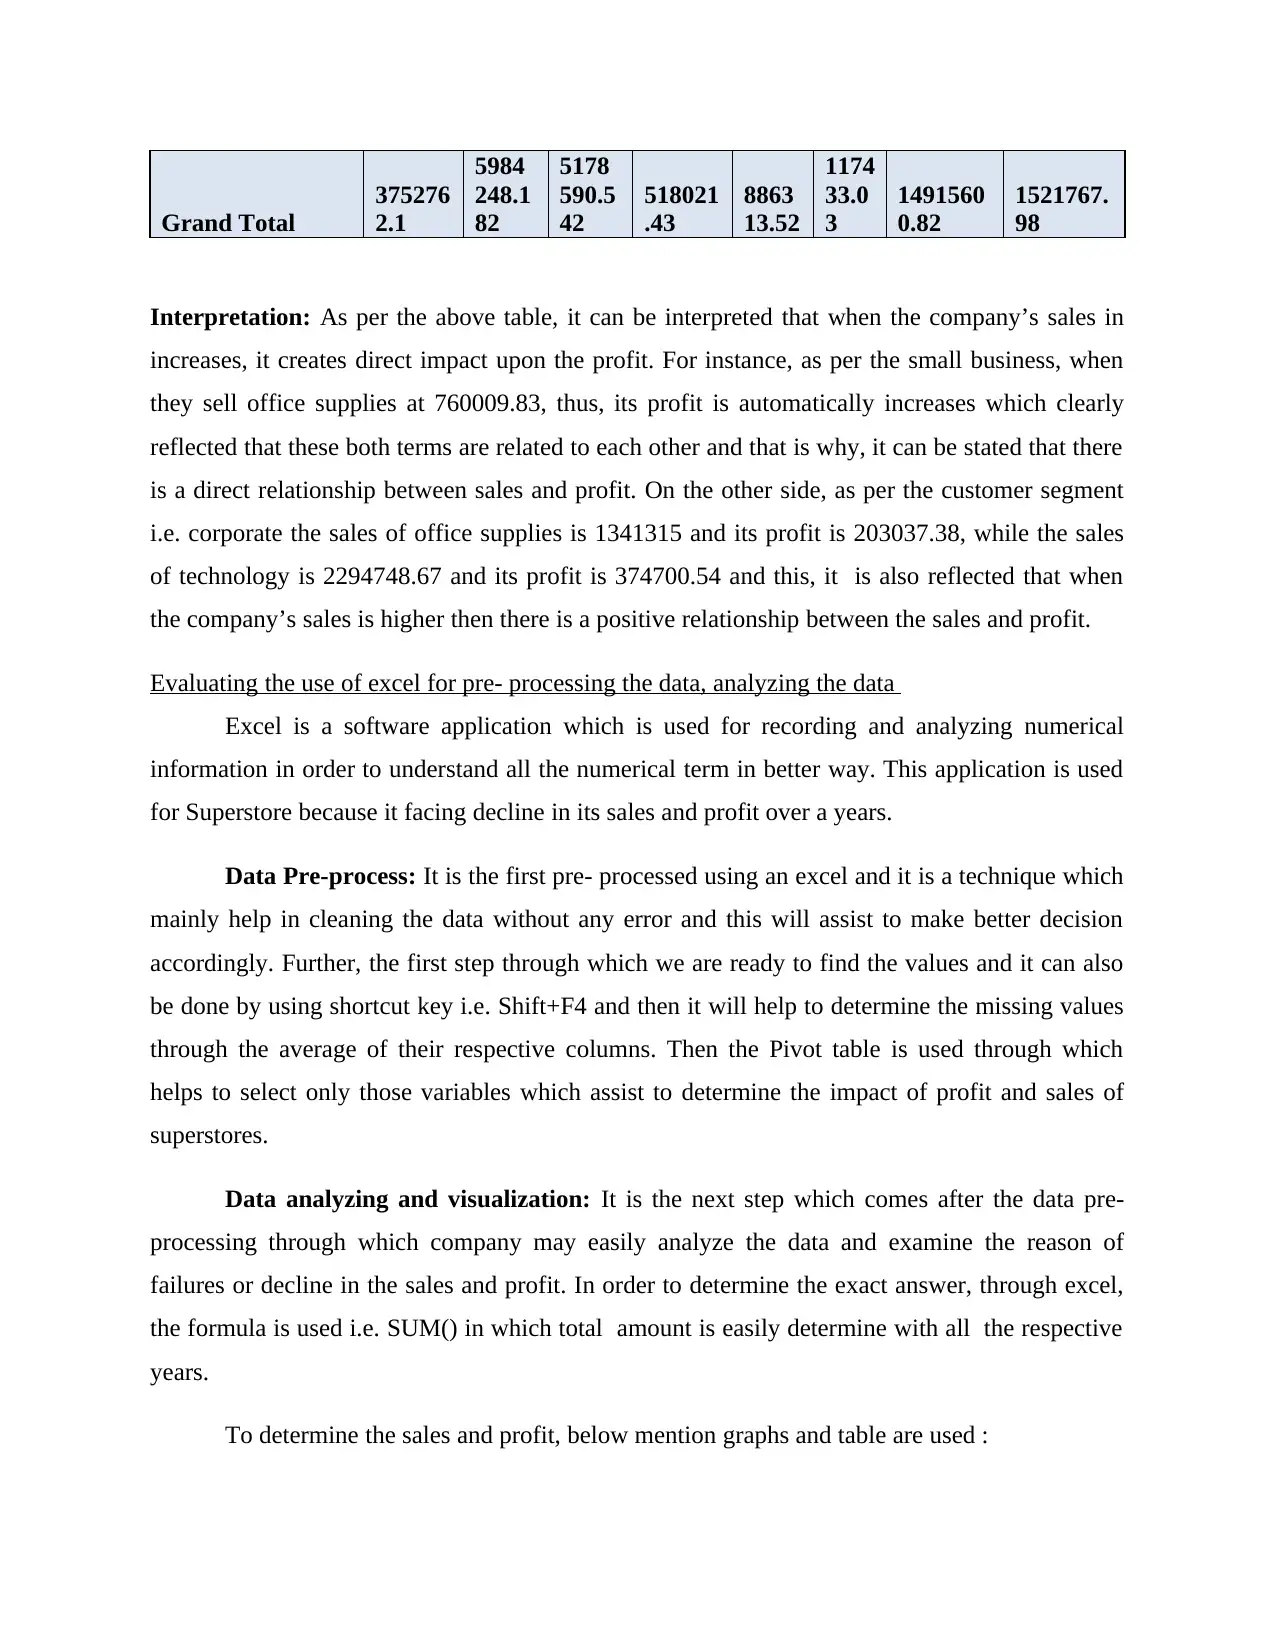
Grand Total
375276
2.1
5984
248.1
82
5178
590.5
42
518021
.43
8863
13.52
1174
33.0
3
1491560
0.82
1521767.
98
Interpretation: As per the above table, it can be interpreted that when the company’s sales in
increases, it creates direct impact upon the profit. For instance, as per the small business, when
they sell office supplies at 760009.83, thus, its profit is automatically increases which clearly
reflected that these both terms are related to each other and that is why, it can be stated that there
is a direct relationship between sales and profit. On the other side, as per the customer segment
i.e. corporate the sales of office supplies is 1341315 and its profit is 203037.38, while the sales
of technology is 2294748.67 and its profit is 374700.54 and this, it is also reflected that when
the company’s sales is higher then there is a positive relationship between the sales and profit.
Evaluating the use of excel for pre- processing the data, analyzing the data
Excel is a software application which is used for recording and analyzing numerical
information in order to understand all the numerical term in better way. This application is used
for Superstore because it facing decline in its sales and profit over a years.
Data Pre-process: It is the first pre- processed using an excel and it is a technique which
mainly help in cleaning the data without any error and this will assist to make better decision
accordingly. Further, the first step through which we are ready to find the values and it can also
be done by using shortcut key i.e. Shift+F4 and then it will help to determine the missing values
through the average of their respective columns. Then the Pivot table is used through which
helps to select only those variables which assist to determine the impact of profit and sales of
superstores.
Data analyzing and visualization: It is the next step which comes after the data pre-
processing through which company may easily analyze the data and examine the reason of
failures or decline in the sales and profit. In order to determine the exact answer, through excel,
the formula is used i.e. SUM() in which total amount is easily determine with all the respective
years.
To determine the sales and profit, below mention graphs and table are used :
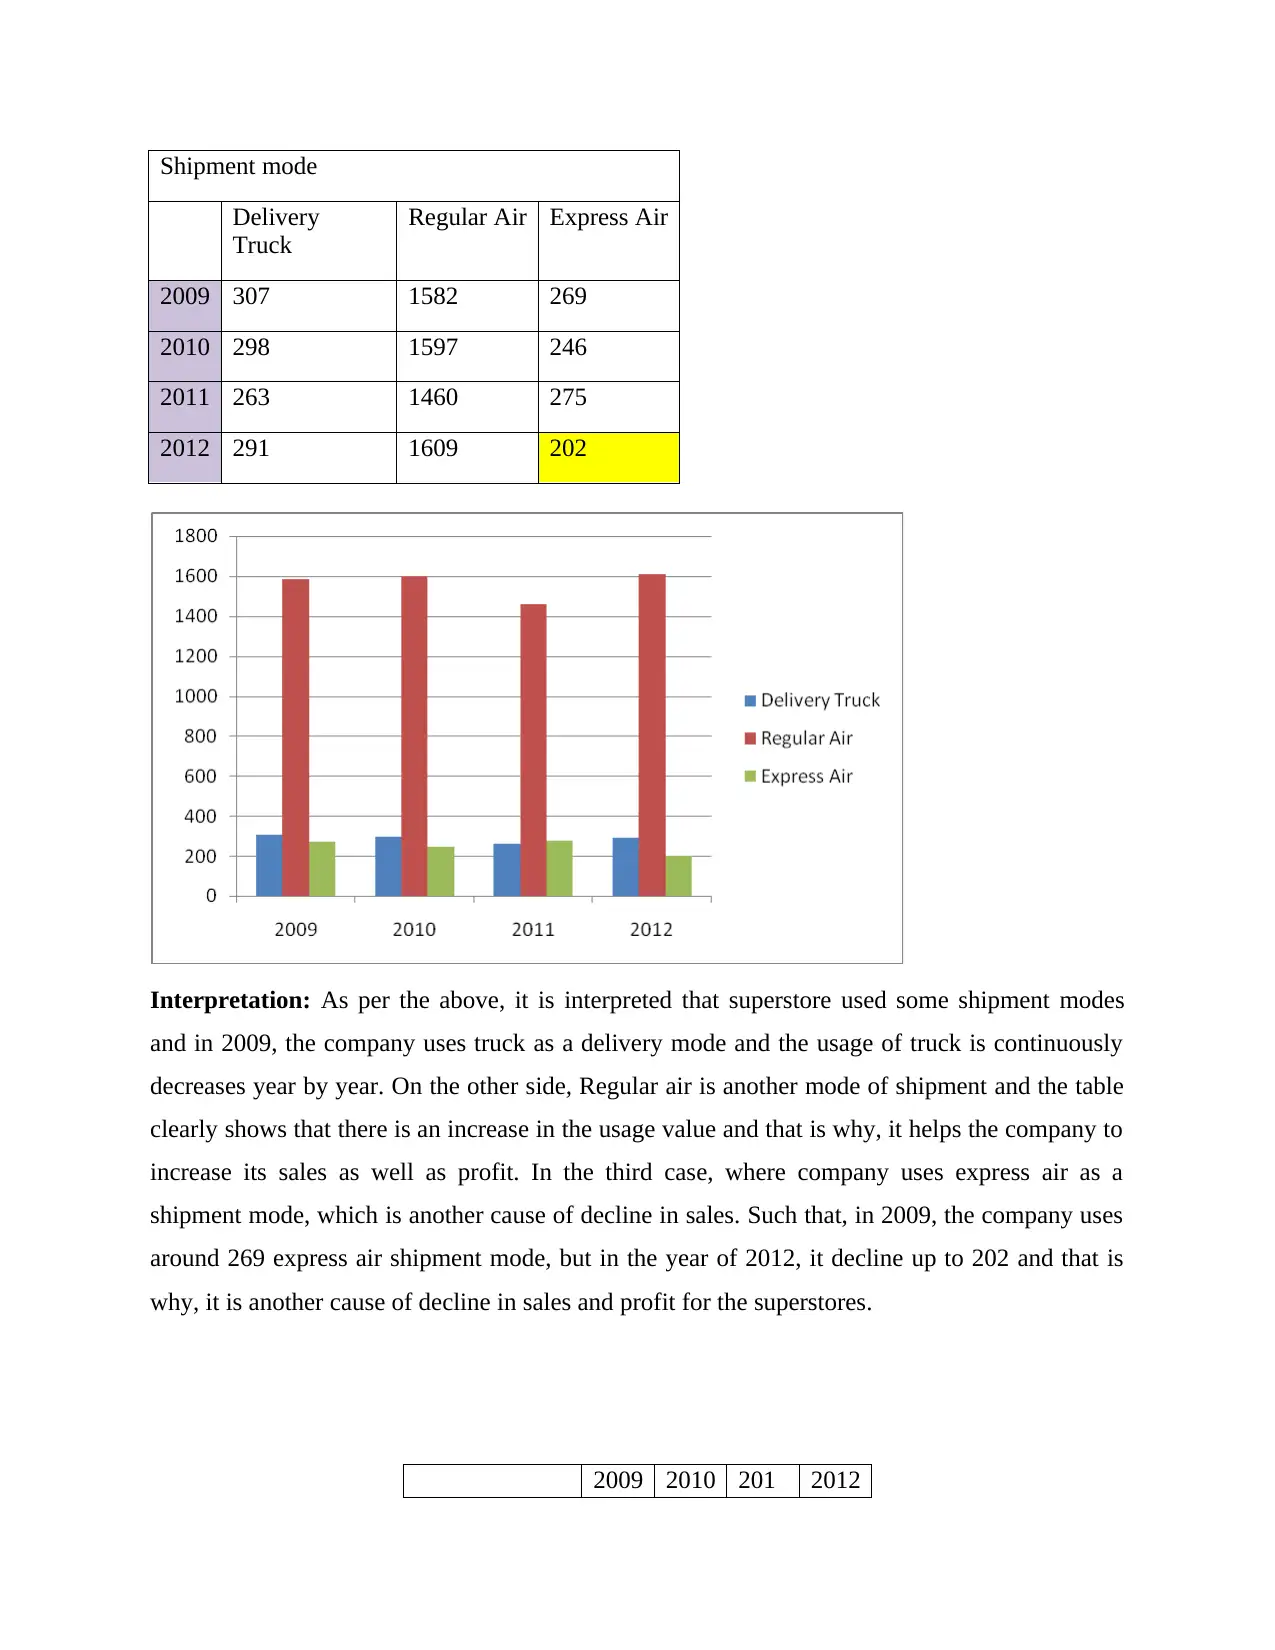
Shipment mode
Delivery
Truck
Regular Air Express Air
2009 307 1582 269
2010 298 1597 246
2011 263 1460 275
2012 291 1609 202
Interpretation: As per the above, it is interpreted that superstore used some shipment modes
and in 2009, the company uses truck as a delivery mode and the usage of truck is continuously
decreases year by year. On the other side, Regular air is another mode of shipment and the table
clearly shows that there is an increase in the usage value and that is why, it helps the company to
increase its sales as well as profit. In the third case, where company uses express air as a
shipment mode, which is another cause of decline in sales. Such that, in 2009, the company uses
around 269 express air shipment mode, but in the year of 2012, it decline up to 202 and that is
why, it is another cause of decline in sales and profit for the superstores.
2009 2010 201 2012
⊘ This is a preview!⊘
Do you want full access?
Subscribe today to unlock all pages.
Trusted by 1+ million students worldwide
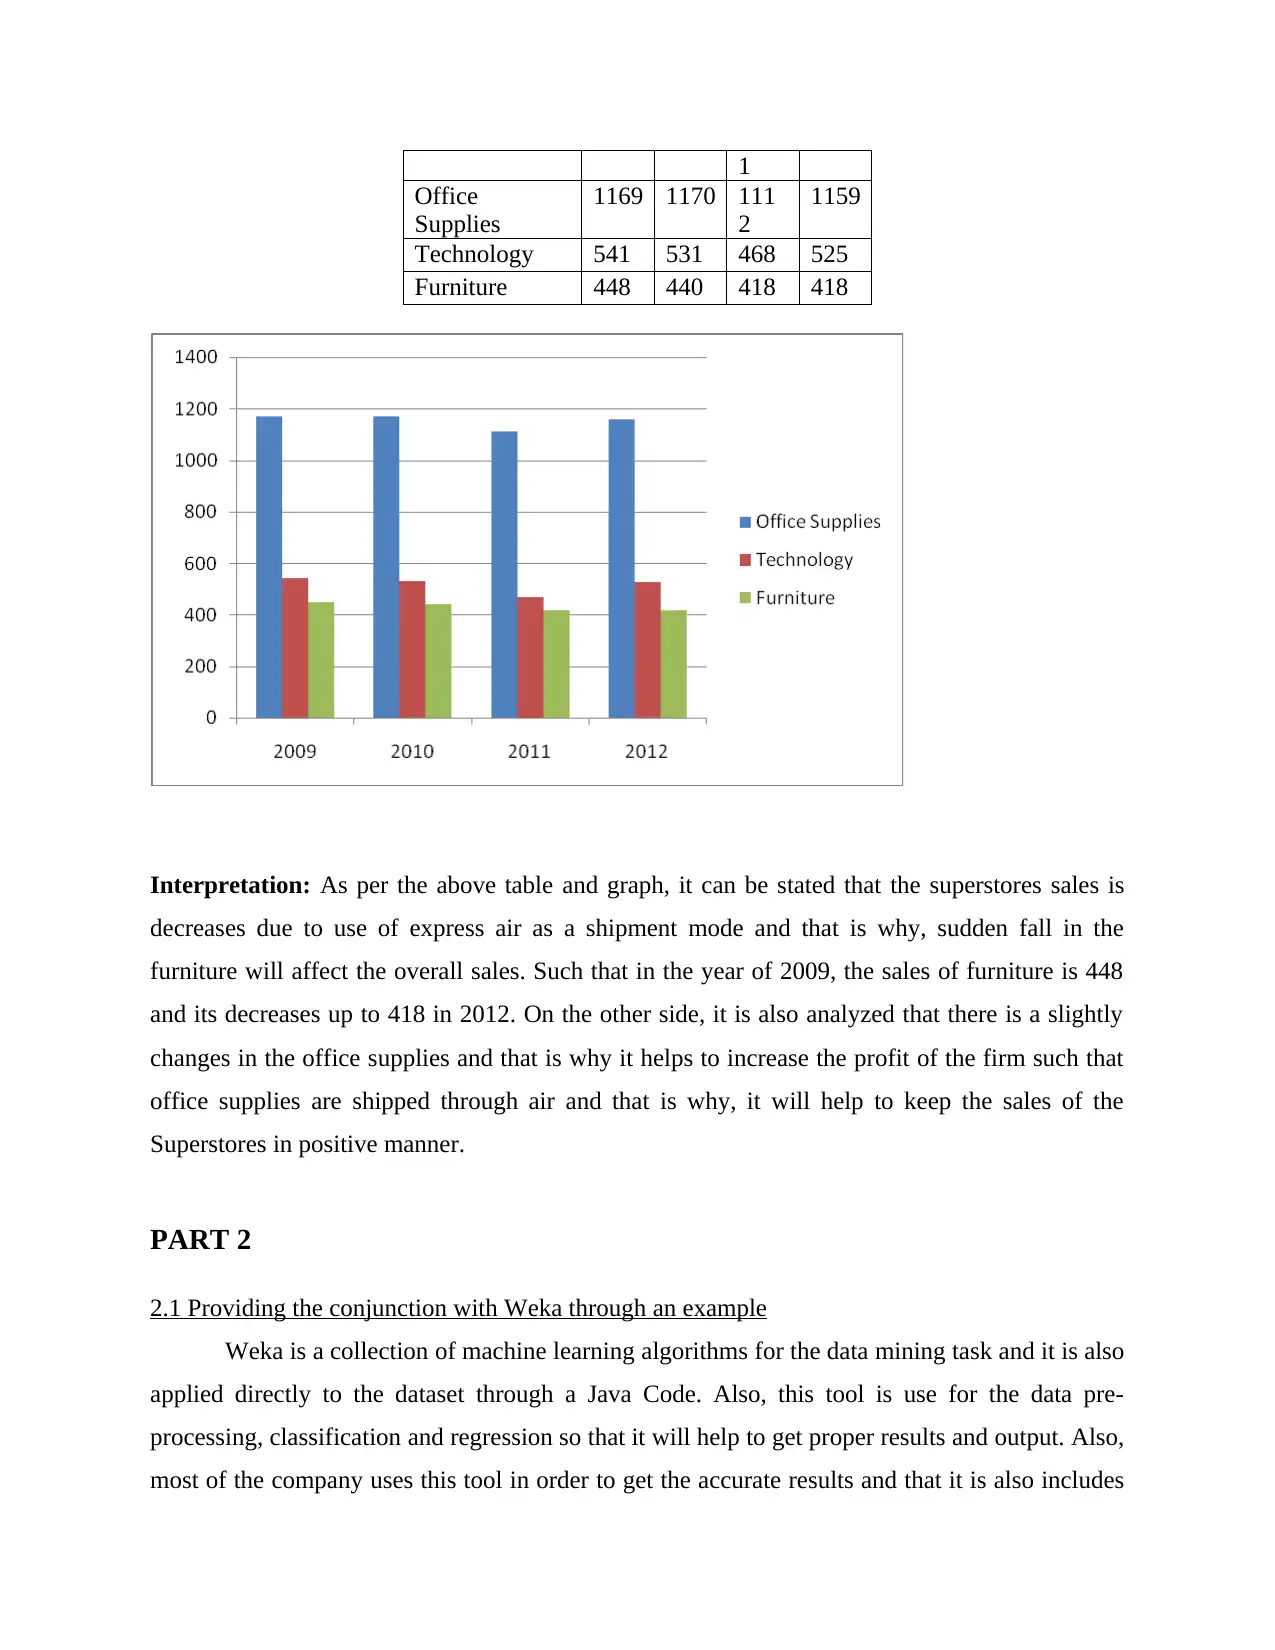
1
Office
Supplies
1169 1170 111
2
1159
Technology 541 531 468 525
Furniture 448 440 418 418
Interpretation: As per the above table and graph, it can be stated that the superstores sales is
decreases due to use of express air as a shipment mode and that is why, sudden fall in the
furniture will affect the overall sales. Such that in the year of 2009, the sales of furniture is 448
and its decreases up to 418 in 2012. On the other side, it is also analyzed that there is a slightly
changes in the office supplies and that is why it helps to increase the profit of the firm such that
office supplies are shipped through air and that is why, it will help to keep the sales of the
Superstores in positive manner.
PART 2
2.1 Providing the conjunction with Weka through an example
Weka is a collection of machine learning algorithms for the data mining task and it is also
applied directly to the dataset through a Java Code. Also, this tool is use for the data pre-
processing, classification and regression so that it will help to get proper results and output. Also,
most of the company uses this tool in order to get the accurate results and that it is also includes
Paraphrase This Document
Need a fresh take? Get an instant paraphrase of this document with our AI Paraphraser
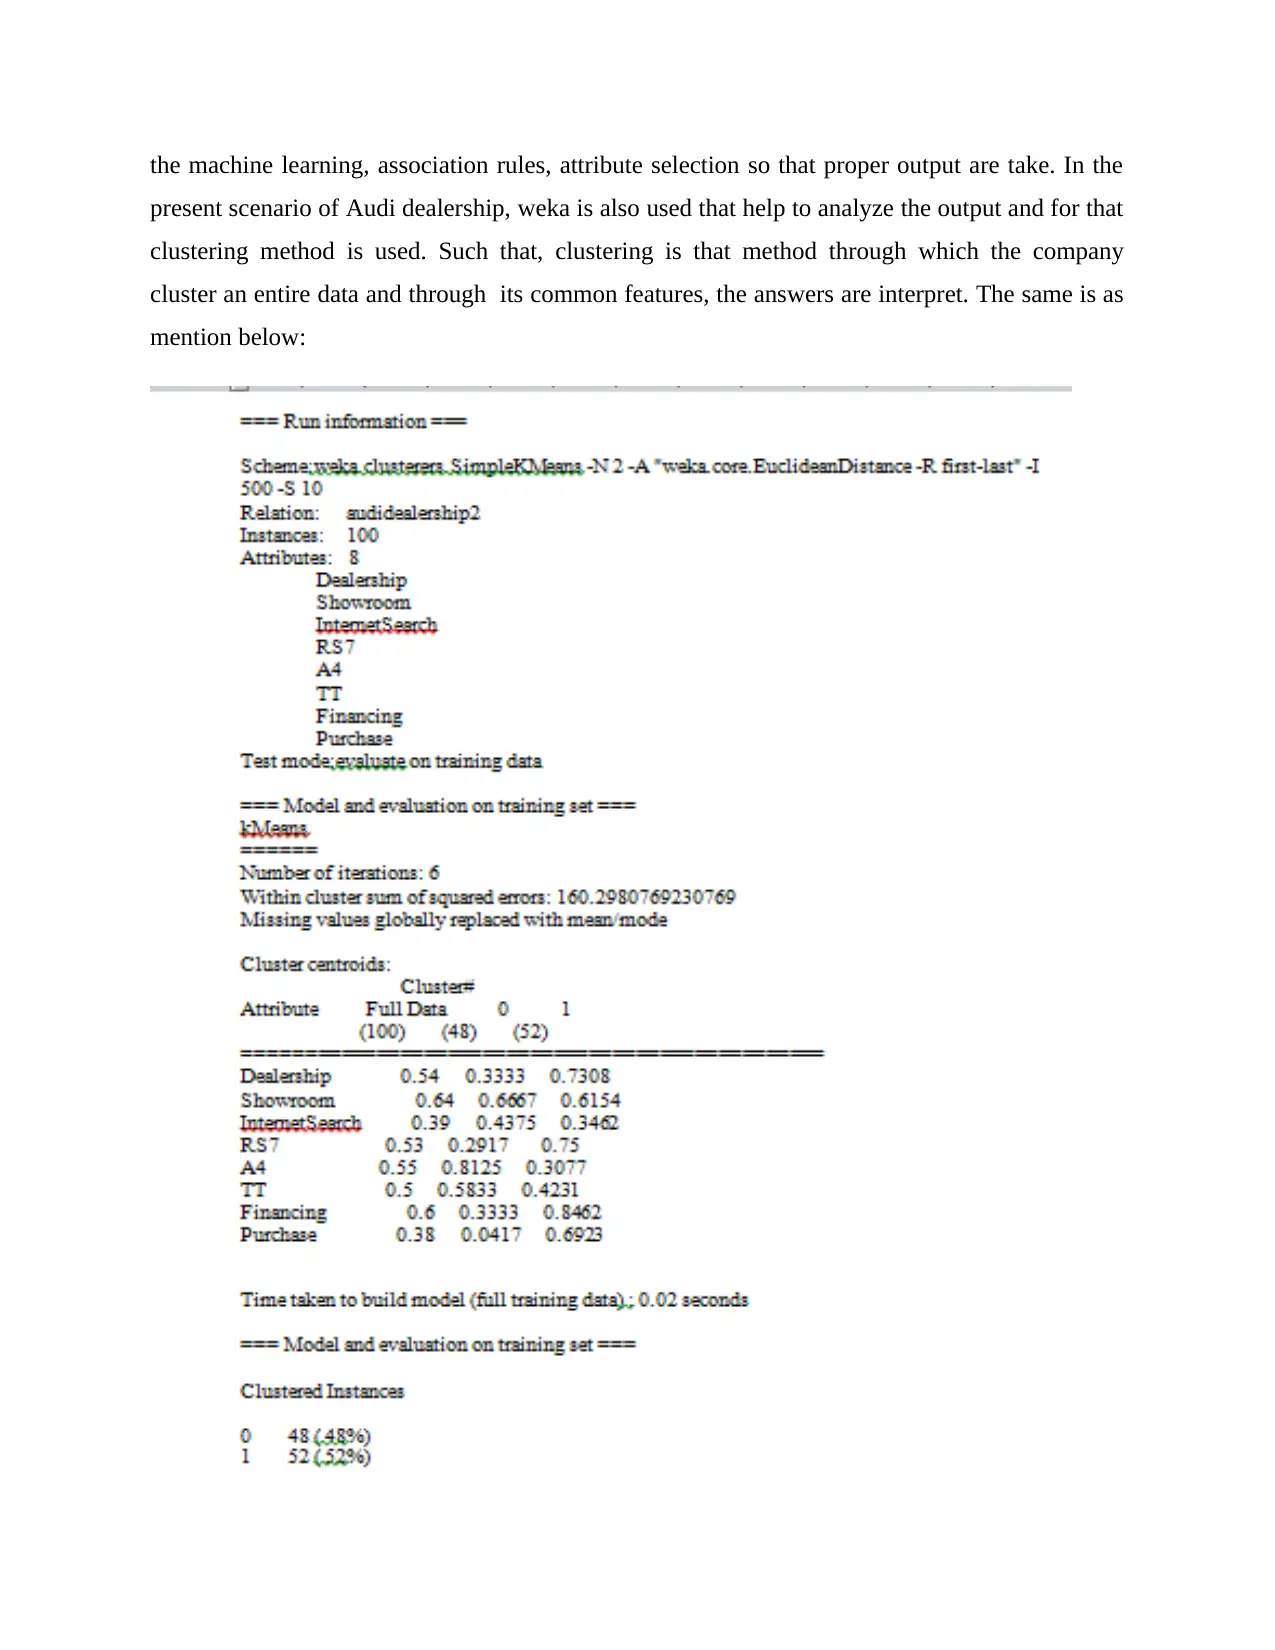
the machine learning, association rules, attribute selection so that proper output are take. In the
present scenario of Audi dealership, weka is also used that help to analyze the output and for that
clustering method is used. Such that, clustering is that method through which the company
cluster an entire data and through its common features, the answers are interpret. The same is as
mention below:
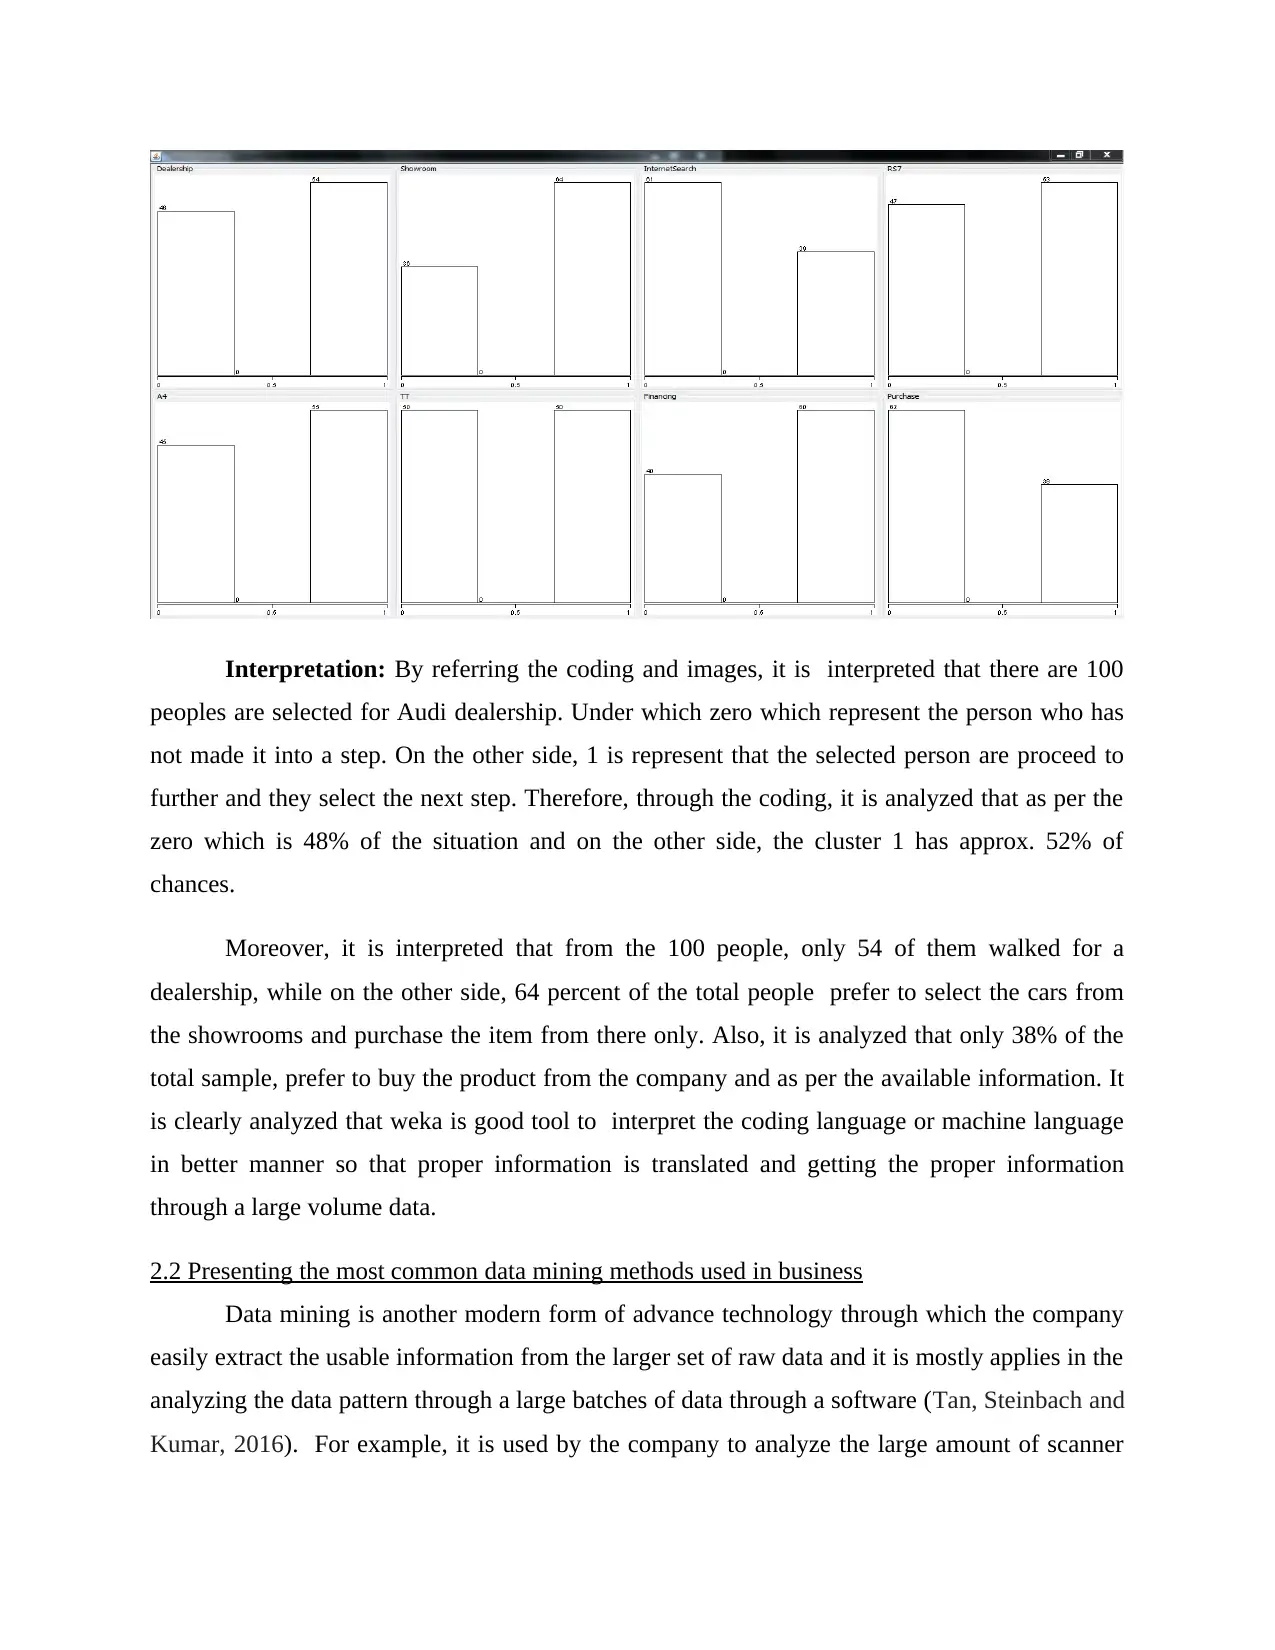
Interpretation: By referring the coding and images, it is interpreted that there are 100
peoples are selected for Audi dealership. Under which zero which represent the person who has
not made it into a step. On the other side, 1 is represent that the selected person are proceed to
further and they select the next step. Therefore, through the coding, it is analyzed that as per the
zero which is 48% of the situation and on the other side, the cluster 1 has approx. 52% of
chances.
Moreover, it is interpreted that from the 100 people, only 54 of them walked for a
dealership, while on the other side, 64 percent of the total people prefer to select the cars from
the showrooms and purchase the item from there only. Also, it is analyzed that only 38% of the
total sample, prefer to buy the product from the company and as per the available information. It
is clearly analyzed that weka is good tool to interpret the coding language or machine language
in better manner so that proper information is translated and getting the proper information
through a large volume data.
2.2 Presenting the most common data mining methods used in business
Data mining is another modern form of advance technology through which the company
easily extract the usable information from the larger set of raw data and it is mostly applies in the
analyzing the data pattern through a large batches of data through a software (Tan, Steinbach and
Kumar, 2016). For example, it is used by the company to analyze the large amount of scanner
⊘ This is a preview!⊘
Do you want full access?
Subscribe today to unlock all pages.
Trusted by 1+ million students worldwide
data from the supermarkets. Thus, it provide clear information and its techniques helps thee
companies to get the knowledge-based information. On the other side, most of the top
companies also uses this technique for future trends, also help to signifies the customer habit.
Not only this, this techniques provides an opportunity to the companies to quickly detect the
fraud and take action immediately. There are variety of methods which are used by the business
and these are as mention below:
Association: One of the most common data mining technique which is related to
statistics. Such that it shows that some data are link with other data and with the presence of each
other, they provide output for the company through which they take action accordingly (Torgo,
2016). Further, this statistical concept of correlation is also similar to the notion of association
and describe the relationship between two events. For example, McDonalds uses this technique
in order to determine the relationship between the hamburgers with French fries and thus a result,
it shows how frequently one variable is accompanied with another.
Classification: Another technique of data mining which involves analyzing the different
features which is link with the different type of data. Under this the company have to determine
the main characteristic of these data types, and then related the same with another. As it is not
easy to determine the exact relationship (Technique of data mining, 2020). So, most of the
company is also uses this especially to determine the personally identifiable information that
helps to protect and redact from the documents.
Tracking the pattern: One of the most common and fundamental type of data mining
technique which involves identify and monitor the trends and pattern of data so that it will help
to make intelligent inferences related to business outcomes. These pattern are help to analyze the
sales pattern and also assist to take better action to enhance the sales of a company. Also,
through this method, the company will easily analyze the product and organization may also use
the knowledge in order to create the similar products and services to follow the trend (Hofmann
and Klinkenberg, 2016). As most of the company uses this method in order to get the accurate
results.
Paraphrase This Document
Need a fresh take? Get an instant paraphrase of this document with our AI Paraphraser
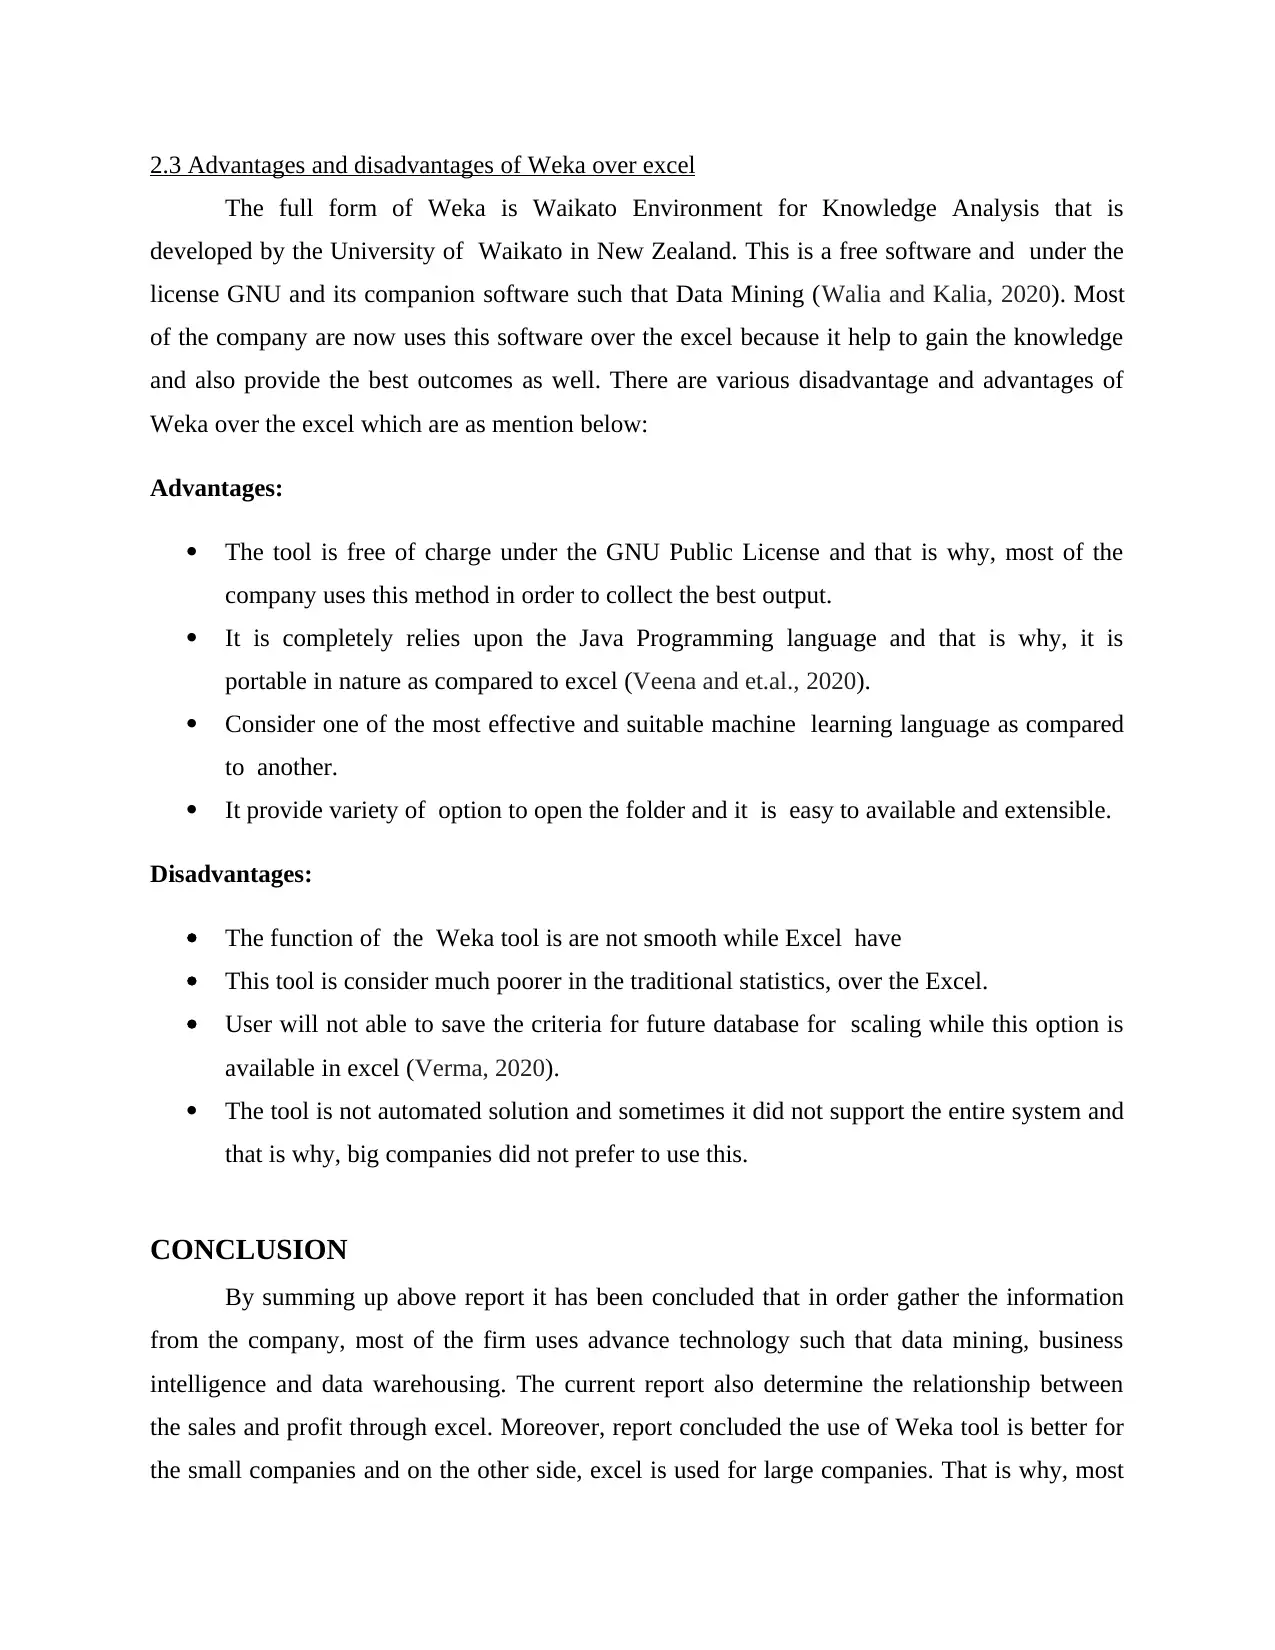
2.3 Advantages and disadvantages of Weka over excel
The full form of Weka is Waikato Environment for Knowledge Analysis that is
developed by the University of Waikato in New Zealand. This is a free software and under the
license GNU and its companion software such that Data Mining (Walia and Kalia, 2020). Most
of the company are now uses this software over the excel because it help to gain the knowledge
and also provide the best outcomes as well. There are various disadvantage and advantages of
Weka over the excel which are as mention below:
Advantages:
The tool is free of charge under the GNU Public License and that is why, most of the
company uses this method in order to collect the best output.
It is completely relies upon the Java Programming language and that is why, it is
portable in nature as compared to excel (Veena and et.al., 2020).
Consider one of the most effective and suitable machine learning language as compared
to another.
It provide variety of option to open the folder and it is easy to available and extensible.
Disadvantages:
The function of the Weka tool is are not smooth while Excel have
This tool is consider much poorer in the traditional statistics, over the Excel.
User will not able to save the criteria for future database for scaling while this option is
available in excel (Verma, 2020).
The tool is not automated solution and sometimes it did not support the entire system and
that is why, big companies did not prefer to use this.
CONCLUSION
By summing up above report it has been concluded that in order gather the information
from the company, most of the firm uses advance technology such that data mining, business
intelligence and data warehousing. The current report also determine the relationship between
the sales and profit through excel. Moreover, report concluded the use of Weka tool is better for
the small companies and on the other side, excel is used for large companies. That is why, most
of the large companies mainly use excel in order to get result from the large data. Also, report
concluded that different techniques which are used by the company under data mining
techniques such that tracking pattern, classification and association.
concluded that different techniques which are used by the company under data mining
techniques such that tracking pattern, classification and association.
⊘ This is a preview!⊘
Do you want full access?
Subscribe today to unlock all pages.
Trusted by 1+ million students worldwide
1 out of 13
Related Documents


Your All-in-One AI-Powered Toolkit for Academic Success.
+13062052269
info@desklib.com
Available 24*7 on WhatsApp / Email
![[object Object]](/_next/static/media/star-bottom.7253800d.svg)
Unlock your academic potential
Copyright © 2020–2026 A2Z Services. All Rights Reserved. Developed and managed by ZUCOL.