Data Mining and Visualization: Association Rules and Cluster Analysis

Verified

Added on  2020/03/16

|6
|972
|133
Homework Assignment
AI Summary
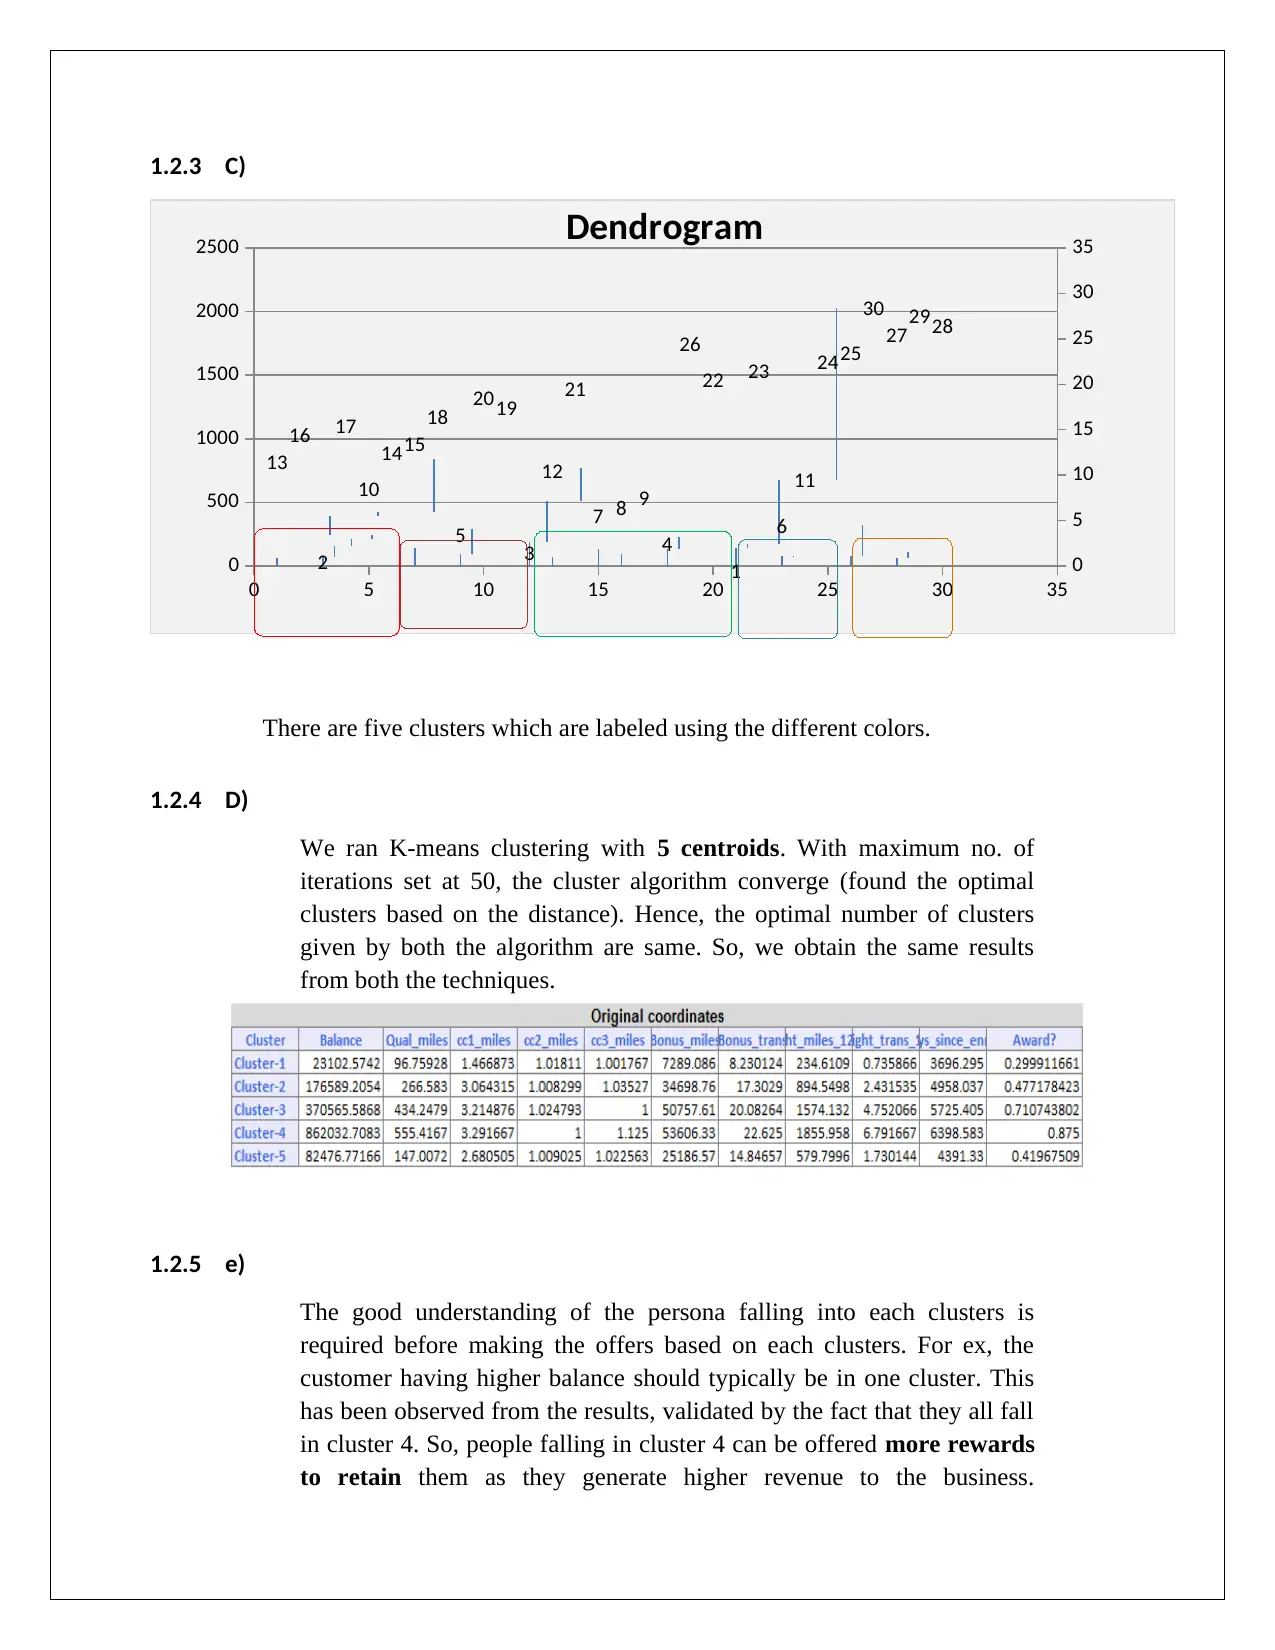
This assignment focuses on data mining and visualization techniques, specifically association rules and cluster analysis, for business intelligence. It covers the application of association rules to identify relationships between items, using metrics like confidence and lift ratio to evaluate rule efficiency. The assignment also explores cluster analysis, employing K-means clustering with XLMiner to segment data into distinct clusters. It highlights the importance of data normalization and understanding cluster characteristics to tailor business strategies, such as offering personalized rewards to retain high-value customers. References to relevant research articles are included to support the analysis. Desklib provides access to this assignment along with a wealth of other study resources.
Document Page
Data Mining and Visualization for Business Intelligence
Assignment - 3
[Pick the date]
Student Name
Contents
tabler-icon-diamond-filled.svg

Paraphrase This Document

Need a fresh take? Get an instant paraphrase of this document with our AI Paraphraser
Document Page
1.1 Association Rules........................................................................................................................2
1.1.1 I)...........................................................................................................................................2
1.1.2 II)..........................................................................................................................................3
1.1.3 III).........................................................................................................................................4
1.2 Cluster Analysis............................................................................................................................4
1.2.1 A).........................................................................................................................................4
1.2.2 B)..........................................................................................................................................4
1.2.3 C)..........................................................................................................................................4
1.2.4 D).........................................................................................................................................5
1.2.5 e)..........................................................................................................................................5
1.1 Association Rules
Document Page
1.1.1 I)
As shown in the above table Antecedent is an observation found in the data.
Similarly consequent is an item which is bought together along with antecedent. In
this case Rule 1 states brushes and congealer are brought together by a customer, then
it can be said with 80% confidence that Nail Polish & bronzer will also be bought by
the same customer. As the table above shows Burshes, Concealer and Nail Polsih &
Bronzer are bought together 77 times. On the other hand the support for C is only 103
times .In other words the customer who buys Nail Polish & Bonzer also bought
Brushes.
Similarly results also show that 62 times the The event A & C happened together.
Furthermore the lift ratio shows that the likelihood of purchasing Brushes, Concealer,
and Nail Polish & Bronzer as compared to the all transactions as whole.
Similarly the Rule 2 states when the customer buy Nail Polish & Bronzer, they also
buy Brushes & Concealer with the support for event A happening is 103 while
support for event C happening is 77. The confidence level for the rule is very low.
Rule 3 states that when a customer buy nail polish, concealer & bronzer together then
they also buy brushes with confidence of 81%. (Gupta, Garg, & Sharma, 2014; Rajak
& Gupta, 2008; Sujatha & CH, 2011)
1.1.2 II)
To see whether the rules generated from the association rules are efficient, there are multiple
criteria. Firstly we need to look into the confidence level which gives shows the confidence of
that rule. Also, it should be logical & backed by the business understanding. For example, the
Rule number 6 has Confidence level more than 80% & the lift ratio is 3.7. Also, this rule makes
business sense. Hence, this rule can be considered as efficient rule to apply.
Document Page
1.1.3 III)
When the confidence level is raised to 75% then the no. of association rules will be
less. This is because the algorithm will only choose those rules in which confidence
level is more than or equal to 75%. Confidence Level is calculated by taking the ratio
the support for A&C to support for A only. Hence, more transaction with the
intersection between antecedents & consequents is required to qualify as rules.
1.2 Cluster Analysis
1.2.1 A)
There are five clusters which we had specified in advance for the algorithm in
XLMiner. This helps the algorithm to converge.
1.2.2 B)
When the data is not normalized then the scale of the variable will affect the
distance calculated hence dominate the measure.
tabler-icon-diamond-filled.svg

Paraphrase This Document

Need a fresh take? Get an instant paraphrase of this document with our AI Paraphraser
Document Page
1.2.3 C)
0 5 10 15 20 25 30 35
0
500
1000
1500
2000
2500
0
5
10
15
20
25
30
35
13
16
2
17
10
1415
18
5
2019
3
12
21
7 8 9
4
26
22
1
23
6
11
2425
30
272928
Dendrogram
There are five clusters which are labeled using the different colors.
1.2.4 D)
We ran K-means clustering with 5 centroids. With maximum no. of
iterations set at 50, the cluster algorithm converge (found the optimal
clusters based on the distance). Hence, the optimal number of clusters
given by both the algorithm are same. So, we obtain the same results
from both the techniques.
1.2.5 e)
The good understanding of the persona falling into each clusters is
required before making the offers based on each clusters. For ex, the
customer having higher balance should typically be in one cluster. This
has been observed from the results, validated by the fact that they all fall
in cluster 4. So, people falling in cluster 4 can be offered more rewards
to retain them as they generate higher revenue to the business.
Document Page
Rewarding them with gifts, preferred seat selection can help them to
show as appreciation for their loyalty. People with less transaction or
frequency are clustered in cluster 1. So, it is optimal to personalized
offers such as discount, reward points that is specific to this segment so
that the business will gain more from the segment(Correa, González,
Nieto, & Amezquita, 2012; Iaci & Singh, 2012; Trebuna, Halcinova, &
Fil’o, 2014).
References
Correa, A., González, A., Nieto, C., & Amezquita, D. (2012). Constructing a Credit Risk
Scorecard using Predictive Clusters. SAS Global Forum.
Gupta, A. K., Garg, R. R., & Sharma, V. K. (2014). Association Rule Mining Techniques
between Set of Items. International Journal of Intelligent Computing and Informatics, 1(1).
Iaci, R., & Singh, A. K. (2012). Clustering high dimensional sparse casino player tracking
datasets. UNLV Gaming Research & Review Journa, 16(1), 21–43.
Rajak, A., & Gupta, M. (2008). Association Rule Mining: Applications in Various Areas. In
International Conference on Data Management,. International Conference on Data
Management,.
Sujatha, D., & CH, N. (2011). Quantitative Association Rule Mining on Weighted Transactional
Data. International Journal of Information and Education Technolog, 1(3).
chevron_up_icon
1 out of 6
circle_padding
hide_on_mobile
zoom_out_icon
[object Object]