CP600038E - Customer Loyalty Analysis Using Data Mining Technologies
VerifiedAdded on 2020/04/15
|15
|3085
|68
Report
AI Summary
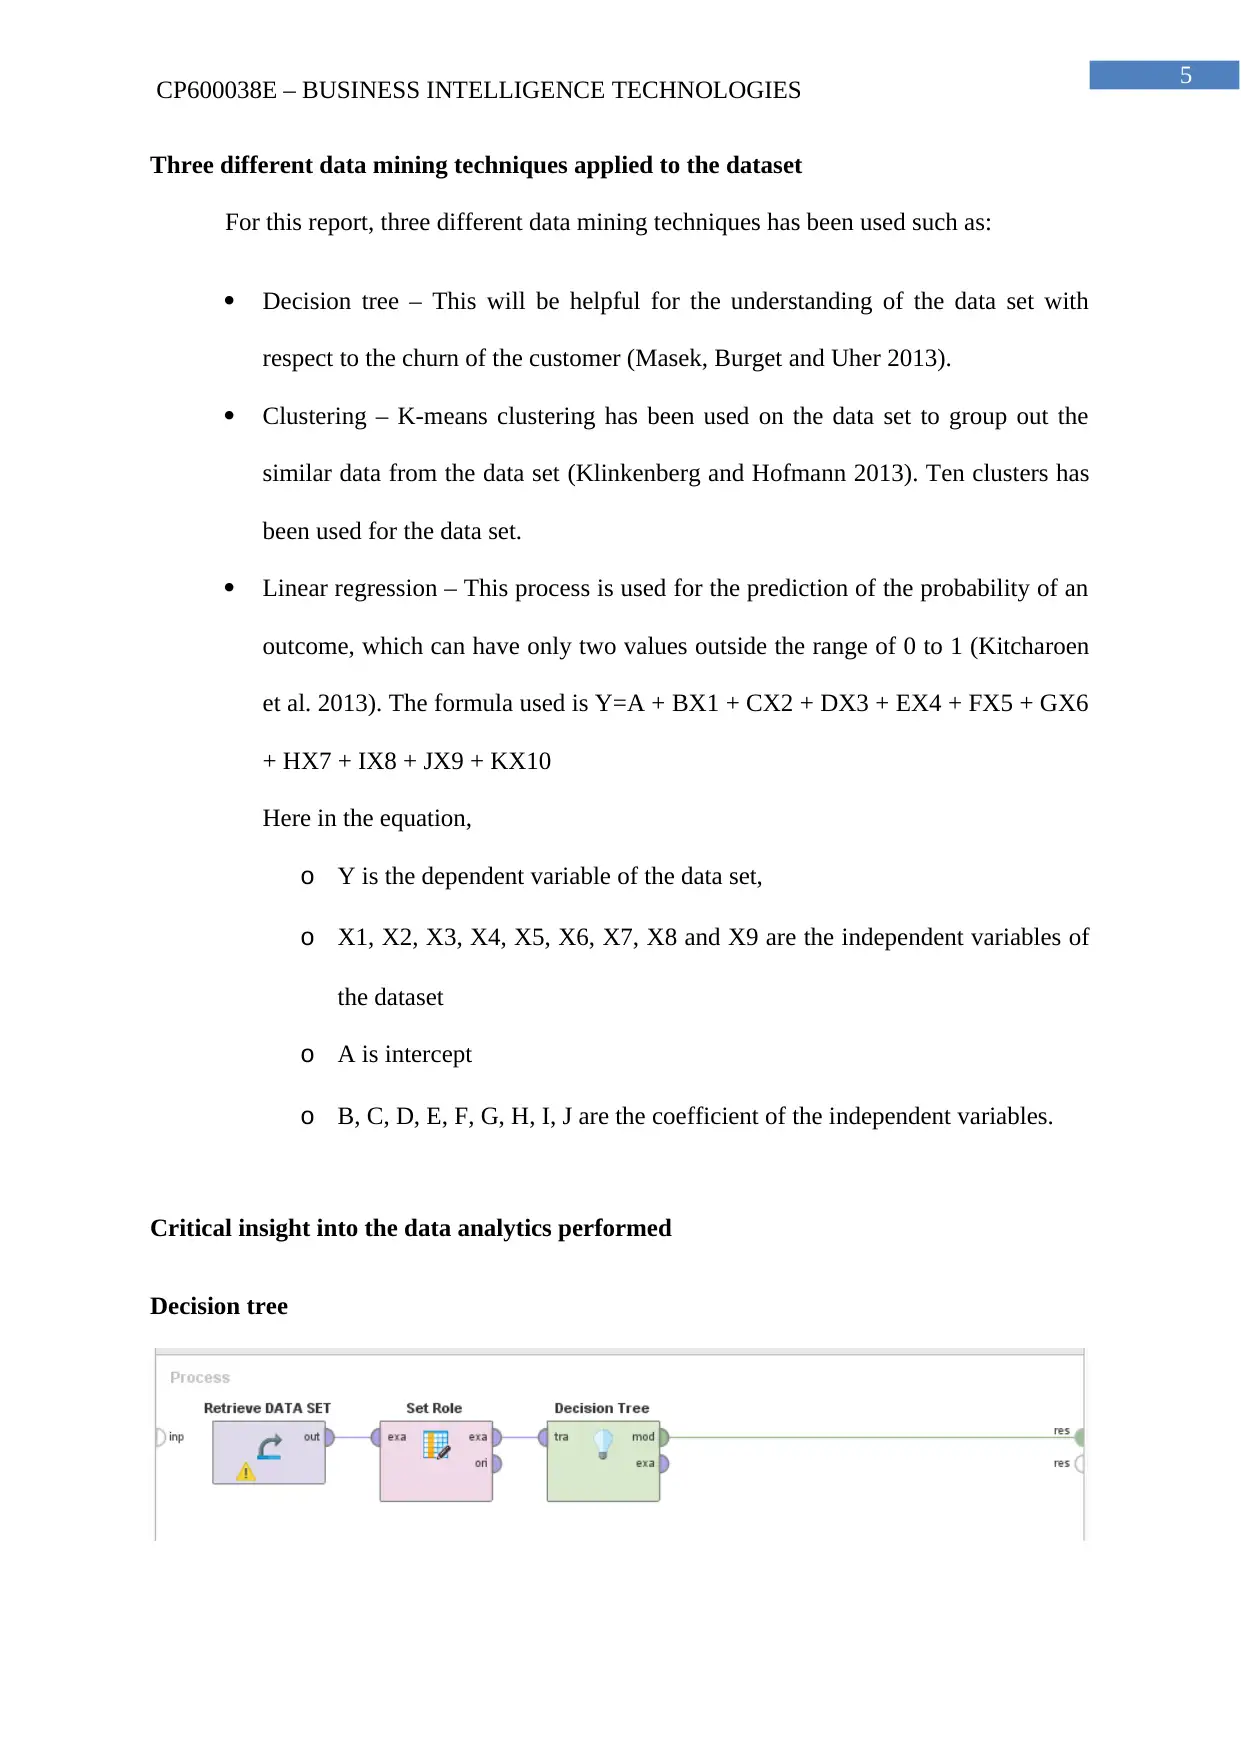
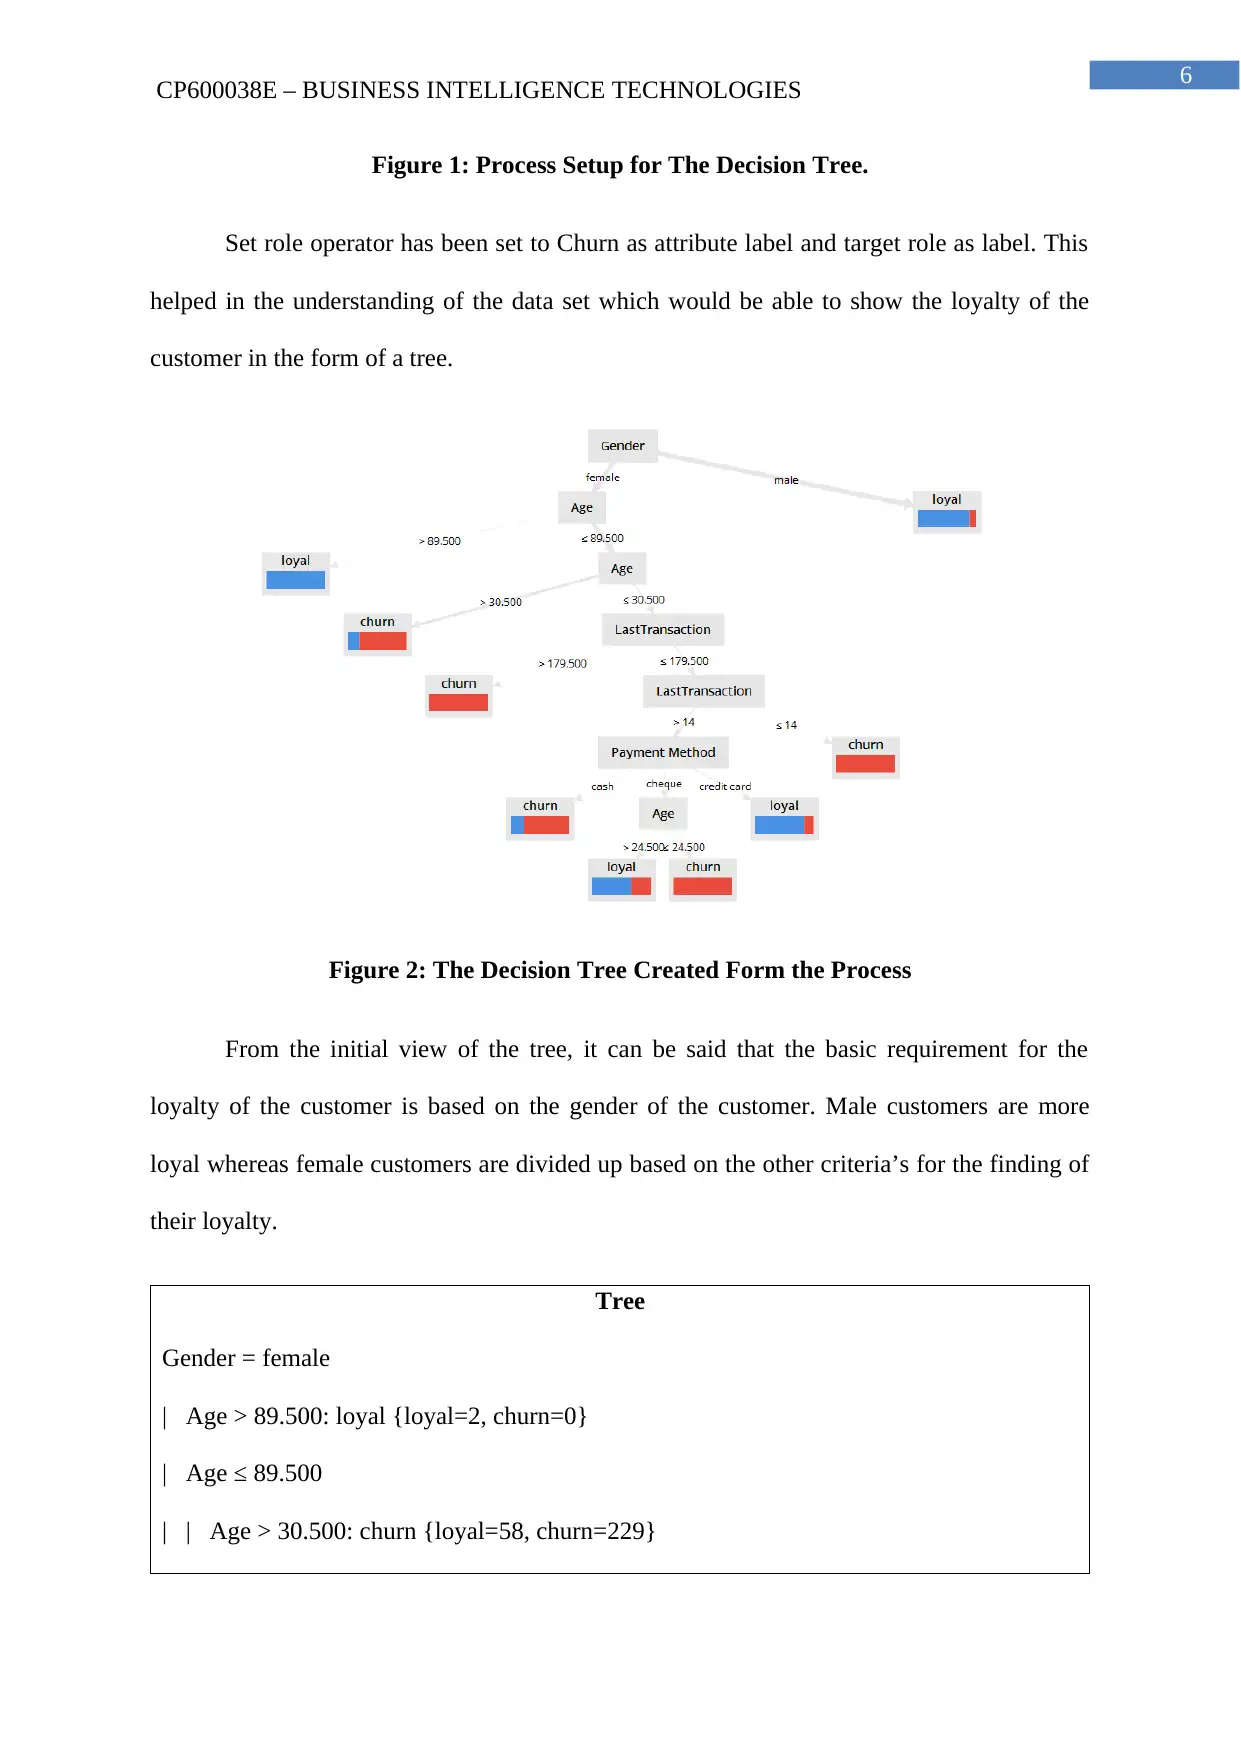
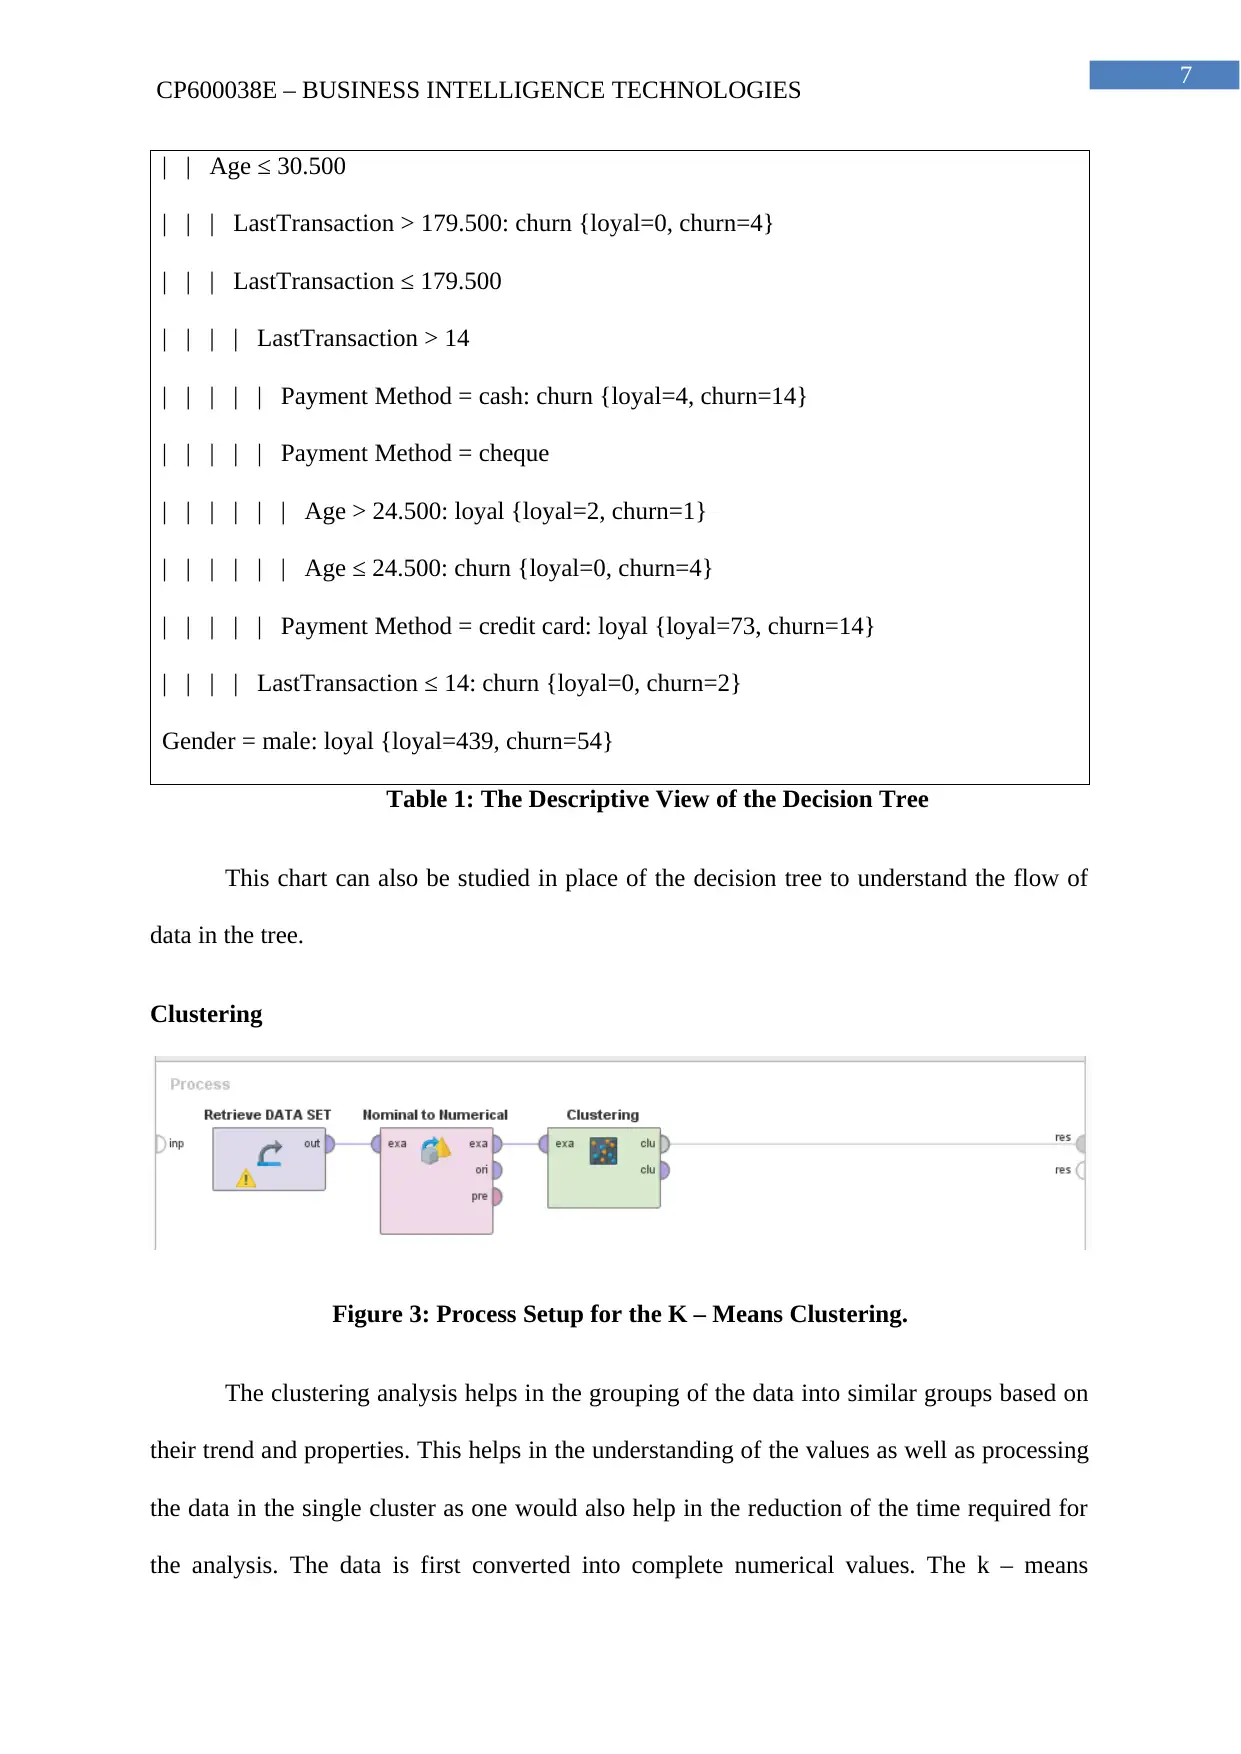
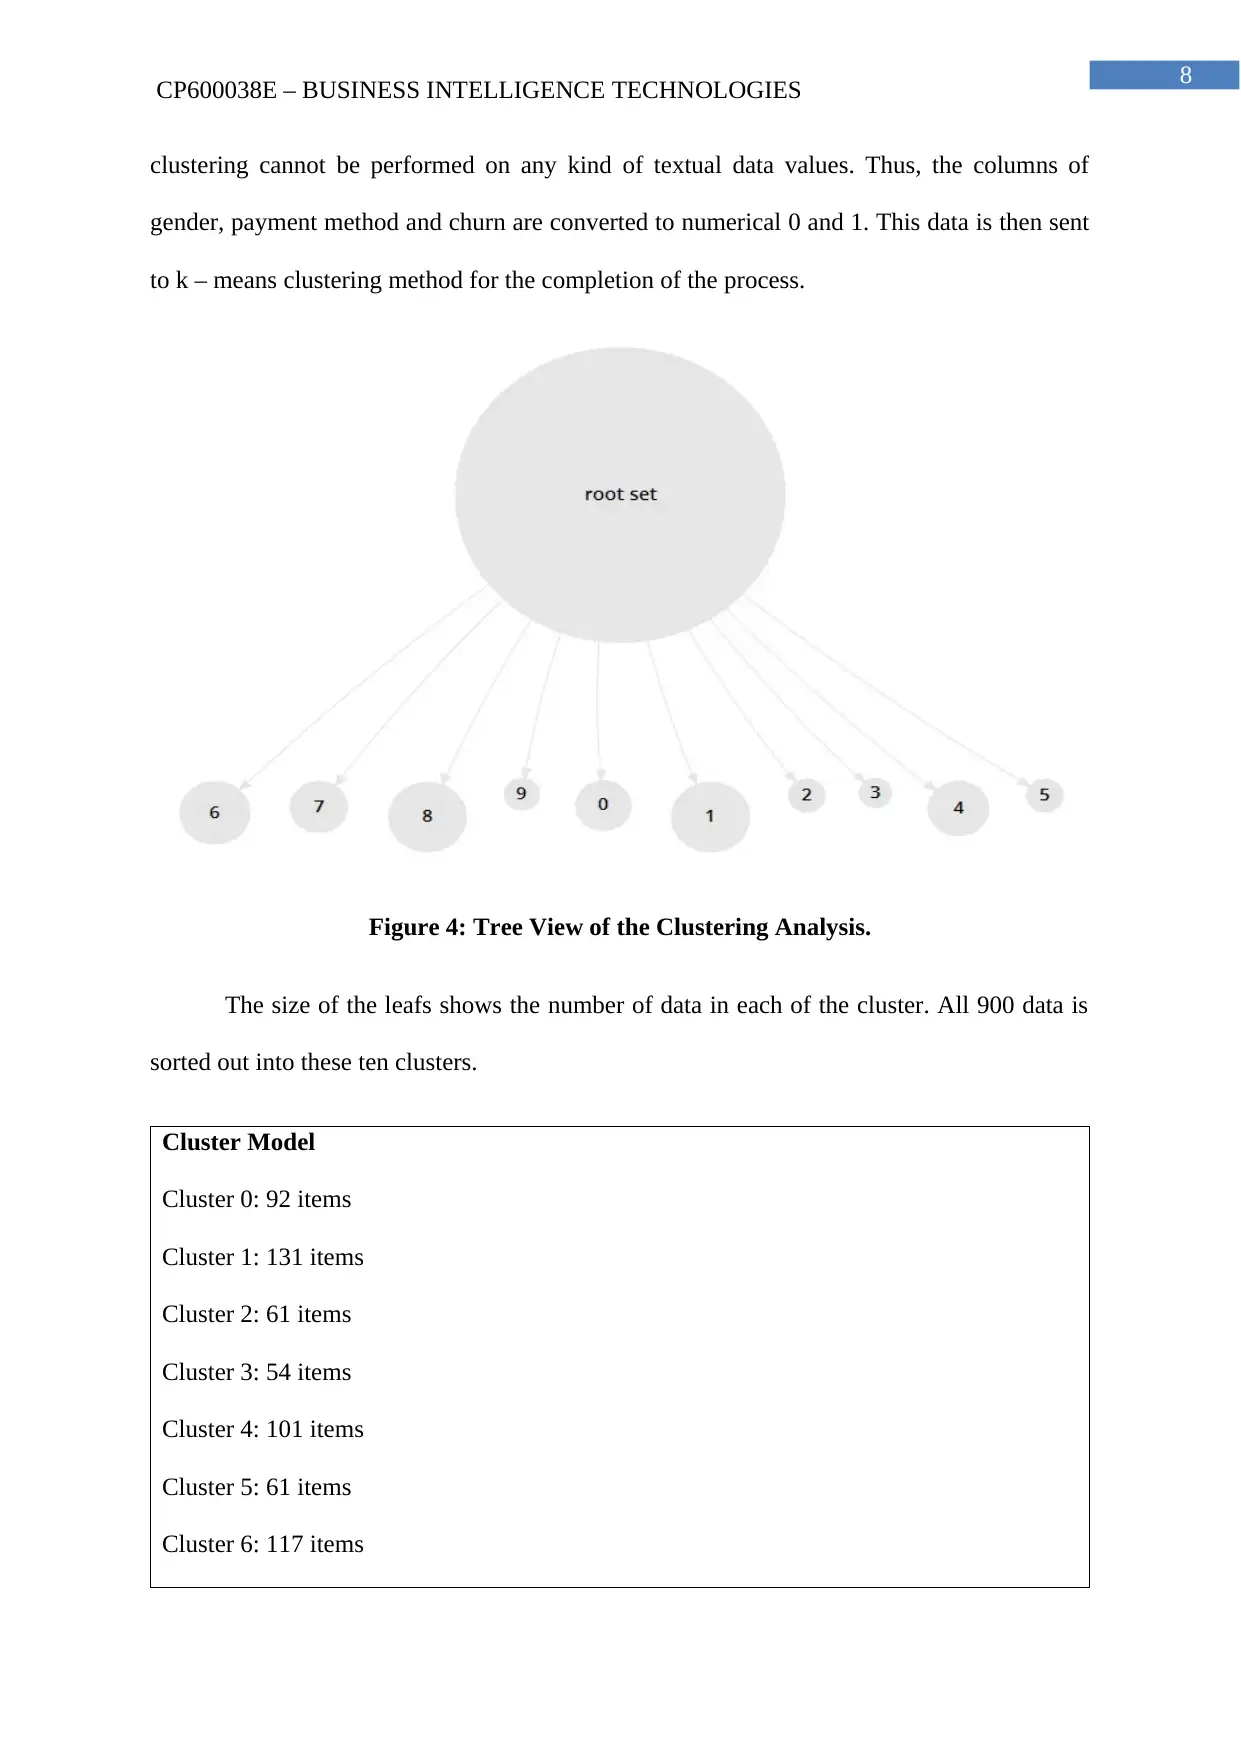
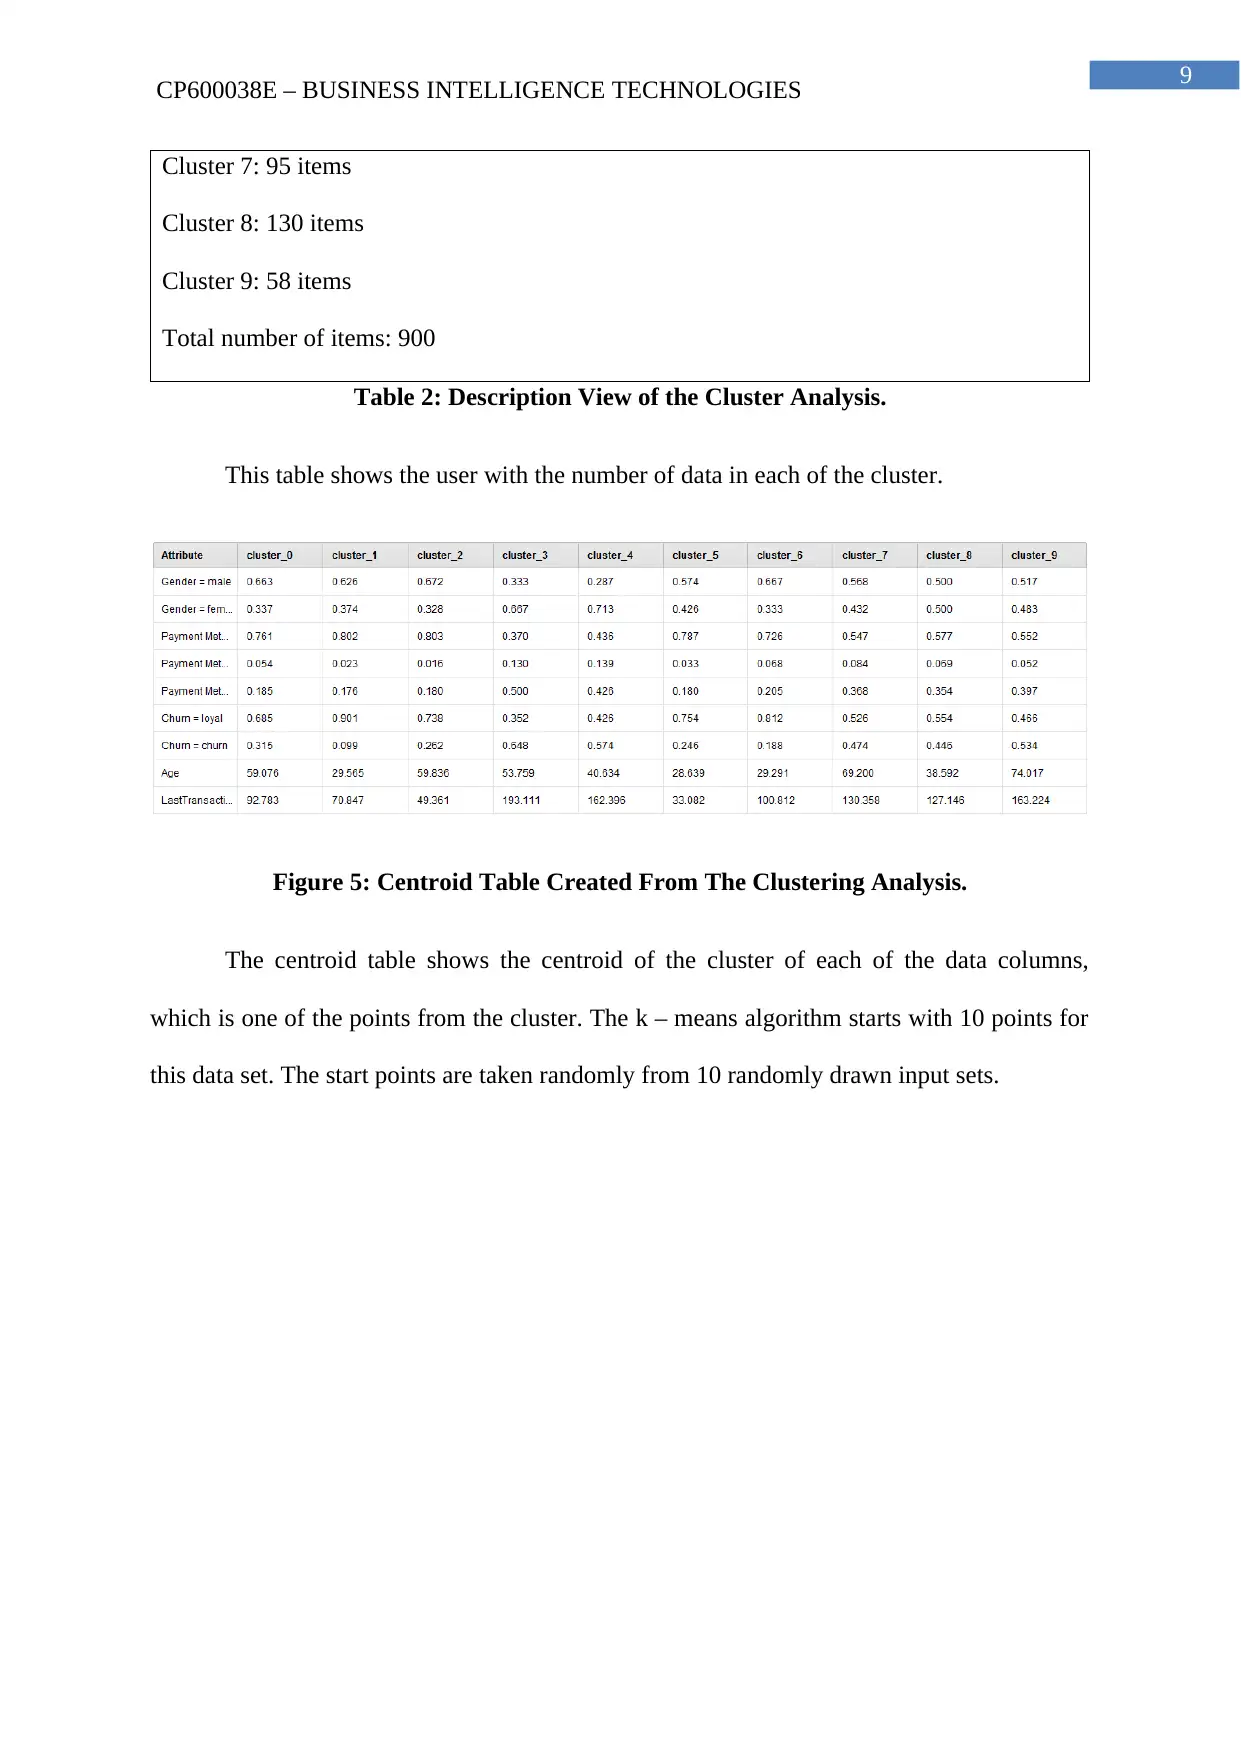
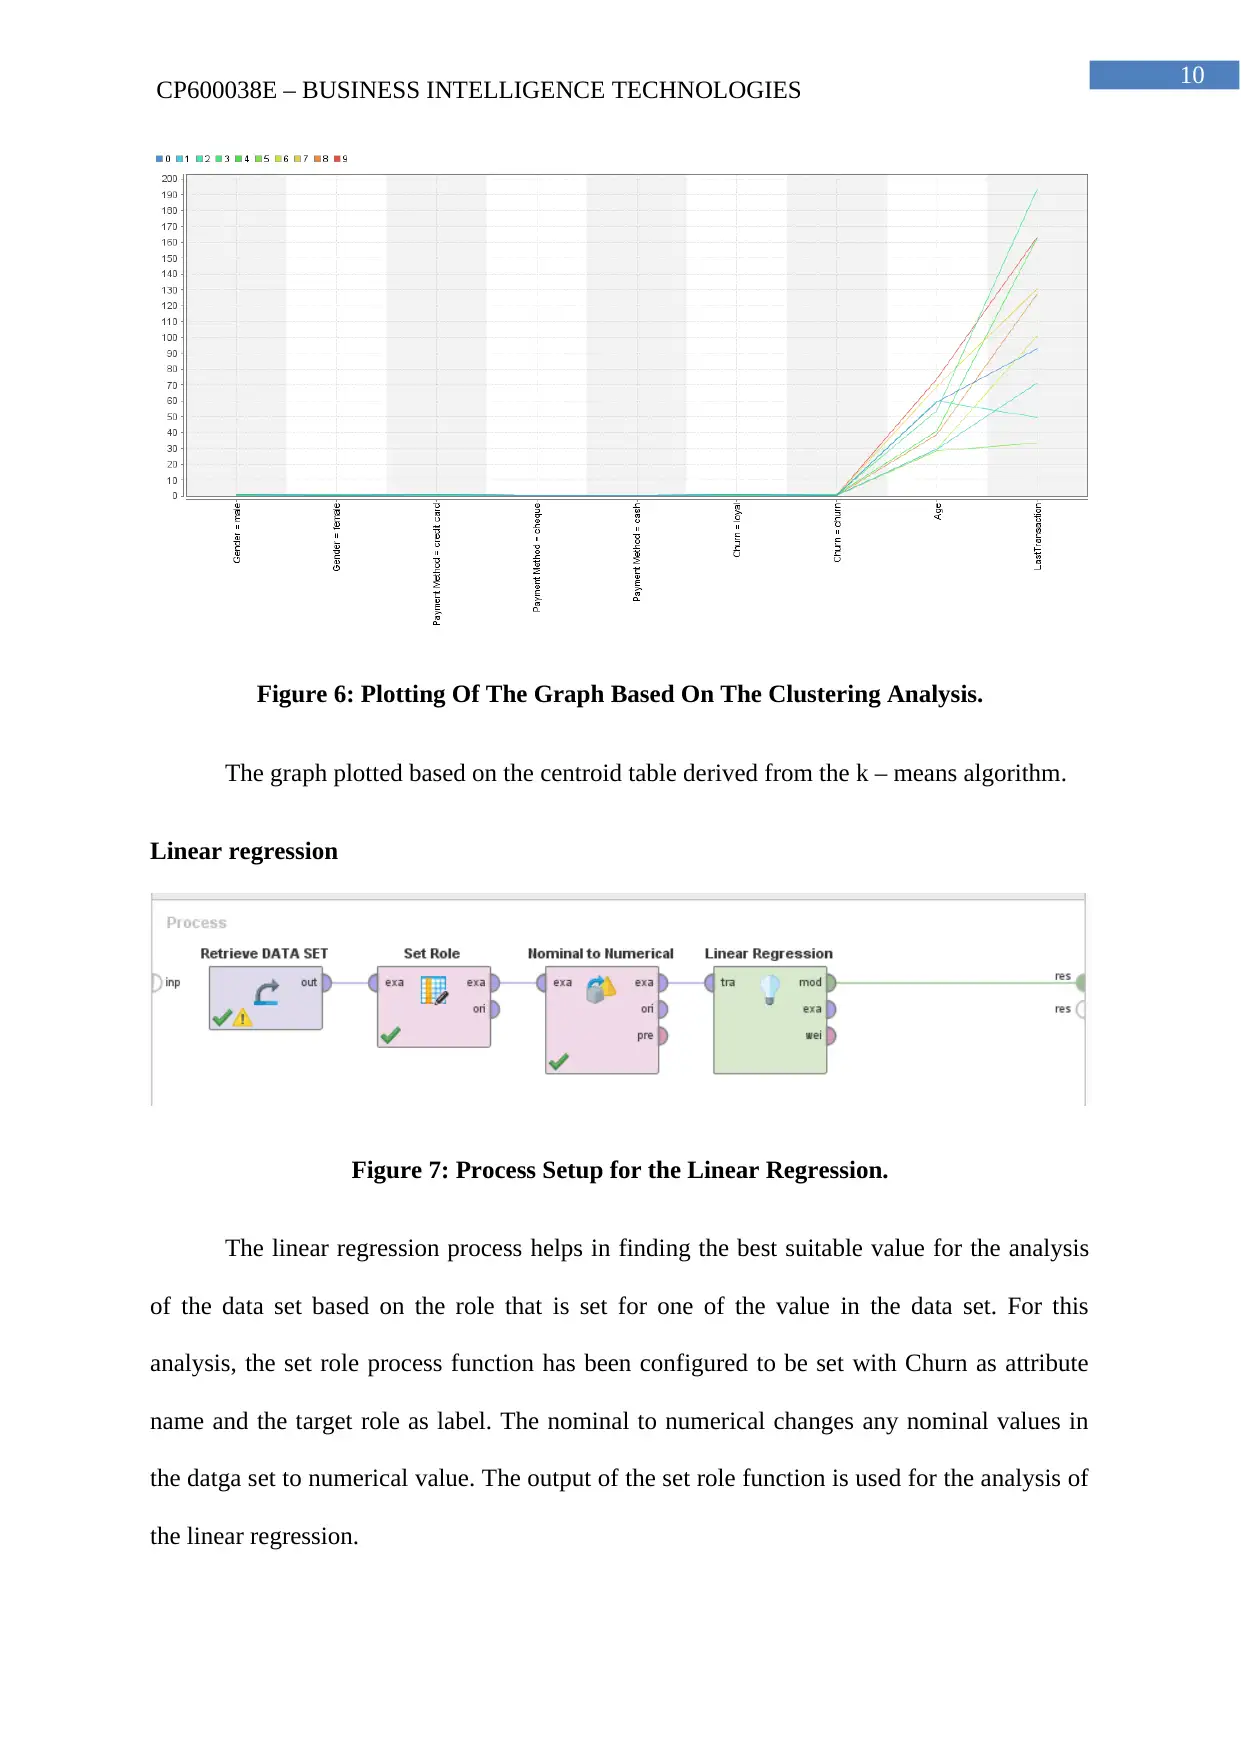
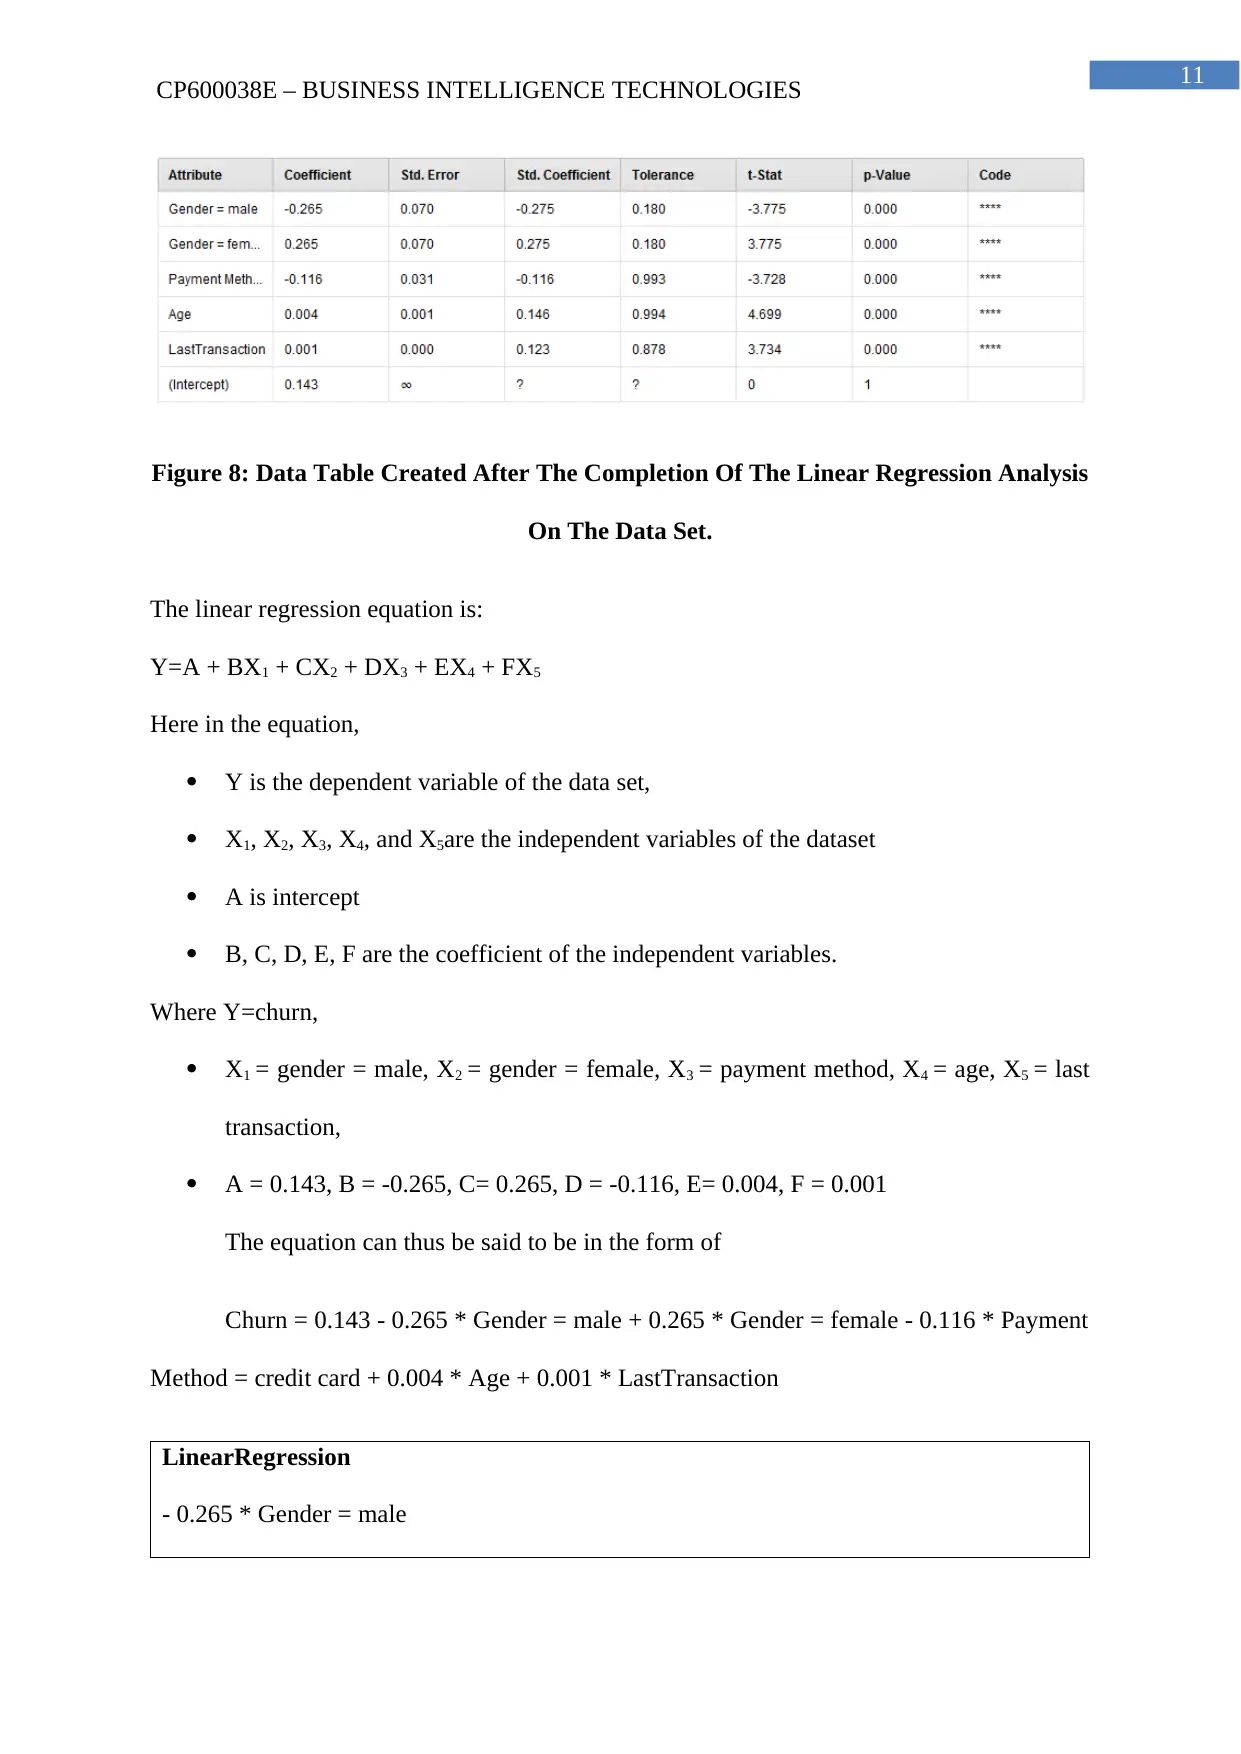
This report, prepared by a student, focuses on applying various data mining techniques to analyze customer loyalty within a banking context. The analysis utilizes a dataset containing customer details such as age, gender, payment method, transaction history, and loyalty status (churn). Three primary data mining techniques are employed: Decision Trees, Clustering (K-means), and Linear Regression. The Decision Tree analysis reveals key factors influencing customer loyalty, such as gender and payment method, creating a visual representation of customer segmentation. K-means clustering is used to group customers based on similarities, and the centroid table and graphical representations are used to visualize the clusters. Linear regression is applied to predict the probability of customer churn, providing an equation that considers various factors. The report provides process setups, data tables, and graphical representations generated from the RapidMiner tool, offering insights into the application and outcomes of each data mining technique. The student provides critical insights derived from each method, comparing and contrasting the results to understand customer behavior. This analysis allows for the identification of patterns and relationships within the data, enabling the bank to improve its customer retention strategies and overall business intelligence.

Running head: CP600038E – Business Intelligence Technologies
CP600038E – Business Intelligence Technologies
Name of the Student
Name of the University
Author Note
CP600038E – Business Intelligence Technologies
Name of the Student
Name of the University
Author Note
Paraphrase This Document
Need a fresh take? Get an instant paraphrase of this document with our AI Paraphraser

1
CP600038E – BUSINESS INTELLIGENCE TECHNOLOGIES
Table of Contents
Overview of data mining techniques..........................................................................................3
Basic understanding and description of the dataset...................................................................5
Three different data mining techniques applied to the dataset...................................................5
Critical insight into the data analytics performed......................................................................6
Decision tree...........................................................................................................................6
Clustering...............................................................................................................................8
Linear regression..................................................................................................................11
Conclusion................................................................................................................................12
References................................................................................................................................14

2
CP600038E – BUSINESS INTELLIGENCE TECHNOLOGIES
Overview of data mining techniques
Data mining is a process used of the extraction of the correct amount of useful
information from a large pool of data and transform it into useful charts and values which can
be easy for the understanding of the data (Aggarwal and Zhai 2013). The process of data
mining requires a following of a sequence of steps, which includes collection of the data,
extraction of the proper amount of data, analysis of the extracted data, and prepare a statistics
based on the analysis of the data (Agneeswaran, Tonpay and Tiwary 2013). The use of the
data mining tools can be helpful for the finding of the required amount of information from
the data set and for the easy resolving of difficult situations. The tools can also be used for
the prediction of future trends of data in the field of large business organization (Amer and
Goldstein 2012).
The use of data mining in the business industry has been found to have many benefits,
which include the automated future data prediction of the behavior and the values of the
required field and the analysis of a large amount of data within a short period (Bockermann
and Blom 2012). Apart from this, it also helps in the process of understanding hidden pattern
recognition and the yielding of improved version of predictions (Mihelčić et al. 2012).
The different techniques, which can be used for the process of implementation of data
mining, are:
1. Statistics – This form of data mining technique is the form of mathematics, which
is related to the process of data collection and descriptive form of data (Delen
2012). Most of the data analyst does not consider statistical analytical techniques
to be one of the data mining techniques. However, its ability to build patterns and
⊘ This is a preview!⊘
Do you want full access?
Subscribe today to unlock all pages.

Trusted by 1+ million students worldwide

3
CP600038E – BUSINESS INTELLIGENCE TECHNOLOGIES
predictive models help in the understanding of the data easily (Mohamad and
Tasir 2013).
2. Association Rules – This technique helps in the finding of the associations
between two or more than two items (Ertek, Tapucu and Arin 2013). This helps in
the understanding of the different relations, which the variables have in the
database. Two things are taken into concern: how frequently is the rule applied
and how much the rule is correct (Ristoski, Bizer and Paulheim 2015).
3. Clustering – This is one of the oldest techniques being used in the data mining
field. With the help of this process, the analyst is able to find the data, which are
similar to one another and group then under a single folder (Fan and Bifet 2013).
This would help in the understanding the similarities and the differences among
the large amount of data.
4. Neural Networks – This technique is being now used by most of the people in
today’s analysis procedures (He 2013). Artificial neural networks are designed
with the help of artificial intelligence. This process consists of two parts: node and
link (Romero and Ventura 2013).
5. Visualization – This can be said to be one of the most useful technique for the
understanding of the data pattern. This is the first technique to be used at the
beginning of the data mining process (Hofmann and Klinkenberg 2013). However,
there are numerous other techniques, which can be used for the production of the
pattern design of the data, but the visualization modeling can help in changing a
poor group of data into a good visual (Tayel, Reif and Dengel 2013).
6. Classification – This is the most common technique of classification used for data
mining, which has a set of already set out classification samples, which helps in
the process of understanding of the large set of data (Kabakchieva 2013). This
Paraphrase This Document
Need a fresh take? Get an instant paraphrase of this document with our AI Paraphraser

4
CP600038E – BUSINESS INTELLIGENCE TECHNOLOGIES
process has been closely related to the clustering analysis of the decision tree as
well as the neural network system.
7. Decision tree – The decision tree is a predictive model, which looks like a tree.
The technique provides a viewing of the branches as a classification question
where the leaves are the partition of the particular classification (Karasek et al.
2013). The complete data is divided up in the form of clusters, which can be
studied based on one single question (Verma and Gaur 2014).
Basic understanding and description of the dataset
The data set consists of details from a bank which discusses the loyalty of a customer
of the bank. The loyalty has been based on the factor of the customer’s age, gender, payment
method which he or she uses and the amount of money used for the last transaction. Based on
these the customer is said to be either loyal or churn. The data set consists of the following
columns of data:
Gender: male / female
Age: integer value between 17 to 91
Payment Method: case, credit card or cheque method of payment
LastTransaction: integer value between 1 to 223
Churn: loyal / churn
The data set has a total of 900 rows of data without null values. The data set has been
cleaned before it has been used for the analysis. The data set is to be analyzed with the help
of Rapid Miner Tools with the help of three different data mining tools for the completion of
this report. The basis of analysis for the data set in the software is based on the finding of the
loyalty of the customer of the bank.

5
CP600038E – BUSINESS INTELLIGENCE TECHNOLOGIES
Three different data mining techniques applied to the dataset
For this report, three different data mining techniques has been used such as:
Decision tree – This will be helpful for the understanding of the data set with
respect to the churn of the customer (Masek, Burget and Uher 2013).
Clustering – K-means clustering has been used on the data set to group out the
similar data from the data set (Klinkenberg and Hofmann 2013). Ten clusters has
been used for the data set.
Linear regression – This process is used for the prediction of the probability of an
outcome, which can have only two values outside the range of 0 to 1 (Kitcharoen
et al. 2013). The formula used is Y=A + BX1 + CX2 + DX3 + EX4 + FX5 + GX6
+ HX7 + IX8 + JX9 + KX10
Here in the equation,
o Y is the dependent variable of the data set,
o X1, X2, X3, X4, X5, X6, X7, X8 and X9 are the independent variables of
the dataset
o A is intercept
o B, C, D, E, F, G, H, I, J are the coefficient of the independent variables.
Critical insight into the data analytics performed
Decision tree
⊘ This is a preview!⊘
Do you want full access?
Subscribe today to unlock all pages.

Trusted by 1+ million students worldwide

6
CP600038E – BUSINESS INTELLIGENCE TECHNOLOGIES
Figure 1: Process Setup for The Decision Tree.
Set role operator has been set to Churn as attribute label and target role as label. This
helped in the understanding of the data set which would be able to show the loyalty of the
customer in the form of a tree.
Figure 2: The Decision Tree Created Form the Process
From the initial view of the tree, it can be said that the basic requirement for the
loyalty of the customer is based on the gender of the customer. Male customers are more
loyal whereas female customers are divided up based on the other criteria’s for the finding of
their loyalty.
Tree
Gender = female
| Age > 89.500: loyal {loyal=2, churn=0}
| Age ≤ 89.500
| | Age > 30.500: churn {loyal=58, churn=229}
Paraphrase This Document
Need a fresh take? Get an instant paraphrase of this document with our AI Paraphraser

7
CP600038E – BUSINESS INTELLIGENCE TECHNOLOGIES
| | Age ≤ 30.500
| | | LastTransaction > 179.500: churn {loyal=0, churn=4}
| | | LastTransaction ≤ 179.500
| | | | LastTransaction > 14
| | | | | Payment Method = cash: churn {loyal=4, churn=14}
| | | | | Payment Method = cheque
| | | | | | Age > 24.500: loyal {loyal=2, churn=1}
| | | | | | Age ≤ 24.500: churn {loyal=0, churn=4}
| | | | | Payment Method = credit card: loyal {loyal=73, churn=14}
| | | | LastTransaction ≤ 14: churn {loyal=0, churn=2}
Gender = male: loyal {loyal=439, churn=54}
Table 1: The Descriptive View of the Decision Tree
This chart can also be studied in place of the decision tree to understand the flow of
data in the tree.
Clustering
Figure 3: Process Setup for the K – Means Clustering.
The clustering analysis helps in the grouping of the data into similar groups based on
their trend and properties. This helps in the understanding of the values as well as processing
the data in the single cluster as one would also help in the reduction of the time required for
the analysis. The data is first converted into complete numerical values. The k – means

8
CP600038E – BUSINESS INTELLIGENCE TECHNOLOGIES
clustering cannot be performed on any kind of textual data values. Thus, the columns of
gender, payment method and churn are converted to numerical 0 and 1. This data is then sent
to k – means clustering method for the completion of the process.
Figure 4: Tree View of the Clustering Analysis.
The size of the leafs shows the number of data in each of the cluster. All 900 data is
sorted out into these ten clusters.
Cluster Model
Cluster 0: 92 items
Cluster 1: 131 items
Cluster 2: 61 items
Cluster 3: 54 items
Cluster 4: 101 items
Cluster 5: 61 items
Cluster 6: 117 items
⊘ This is a preview!⊘
Do you want full access?
Subscribe today to unlock all pages.

Trusted by 1+ million students worldwide

9
CP600038E – BUSINESS INTELLIGENCE TECHNOLOGIES
Cluster 7: 95 items
Cluster 8: 130 items
Cluster 9: 58 items
Total number of items: 900
Table 2: Description View of the Cluster Analysis.
This table shows the user with the number of data in each of the cluster.
Figure 5: Centroid Table Created From The Clustering Analysis.
The centroid table shows the centroid of the cluster of each of the data columns,
which is one of the points from the cluster. The k – means algorithm starts with 10 points for
this data set. The start points are taken randomly from 10 randomly drawn input sets.
Paraphrase This Document
Need a fresh take? Get an instant paraphrase of this document with our AI Paraphraser

10
CP600038E – BUSINESS INTELLIGENCE TECHNOLOGIES
Figure 6: Plotting Of The Graph Based On The Clustering Analysis.
The graph plotted based on the centroid table derived from the k – means algorithm.
Linear regression
Figure 7: Process Setup for the Linear Regression.
The linear regression process helps in finding the best suitable value for the analysis
of the data set based on the role that is set for one of the value in the data set. For this
analysis, the set role process function has been configured to be set with Churn as attribute
name and the target role as label. The nominal to numerical changes any nominal values in
the datga set to numerical value. The output of the set role function is used for the analysis of
the linear regression.

11
CP600038E – BUSINESS INTELLIGENCE TECHNOLOGIES
Figure 8: Data Table Created After The Completion Of The Linear Regression Analysis
On The Data Set.
The linear regression equation is:
Y=A + BX1 + CX2 + DX3 + EX4 + FX5
Here in the equation,
Y is the dependent variable of the data set,
X1, X2, X3, X4, and X5are the independent variables of the dataset
A is intercept
B, C, D, E, F are the coefficient of the independent variables.
Where Y=churn,
X1 = gender = male, X2 = gender = female, X3 = payment method, X4 = age, X5 = last
transaction,
A = 0.143, B = -0.265, C= 0.265, D = -0.116, E= 0.004, F = 0.001
The equation can thus be said to be in the form of
Churn = 0.143 - 0.265 * Gender = male + 0.265 * Gender = female - 0.116 * Payment
Method = credit card + 0.004 * Age + 0.001 * LastTransaction
LinearRegression
- 0.265 * Gender = male
⊘ This is a preview!⊘
Do you want full access?
Subscribe today to unlock all pages.

Trusted by 1+ million students worldwide
1 out of 15
Related Documents

Your All-in-One AI-Powered Toolkit for Academic Success.
+13062052269
info@desklib.com
Available 24*7 on WhatsApp / Email
Unlock your academic potential
Copyright © 2020–2025 A2Z Services. All Rights Reserved. Developed and managed by ZUCOL.