Data Handling Assignment: Excel, Clustering, and Data Mining Methods
VerifiedAdded on 2022/12/29
|13
|3192
|55
Homework Assignment
AI Summary
This assignment delves into various aspects of data handling and analysis. Part 1 focuses on using Microsoft Excel for pre-processing data, including the application of IF functions, lookup features, and the creation of charts and graphs for data visualization. Part 2 explores clustering techniques using the smile_clinic.csv dataset, providing a specific example of two-step clustering and its interpretation. Furthermore, it explains common data mining methods applicable in business contexts, accompanied by real-world examples to illustrate their practical use. The assignment also provides a comparative analysis of the advantages and disadvantages of using SPSS over Excel for data analysis, offering a comprehensive understanding of different data handling tools and techniques. The content covers data analysis, business applications, and data mining techniques.

DATA
HANDLING
HANDLING
Paraphrase This Document
Need a fresh take? Get an instant paraphrase of this document with our AI Paraphraser
Table of Contents
PART 1............................................................................................................................................3
1. Use of excel of pre-processing the data...................................................................................3
Use of IF function in Excel......................................................................................................4
Lookup.....................................................................................................................................5
Charts and Graphs....................................................................................................................6
PART 2............................................................................................................................................7
2.1 Using the smile_clinic.csv give a specific example of clustering.........................................7
2.2 Explain the most common data mining methods that can be used in business with real
world examples............................................................................................................................8
2.3 Advantages and disadvantages of SPSS over excel............................................................12
REFERENCES..............................................................................................................................13
PART 1
1. Use of excel of pre-processing the data
Microsoft Excel is utilized in business, for entrepreneurs, for housewives, for information
examination, in day by day progress reports, in profession advancement, in business. MS Excel
is broadly utilized in monetary exercises. The employments of Microsoft Excel are as per the
following:
1. Dissecting AND STORING DATA
Microsoft Excel is a superb apparatus for examining and putting away information in a
framework structure. It is permitted to enter information in different lines and segments of the
accounting page. Utilizing pie diagrams, outlines, tables adds mining to the information
(Pashazadeh and Navimipour, 2018).
Dominate can be utilized to bring information from various records and archives. You can store
the information in a deliberate manner. Doing this will help us save a great deal of time, aside
from this, the translation gets simpler for you to store the information. Isn't arranged makes
breaking down information simpler with the assistance of Pivot table.
2. Information RECOVERY
Microsoft encourages you recuperate your information if your information is lost. MS Excel
design causes you reestablish information.
3. MAKING REPORT
Reports should be possible with the assistance of MS Excel and MS Word MS Word gives the
report in a composed structure, while MS Excel gives the report in a table organization. MS
Excel can give correlations with various clients all at once.
MS Excel helps proprietors organizations report their business, however it additionally assists
workers with following their day by day progress reports, it likewise assists educators with
⊘ This is a preview!⊘
Do you want full access?
Subscribe today to unlock all pages.
Trusted by 1+ million students worldwide
utilizing outlines, styles, shapes, recipes to help their understudies Helps to instruct, feature
significant cells and without a doubt (Young-Saver, and et.al., 2018).
4. Exploration
We normally take a gander at past patterns in greatness, yet greatness likewise causes us to finish
our exploration for what's to come. Following a couple of years what the situation will be for
sure on the off chance that we can accomplish our work along these lines. Exploration helps
answer your inquiry concerning what will occur and what will occur.
Through different recipes and past patterns, we can make prospects about our future. As
indicated by this examination work done by organizations, arranging and advancement will be
done (Hong, and et.al., 2019).
5. Restrictive FORMATTING
The utilization of restrictive arranging causes us to stamp exceedingly significant figures.
Contingent organizing likewise encourages us discover issues where we need to feature it. It can
likewise help in looking at changed qualities, in discovering copies.
Use of IF function in Excel
The IF work or IF explanation in dominate is comprised of three sections isolated by a comma.
Condition
What to show when the condition is met
What to show if the condition isn't met
In this model, we will discover on which date deals and benefit declined and on which date
increments from superstore deals 2, and afterward perceive how to make the "IF Function" bit by
bit.
Most importantly reorder date of request, deals and benefits on independent sheet.
Presently modify the information taking old date first through arranging capacity of
dominate sheet.
Select the cell where you need to make the "IF Function".
Paraphrase This Document
Need a fresh take? Get an instant paraphrase of this document with our AI Paraphraser
Type the code in the cell: = if (
Type condition with comma: B2>B3,
Type what you need to show when the condition is met. In the event that you need to
show text, compose inside quotes: "Decrease"
Type a comma:,
On the off chance that you don't satisfy the condition inside quotes, type: "Increment"
At that point close the section and press Enter key.
The IF work made above will resemble this: = if (B2>B3, "Decrease", "Increment")
So IF work says in the event that the speed or incentive in cell B2 is more than B3, at that point
show Decline and in the event that it is under B3, at that point show Increase.
Subsequent to squeezing the Enter key, you will get the aftereffect of cell B4. On the off chance
that you need to see the outcome, drag the handle of the cell on D4 down to cell D8400.
Lookup
When you are in an interview, which demands excellent knowledge it is no surprise that they
will first ask what is H Lookup and V Lookup. It is almost an indispensable skill whether you
like it or not. When you are working with small amounts, it is easy to find anything in the data.
However, it will be a very difficult and time-consuming task to look for anything within the data
as the data grows (Zhou, and et.al., 2017).
Lookup Value: The base value or criterion value to search in the table. This is a reference value
for the table.
Table series: The table that contains your target values. This is raw data to find what you want
from the table.
Row index number: This represents the row number where your target value is. The first line is
1.
[Range_ lookup]: It consists of two sets one is true (1) which looks for the second match from
the table and the other one is false (0) which looks for exact match from the table.
Demonstration of Look up function on given situation of Superstore Sale:
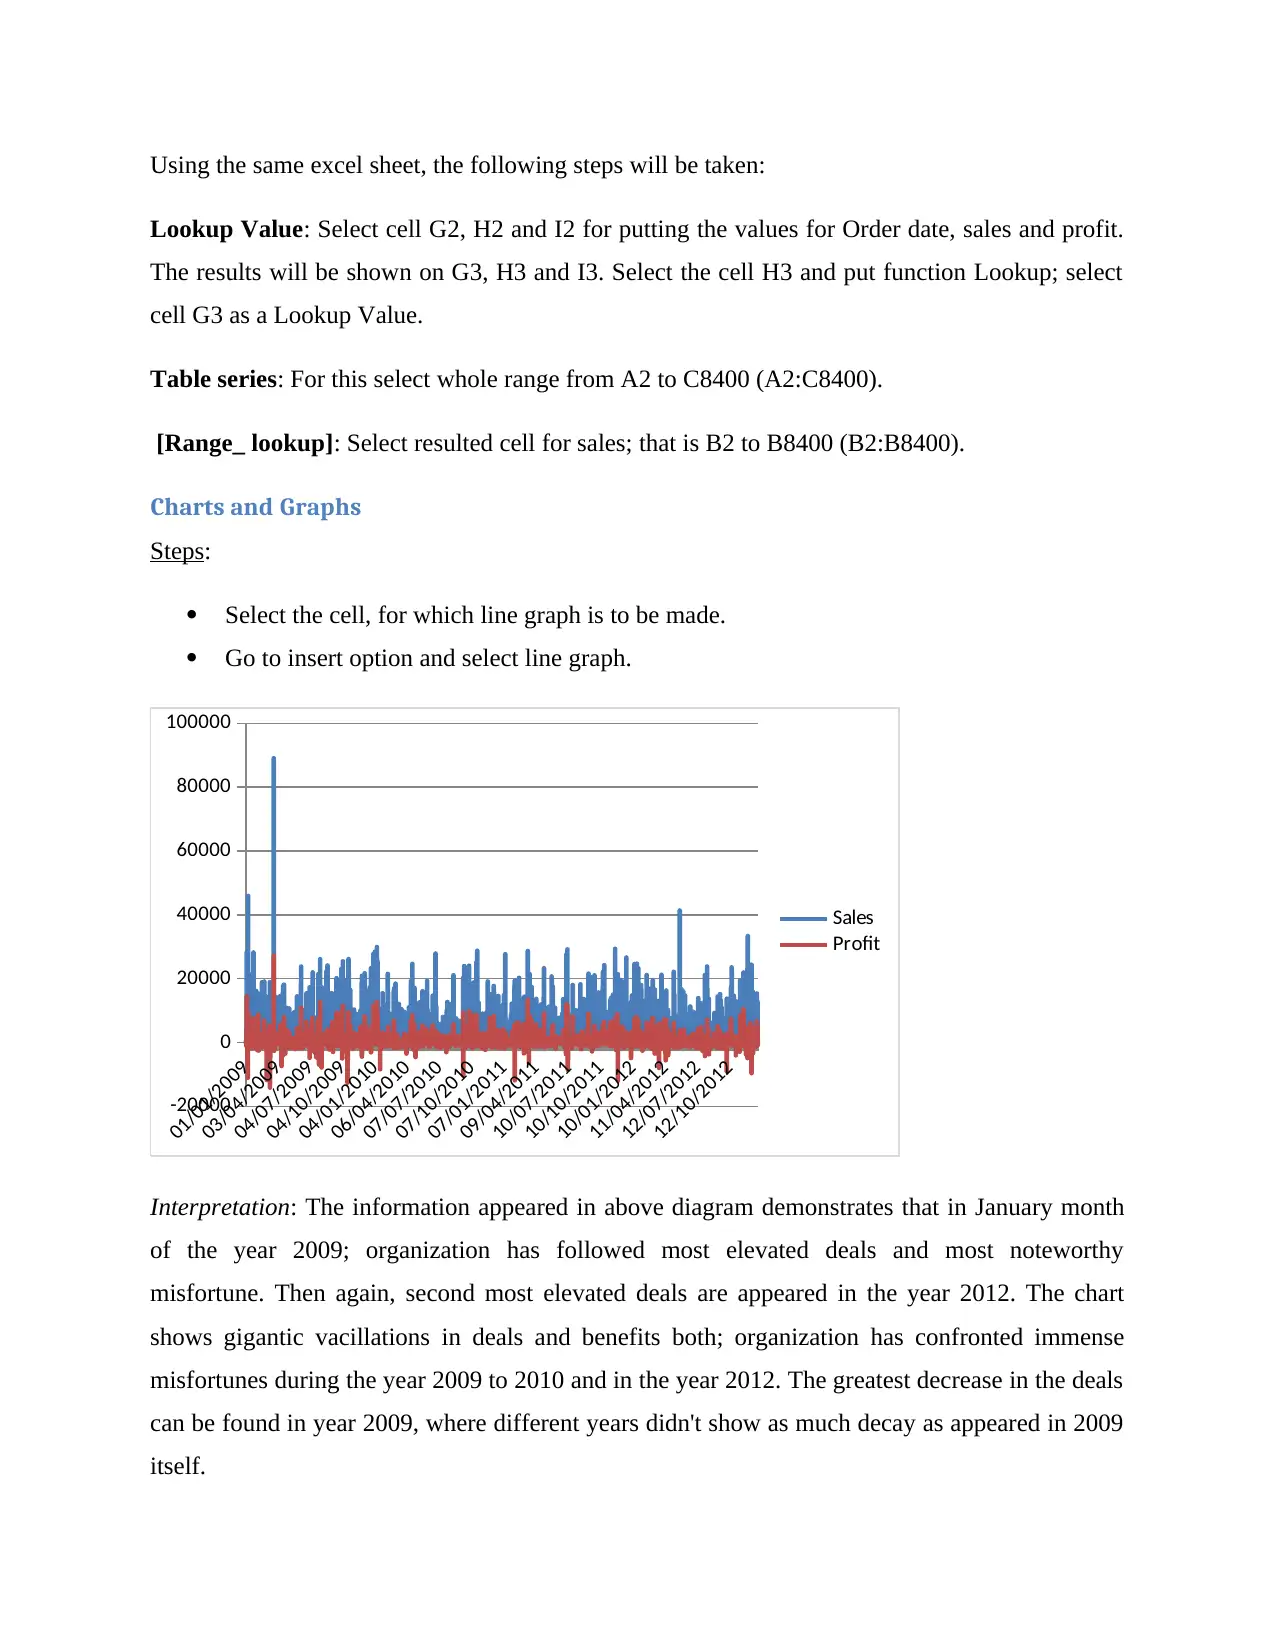
Using the same excel sheet, the following steps will be taken:
Lookup Value: Select cell G2, H2 and I2 for putting the values for Order date, sales and profit.
The results will be shown on G3, H3 and I3. Select the cell H3 and put function Lookup; select
cell G3 as a Lookup Value.
Table series: For this select whole range from A2 to C8400 (A2:C8400).
[Range_ lookup]: Select resulted cell for sales; that is B2 to B8400 (B2:B8400).
Charts and Graphs
Steps:
Select the cell, for which line graph is to be made.
Go to insert option and select line graph.
01/01/2009
03/04/2009
04/07/2009
04/10/2009
04/01/2010
06/04/2010
07/07/2010
07/10/2010
07/01/2011
09/04/2011
10/07/2011
10/10/2011
10/01/2012
11/04/2012
12/07/2012
12/10/2012
-20000
0
20000
40000
60000
80000
100000
Sales
Profit
Interpretation: The information appeared in above diagram demonstrates that in January month
of the year 2009; organization has followed most elevated deals and most noteworthy
misfortune. Then again, second most elevated deals are appeared in the year 2012. The chart
shows gigantic vacillations in deals and benefits both; organization has confronted immense
misfortunes during the year 2009 to 2010 and in the year 2012. The greatest decrease in the deals
can be found in year 2009, where different years didn't show as much decay as appeared in 2009
itself.
⊘ This is a preview!⊘
Do you want full access?
Subscribe today to unlock all pages.
Trusted by 1+ million students worldwide
PART 2
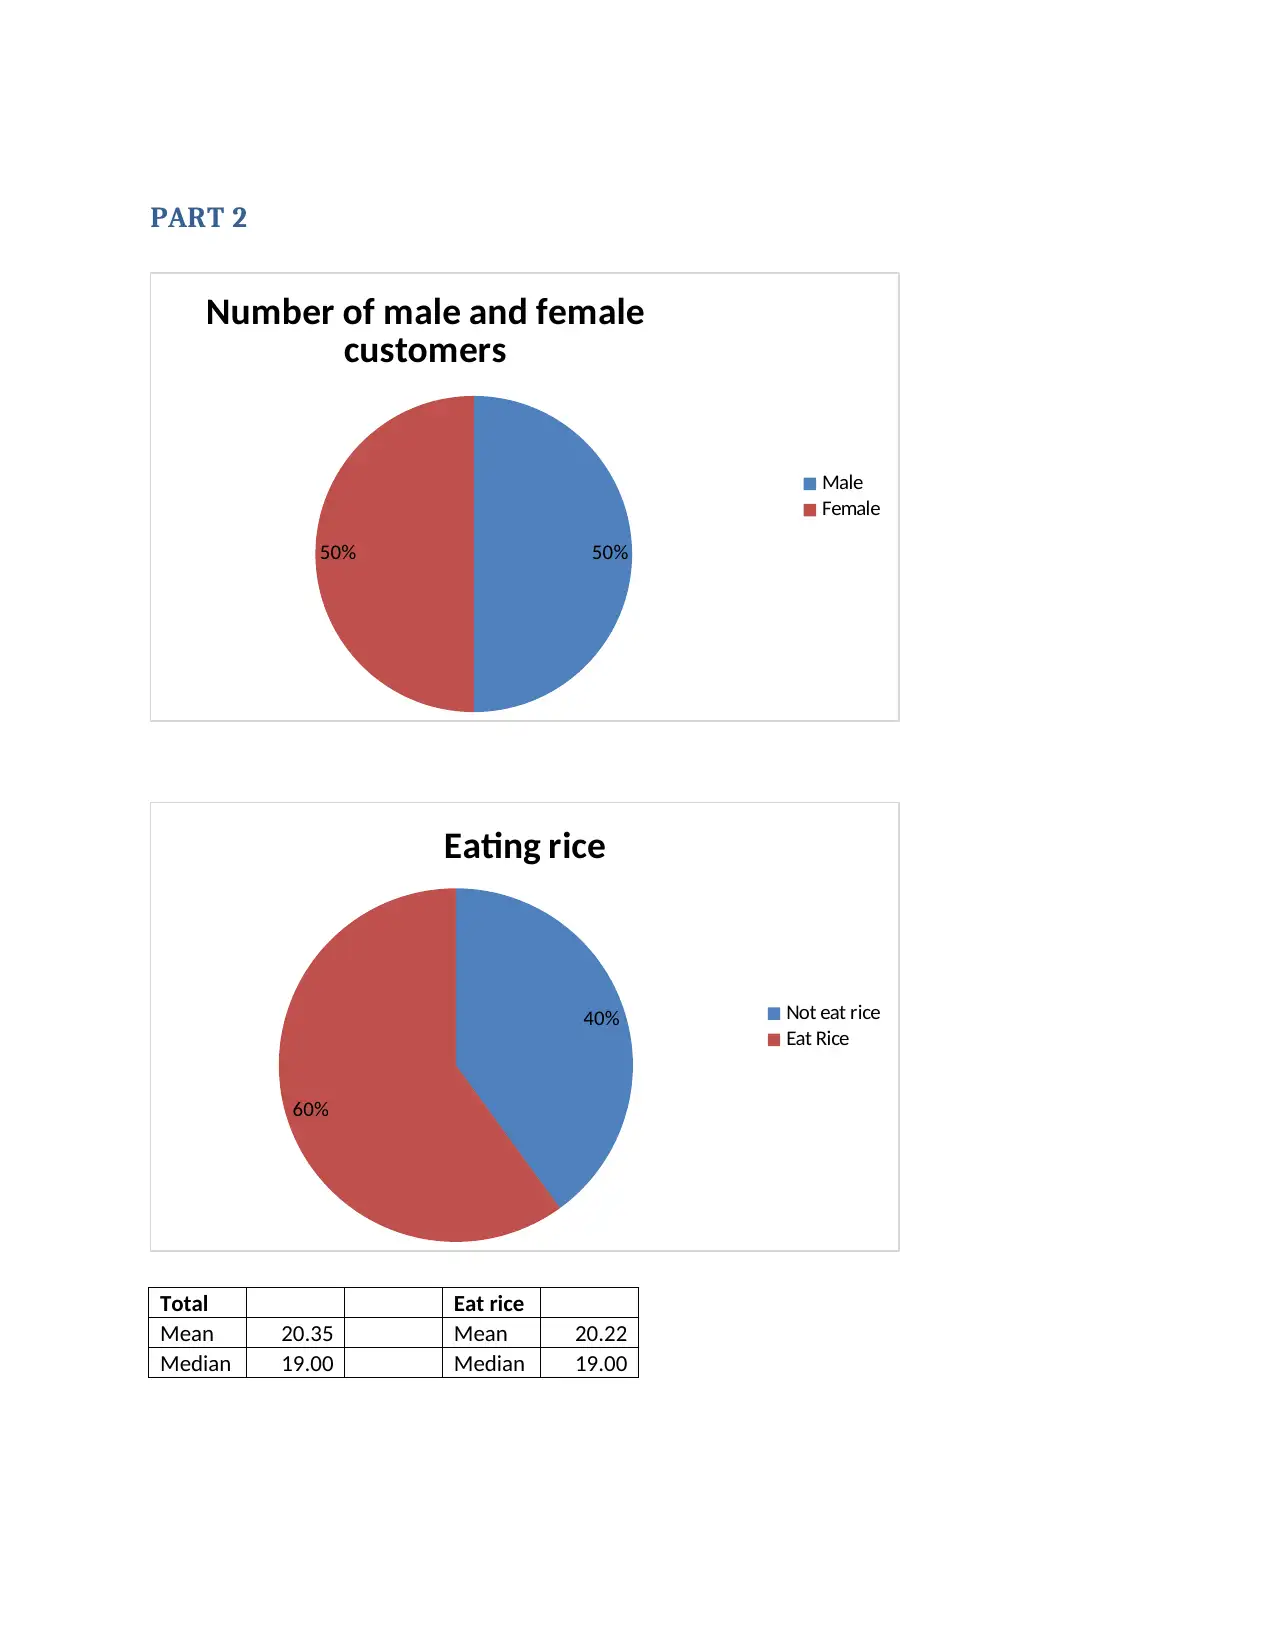
50%50%
Number of male and female
customers
Male
Female
40%
60%
Eating rice
Not eat rice
Eat Rice
Total Eat rice
Mean 20.35 Mean 20.22
Median 19.00 Median 19.00
50%50%
Number of male and female
customers
Male
Female
40%
60%
Eating rice
Not eat rice
Eat Rice
Total Eat rice
Mean 20.35 Mean 20.22
Median 19.00 Median 19.00
Paraphrase This Document
Need a fresh take? Get an instant paraphrase of this document with our AI Paraphraser
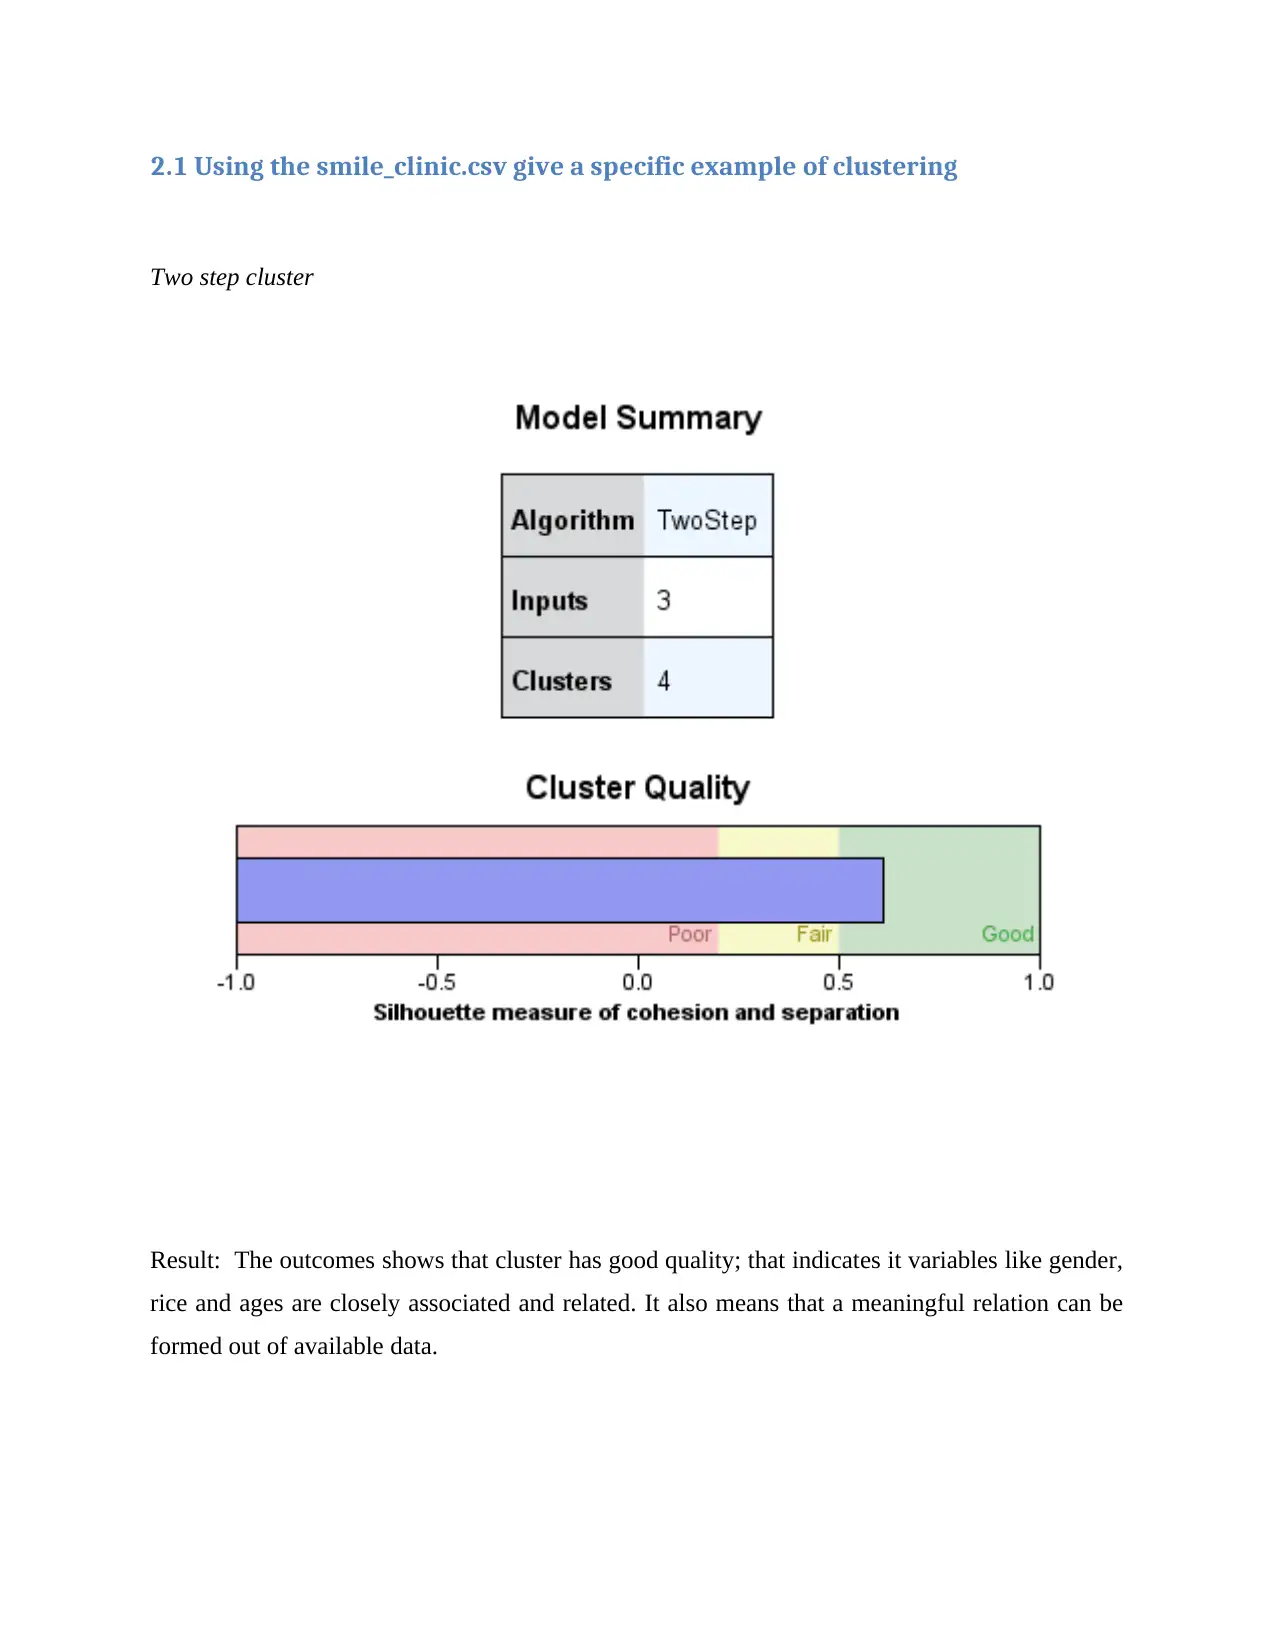
2.1 Using the smile_clinic.csv give a specific example of clustering
Two step cluster
Result: The outcomes shows that cluster has good quality; that indicates it variables like gender,
rice and ages are closely associated and related. It also means that a meaningful relation can be
formed out of available data.
Two step cluster
Result: The outcomes shows that cluster has good quality; that indicates it variables like gender,
rice and ages are closely associated and related. It also means that a meaningful relation can be
formed out of available data.
2.2 Explain the most common data mining methods that can be used in
business with real world examples
Data mining techniques - Advances in data innovation have stimulated many knowledge bases in
various fields. Therefore, it is necessary to store and control important information that can be
used later to decide on business options and development exercises (Blann, 2018). Extracting
information is the key to accessing useful data and examples from big data. Information
extraction involves sorting, extracting, analyzing and measuring information. This is called
information extraction from the circle of information disclosure, information or information
analysis / design. Information mining is an intelligent cycle of searching for valuable data to find
useful information. When data and examples are found, they tend to be used to select business
development options. Data mining tools can answer various questions identified by your industry
that were difficult to solve. They also envision future models that allow buyers to decide
proactive options. Information extraction involves three stages, namely:
Analysis: in this phase the information is cleaned and converted into another structure. The idea
of information is decided in the same way.
Sample Recognition: The next step is to select the sample that makes the best prediction.
Configuration: Identified examples are used to achieve the desired results.
Information Extraction Method: One of the main tasks in information extraction is to choose the
right information extraction strategy. Information extraction methods should be selected
according to the type of business and the type of problem facing your business. A rigorous
approach should be used to improve the accuracy and appropriateness of cost use. Of course
seven main methods of information extraction are reviewed in this article. There are several
other methods of extracting information as well, but these seven are routinely used by money
managers (Konstantopoulos and Pantziou, 2018). Some of the methods are examined below:
1. Measurable methods
Information extraction techniques are part of the measurement arithmetic that governs the
sharing and production of information. Strategies that can be measured as a means of extracting
information in a variety of ways are not considered. But it does help to find designs and create
⊘ This is a preview!⊘
Do you want full access?
Subscribe today to unlock all pages.
Trusted by 1+ million students worldwide
patterns of conscience. As a result, the information analyst should have some knowledge of the
various methods of fact. Today, people have to handle gigantic information measures and draw
meaningful examples from them. Insights can greatly help you answer questions about your
knowledge (Friese, 2019).
• What are some examples in their knowledge base?
• What is the probability of this happening?
• Which designs are most valuable to the business?
• What is an advanced setting that offers a point-by-point view of the information base?
It's not just ideas that answer these questions that help summarize and describe information. It
also helps to provide hassle-free information data. Individuals can settle for false choices through
measurable relationships (Biffl, Lüder & Gerhard, 2017). There are different types of
information, but the most important and useful approach is the collection and analysis of
information. As there are many approaches to gathering information.
2. Establishment technologies
Institution is probably the most established method used in information extraction. Fundamental
analysis is the way to identify equally diverse information. This will help understand the
differences and similarities between the information. Here and there is what is called separation
and it helps users understand what is happening in the knowledge base. For example, an
insurance company may rely on customers depending on their payment, age, approach and
nature of the case. There are different types of clustering strategies (Patan and Babu, 2018). They
are:
I. Division strategies
II. Classification of playing methods
III. Density-based methods
IV. Grid-based methods
Paraphrase This Document
Need a fresh take? Get an instant paraphrase of this document with our AI Paraphraser
V. Form-based approaches
3. View
Ideas are the most useful strategy used to find information projects. This strategy is used at the
beginning of the data mining phase. There is a lot of testing going on these days to put in place
interesting information, known as a chase dispatch. There are many data mining methods that
give good examples for good information. However, impersonation is a strategy that turns awful
information into good information, so different types of information extraction techniques can be
used to find protected projects.
4. Decision tree technology for registration
A choice tree is a prescient pattern and the name suggests that it resembles a tree. In this way,
each part of the tree is seen as a question of order and the leaves of the tree are considered
fragments of the data set identified by that particular arrangement. This strategy can be used for
research study, information editing and estimation work.
The selection tree can be thought of as a folder of the first data set in which separation is
performed for a specific definition. The cookie contains some information in the prediction of its
data. Choice trees provide results that the customer can easily see.
5. Natural network
Natural bodies are another important practice that people use today. This approach is consistently
used in the early stages of innovation in information extraction. The neural false body was
created by a network of human consciousness (Heybrock, and et.al., 2018).
Natural organizations are far from difficult to use because they are equipped to a certain level
and despite this the client does not need to think much about the work or the knowledge base. In
any case, for neural groups to function effectively, you need to know:
• How are the hubs connected?
• How many preparation units should be used?
• When should the preparation cycle end?
6. Connected rules technology
This strategy helps to find a connection between at least two elements. It helps to know the
connection between different factors in the knowledge base. Find hidden examples in the index
of information used to identify the unstable factors and events of various factors that manifest
themselves with the highest frequencies.
2.3 Advantages and disadvantages of SPSS over excel
SPSS is an open source data mining developer. This will help with the AI computation, but still a
data plan and meta-studies on how to capture and collect it is crucial. The entire configuration is
written in Java, so it tends to run at any level. The package contains three special interface
functions: command line interface, GUI Explorer interface (which allows you to evaluate a
specific component, process and display of a dataset, and a test GUI interface) (one which allows
you to make predictions several in a collection and discuss the results).
Advantage over excel
The real state of a package like SPSS is that it covers the full range of data processing, including
decision making and data processing. This means that only one area of data is required, and it is
incredibly simple to imagine it and look for ways to modify it. Also there is a GUI package,
which should require you to use it.
Disadvantages
Perhaps the biggest drawback of such mining bureaus is that they don't incorporate the latest
methods. For example, MLP (Energy Back Support) performed and reproduced critical
preparation calculations, and SVM uses only polynomial components and does not develop
mathematical evaluations. Next, you will need to combine SPSS with various tools, such as
group analysis, multivariate repeater analysis, and link analysis. Another major drawback comes
from the zero performance: the documentation for the GUI is very limited.
⊘ This is a preview!⊘
Do you want full access?
Subscribe today to unlock all pages.
Trusted by 1+ million students worldwide
1 out of 13
Related Documents


Your All-in-One AI-Powered Toolkit for Academic Success.
+13062052269
info@desklib.com
Available 24*7 on WhatsApp / Email
![[object Object]](/_next/static/media/star-bottom.7253800d.svg)
Unlock your academic potential
Copyright © 2020–2026 A2Z Services. All Rights Reserved. Developed and managed by ZUCOL.