Data Handling Assignment: Data Preprocessing, Clustering, and Mining
VerifiedAdded on 2023/01/11
|16
|3424
|61
Homework Assignment
AI Summary
This assignment solution provides a comprehensive overview of data handling techniques, focusing on the use of Microsoft Excel and Weka for data preprocessing, clustering, and data mining. Part 1 demonstrates the application of Excel for data analysis, including the use of the IF function, the Lookup function, and the creation of charts and graphs to visualize data. Part 2 delves into the application of Weka, specifically using the audidealership.csv dataset to demonstrate clustering and data mining methods. The solution explains common data mining methods used in business with real-world examples, such as statistical techniques. It also compares the advantages and disadvantages of Weka over Excel. The assignment covers data exploration, pattern recognition, and deployment, highlighting the importance of these techniques for informed decision-making. The document includes the clustering model and its results using Weka, and provides interpretations of the findings.

DATA
HANDLING
HANDLING
Paraphrase This Document
Need a fresh take? Get an instant paraphrase of this document with our AI Paraphraser
Contents
PART 1............................................................................................................................................3
1. Use of excel of pre-processing the data...................................................................................3
Use of IF function in Excel......................................................................................................4
Charts and Graphs....................................................................................................................5
PART 2............................................................................................................................................6
2.1 Using the audidealership.csv provided in conjunction with Weka give a specific example
of clustering.................................................................................................................................6
2.2 Explain the most common data mining methods that can be used in business with real
world examples..........................................................................................................................10
2.3 Advantages and disadvantages of Weka over excel............................................................13
REFERENCES..............................................................................................................................14
PART 1
1. Use of excel of pre-processing the data
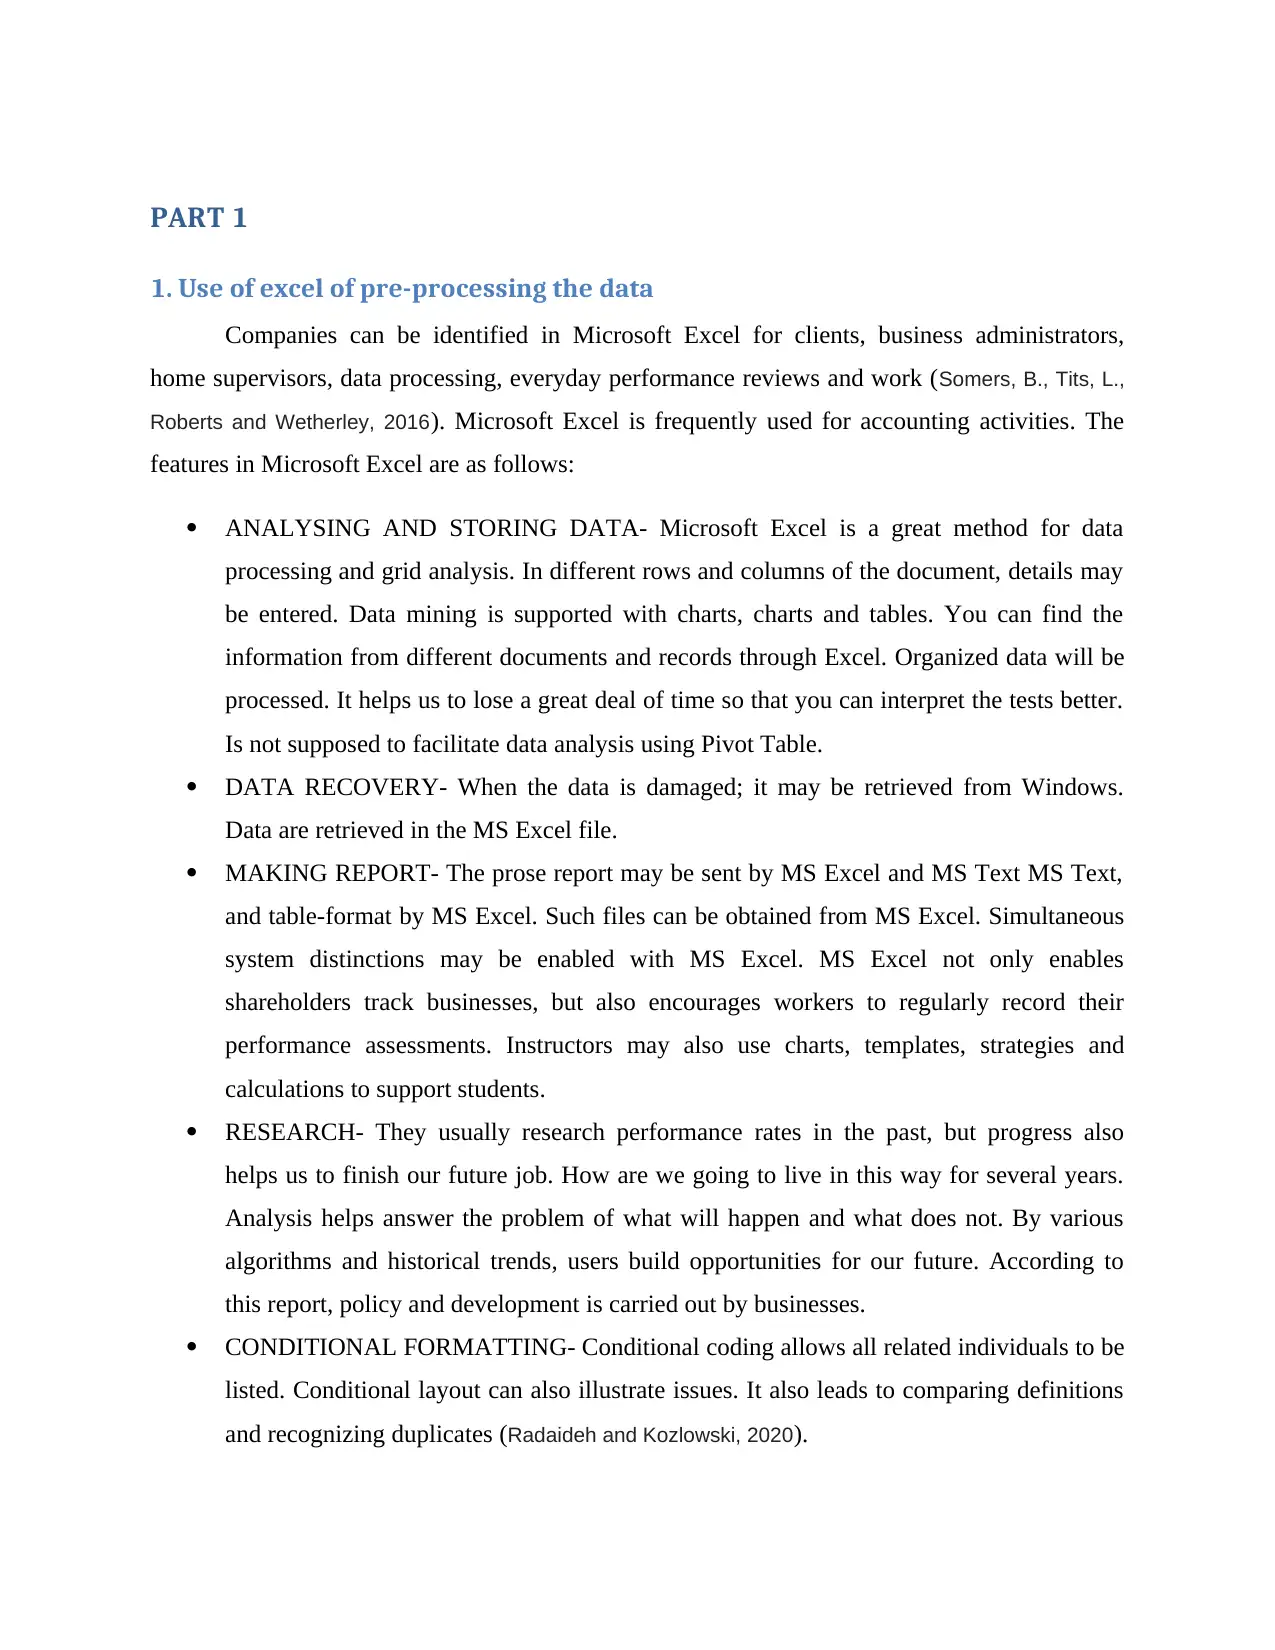
Companies can be identified in Microsoft Excel for clients, business administrators,
home supervisors, data processing, everyday performance reviews and work (Somers, B., Tits, L.,
Roberts and Wetherley, 2016). Microsoft Excel is frequently used for accounting activities. The
features in Microsoft Excel are as follows:
ANALYSING AND STORING DATA- Microsoft Excel is a great method for data
processing and grid analysis. In different rows and columns of the document, details may
be entered. Data mining is supported with charts, charts and tables. You can find the
information from different documents and records through Excel. Organized data will be
processed. It helps us to lose a great deal of time so that you can interpret the tests better.
Is not supposed to facilitate data analysis using Pivot Table.
DATA RECOVERY- When the data is damaged; it may be retrieved from Windows.
Data are retrieved in the MS Excel file.
MAKING REPORT- The prose report may be sent by MS Excel and MS Text MS Text,
and table-format by MS Excel. Such files can be obtained from MS Excel. Simultaneous
system distinctions may be enabled with MS Excel. MS Excel not only enables
shareholders track businesses, but also encourages workers to regularly record their
performance assessments. Instructors may also use charts, templates, strategies and
calculations to support students.
RESEARCH- They usually research performance rates in the past, but progress also
helps us to finish our future job. How are we going to live in this way for several years.
Analysis helps answer the problem of what will happen and what does not. By various
algorithms and historical trends, users build opportunities for our future. According to
this report, policy and development is carried out by businesses.
CONDITIONAL FORMATTING- Conditional coding allows all related individuals to be
listed. Conditional layout can also illustrate issues. It also leads to comparing definitions
and recognizing duplicates (Radaideh and Kozlowski, 2020).
1. Use of excel of pre-processing the data
Companies can be identified in Microsoft Excel for clients, business administrators,
home supervisors, data processing, everyday performance reviews and work (Somers, B., Tits, L.,
Roberts and Wetherley, 2016). Microsoft Excel is frequently used for accounting activities. The
features in Microsoft Excel are as follows:
ANALYSING AND STORING DATA- Microsoft Excel is a great method for data
processing and grid analysis. In different rows and columns of the document, details may
be entered. Data mining is supported with charts, charts and tables. You can find the
information from different documents and records through Excel. Organized data will be
processed. It helps us to lose a great deal of time so that you can interpret the tests better.
Is not supposed to facilitate data analysis using Pivot Table.
DATA RECOVERY- When the data is damaged; it may be retrieved from Windows.
Data are retrieved in the MS Excel file.
MAKING REPORT- The prose report may be sent by MS Excel and MS Text MS Text,
and table-format by MS Excel. Such files can be obtained from MS Excel. Simultaneous
system distinctions may be enabled with MS Excel. MS Excel not only enables
shareholders track businesses, but also encourages workers to regularly record their
performance assessments. Instructors may also use charts, templates, strategies and
calculations to support students.
RESEARCH- They usually research performance rates in the past, but progress also
helps us to finish our future job. How are we going to live in this way for several years.
Analysis helps answer the problem of what will happen and what does not. By various
algorithms and historical trends, users build opportunities for our future. According to
this report, policy and development is carried out by businesses.
CONDITIONAL FORMATTING- Conditional coding allows all related individuals to be
listed. Conditional layout can also illustrate issues. It also leads to comparing definitions
and recognizing duplicates (Radaideh and Kozlowski, 2020).
⊘ This is a preview!⊘
Do you want full access?
Subscribe today to unlock all pages.
Trusted by 1+ million students worldwide
Security- MS Excel primarily provides Excel file security that allows users to easily
handle their files. Both MS Excel files are held by the visual simple programming in an
excellent folder. In MS Excel, people store their essential data and keep their data
organized in order to save time. Most people love securing their data so no one can reach
or kill them, and MS Excel is very great at fixing the issue.
Use of IF function in Excel
The IF feature or IF declaration in Excel consists of a comma dividing three pieces.
• Condition
• How to show that the requirements are not fulfilled
• In this situation, it is easy to see which points of sales and profit is reduced and on which date
was the transaction from vendors, as well as whether the IF function is conducted stage by step.
• Print and paste the tax time, sales and profit in different sheets first.
• Rearrange old data for the first time by sorting the sheet of excellence feature.
• Choose the cell to produce the "IF Element."
• Form code to cell = if (Virus sort: B2>B3,)
• Insert a code that the consumer needs to test if the condition was met.
• Picking a comma: • Pick "increase"
• Remove the box, and press Enter if the condition was not fulfilled (Afridi, Azam, Yao and
Synovec, 2016).
• If a function shows the amount or significance of the B3 function, then if the significance of the
B3 component is smaller than the B3 component, Increase the parameter of the B1 function
would always mean the IF parameter is higher than B3.
After you click the Enter key, users will receive the cell B4 file. If the consumer wishes to see
the effect, move the handle from D4 to cell D8400.
Paraphrase This Document
Need a fresh take? Get an instant paraphrase of this document with our AI Paraphraser
If users require good details in an interview, they should not be surprised to find out what are H
Lookup and V Lookup first. It is also an essential ability whether or not the customer wants it. If
you work with limited numbers, you will easily find everything in depth. It will also take a lot of
time to locate something in the details as the database expands.
Lookup Value- The search element in the row or foundation component. That is the baseline of
the row.
Table series-The table with the desired values. It is tough information to pick what you want
from the table.
Row index number- It displays in row sums the aim number. The second row is 1.
Range_ lookup]: There are two sets, one correct (1) and another wrong (0), aiming for the same
match in the table. The second match in the series.
Demonstration of Look up function on given situation of Superstore Sale:
Using the same excel sheet, the following steps will be taken:
Lookup Value- A column or row field suits a request and returns the same meaning from a
column or row region LOOKUP's default actions making it easier for Excel to overcome such
problems. Select Cell G2, H2 and I2 for the order time, sales and revenues. The results can occur
on G3, H3 and I3. Select the Lookup function and place the H3 cell; choose G3 cell as Lookup
key (Wirth and Kolain, 2018).
Table series- For the entire set, pick between A2 and C8400 (A2:C8400).
[Range_ lookup]: Choose the purchasing cell, B2 to B8400 (B2:B8400).
Charts and Graphs
Steps:
Choose a cell for a line graph that will be made.
To enable range, pick line graph.
01/01/2009
03/04/2009
04/07/2009
04/10/2009
04/01/2010
06/04/2010
07/07/2010
07/10/2010
07/01/2011
09/04/2011
10/07/2011
10/10/2011
10/01/2012
11/04/2012
12/07/2012
12/10/2012
-20000
0
20000
40000
60000
80000
100000
Sales
Profit
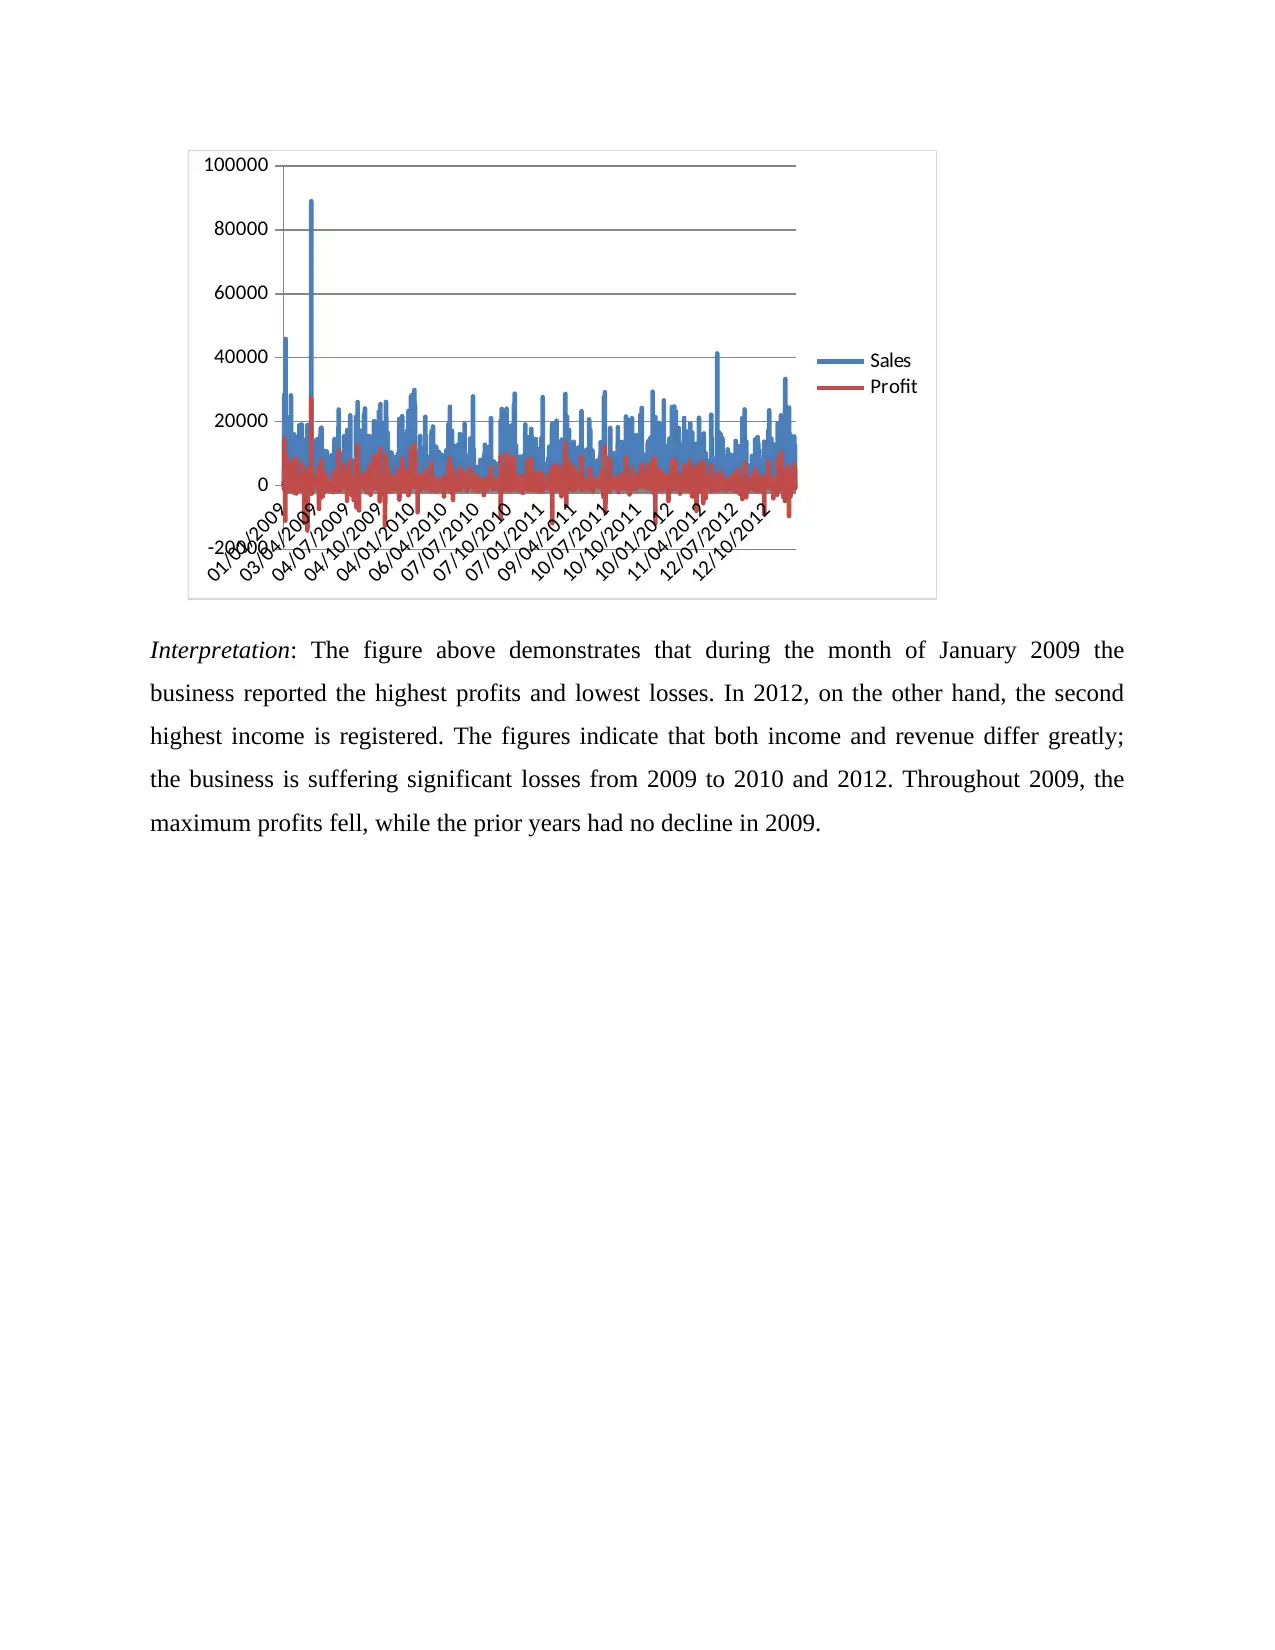
Interpretation: The figure above demonstrates that during the month of January 2009 the
business reported the highest profits and lowest losses. In 2012, on the other hand, the second
highest income is registered. The figures indicate that both income and revenue differ greatly;
the business is suffering significant losses from 2009 to 2010 and 2012. Throughout 2009, the
maximum profits fell, while the prior years had no decline in 2009.
03/04/2009
04/07/2009
04/10/2009
04/01/2010
06/04/2010
07/07/2010
07/10/2010
07/01/2011
09/04/2011
10/07/2011
10/10/2011
10/01/2012
11/04/2012
12/07/2012
12/10/2012
-20000
0
20000
40000
60000
80000
100000
Sales
Profit
Interpretation: The figure above demonstrates that during the month of January 2009 the
business reported the highest profits and lowest losses. In 2012, on the other hand, the second
highest income is registered. The figures indicate that both income and revenue differ greatly;
the business is suffering significant losses from 2009 to 2010 and 2012. Throughout 2009, the
maximum profits fell, while the prior years had no decline in 2009.
⊘ This is a preview!⊘
Do you want full access?
Subscribe today to unlock all pages.
Trusted by 1+ million students worldwide
PART 2
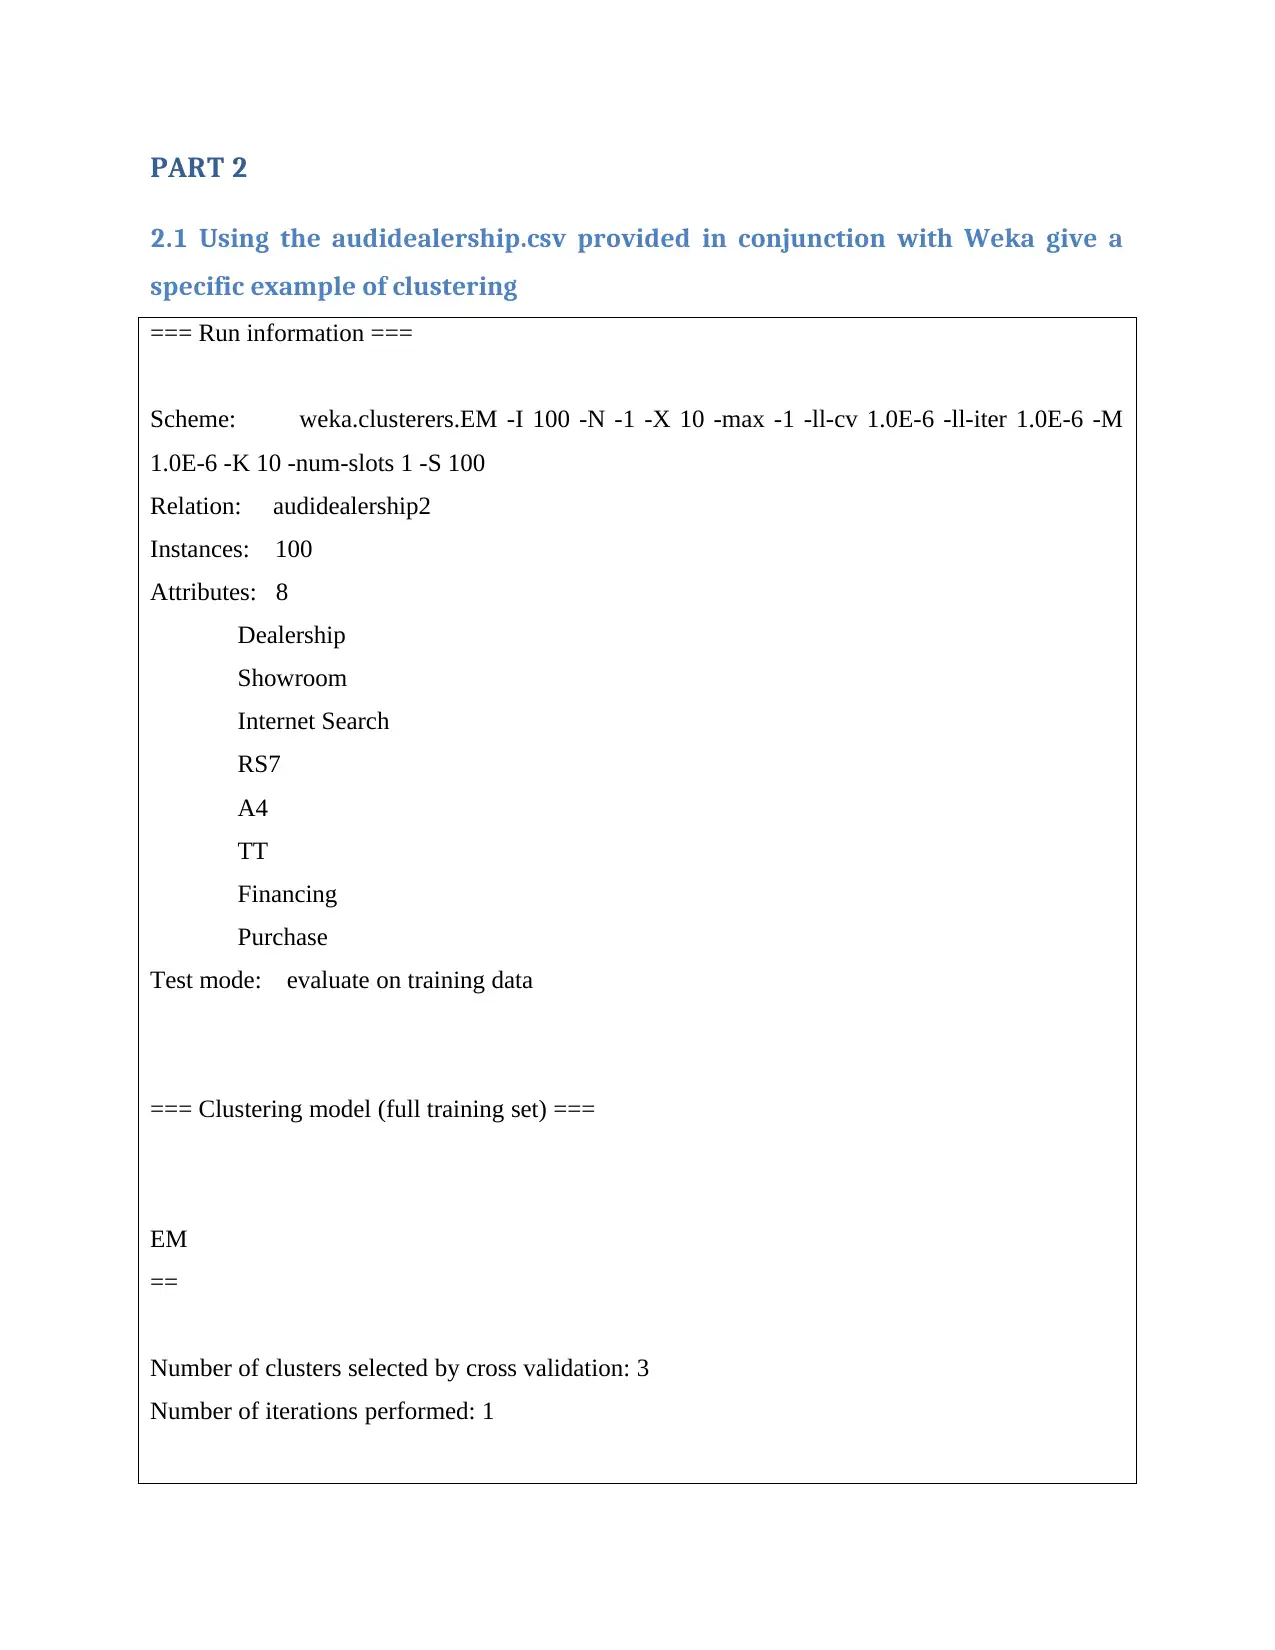
2.1 Using the audidealership.csv provided in conjunction with Weka give a
specific example of clustering
=== Run information ===
Scheme: weka.clusterers.EM -I 100 -N -1 -X 10 -max -1 -ll-cv 1.0E-6 -ll-iter 1.0E-6 -M
1.0E-6 -K 10 -num-slots 1 -S 100
Relation: audidealership2
Instances: 100
Attributes: 8
Dealership
Showroom
Internet Search
RS7
A4
TT
Financing
Purchase
Test mode: evaluate on training data
=== Clustering model (full training set) ===
EM
==
Number of clusters selected by cross validation: 3
Number of iterations performed: 1
Paraphrase This Document
Need a fresh take? Get an instant paraphrase of this document with our AI Paraphraser
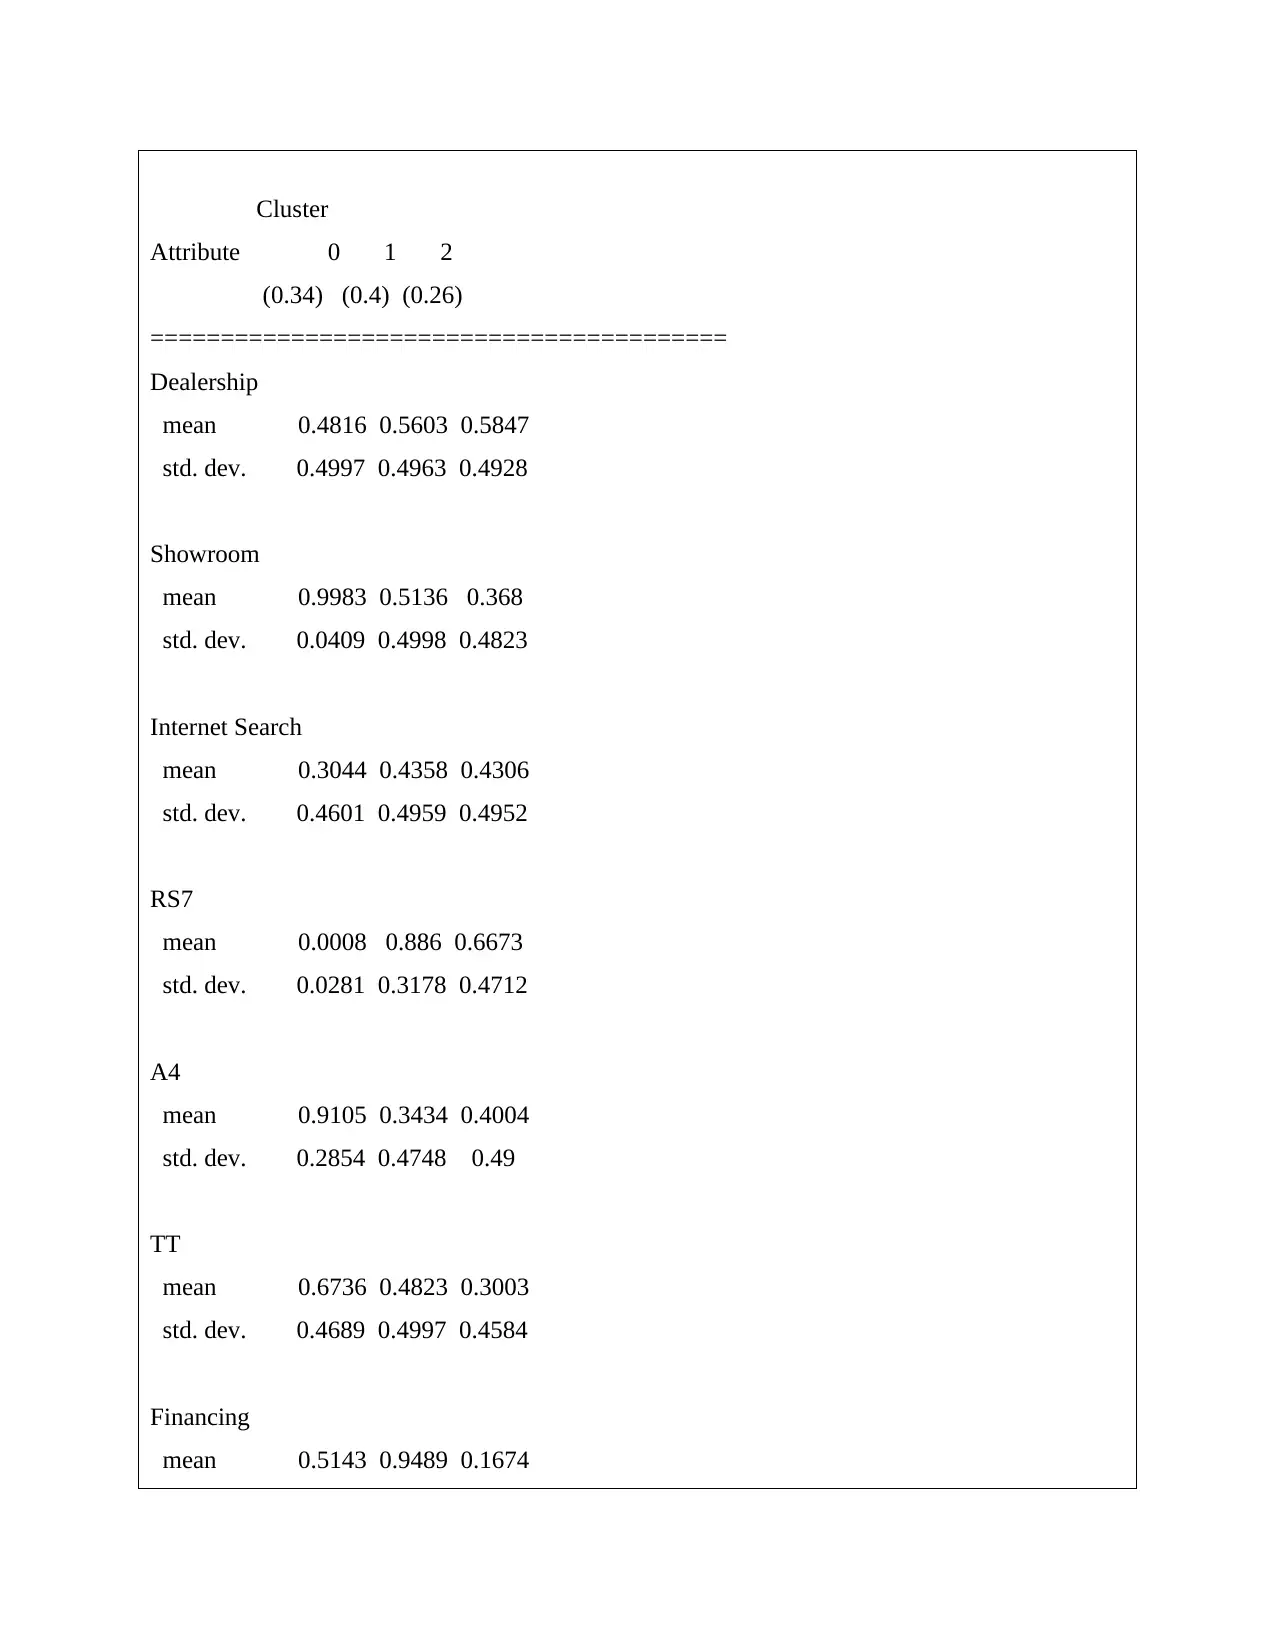
Cluster
Attribute 0 1 2
(0.34) (0.4) (0.26)
=========================================
Dealership
mean 0.4816 0.5603 0.5847
std. dev. 0.4997 0.4963 0.4928
Showroom
mean 0.9983 0.5136 0.368
std. dev. 0.0409 0.4998 0.4823
Internet Search
mean 0.3044 0.4358 0.4306
std. dev. 0.4601 0.4959 0.4952
RS7
mean 0.0008 0.886 0.6673
std. dev. 0.0281 0.3178 0.4712
A4
mean 0.9105 0.3434 0.4004
std. dev. 0.2854 0.4748 0.49
TT
mean 0.6736 0.4823 0.3003
std. dev. 0.4689 0.4997 0.4584
Financing
mean 0.5143 0.9489 0.1674
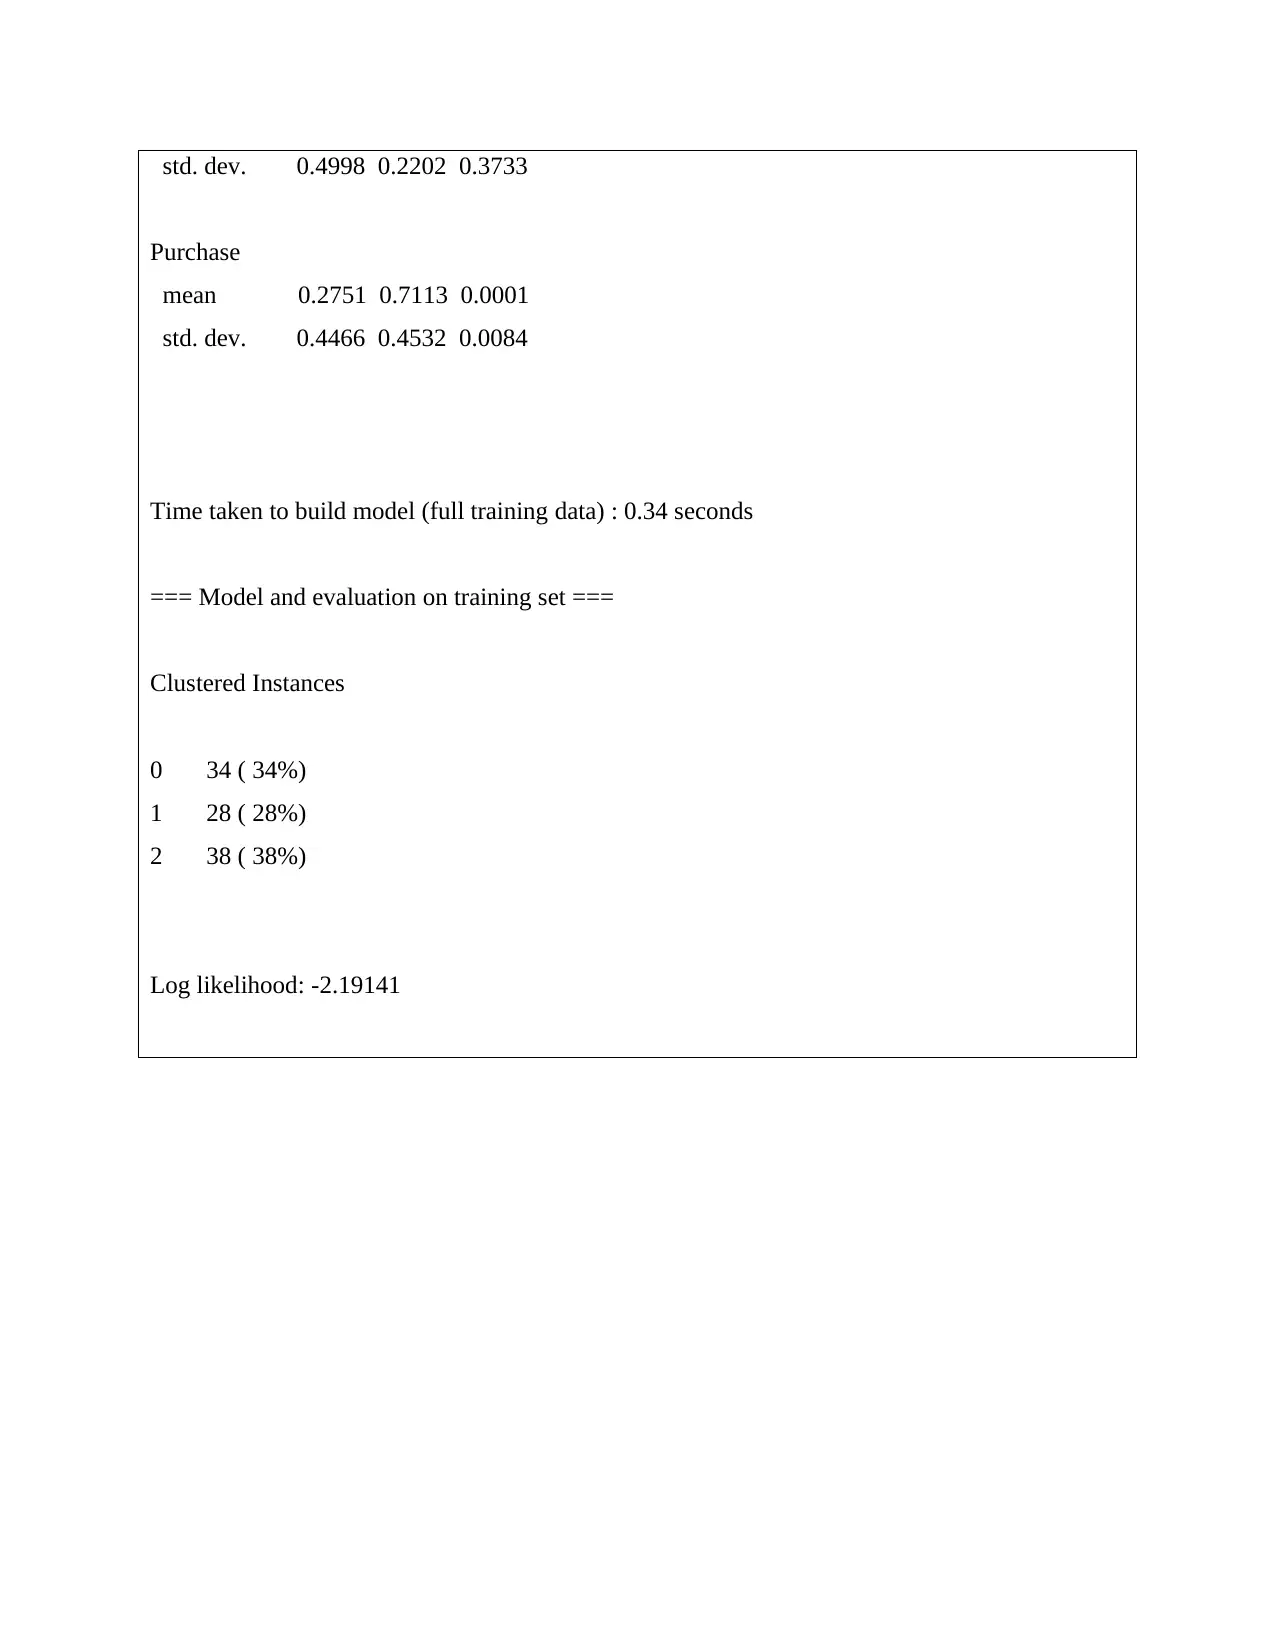
std. dev. 0.4998 0.2202 0.3733
Purchase
mean 0.2751 0.7113 0.0001
std. dev. 0.4466 0.4532 0.0084
Time taken to build model (full training data) : 0.34 seconds
=== Model and evaluation on training set ===
Clustered Instances
0 34 ( 34%)
1 28 ( 28%)
2 38 ( 38%)
Log likelihood: -2.19141
Purchase
mean 0.2751 0.7113 0.0001
std. dev. 0.4466 0.4532 0.0084
Time taken to build model (full training data) : 0.34 seconds
=== Model and evaluation on training set ===
Clustered Instances
0 34 ( 34%)
1 28 ( 28%)
2 38 ( 38%)
Log likelihood: -2.19141
⊘ This is a preview!⊘
Do you want full access?
Subscribe today to unlock all pages.
Trusted by 1+ million students worldwide
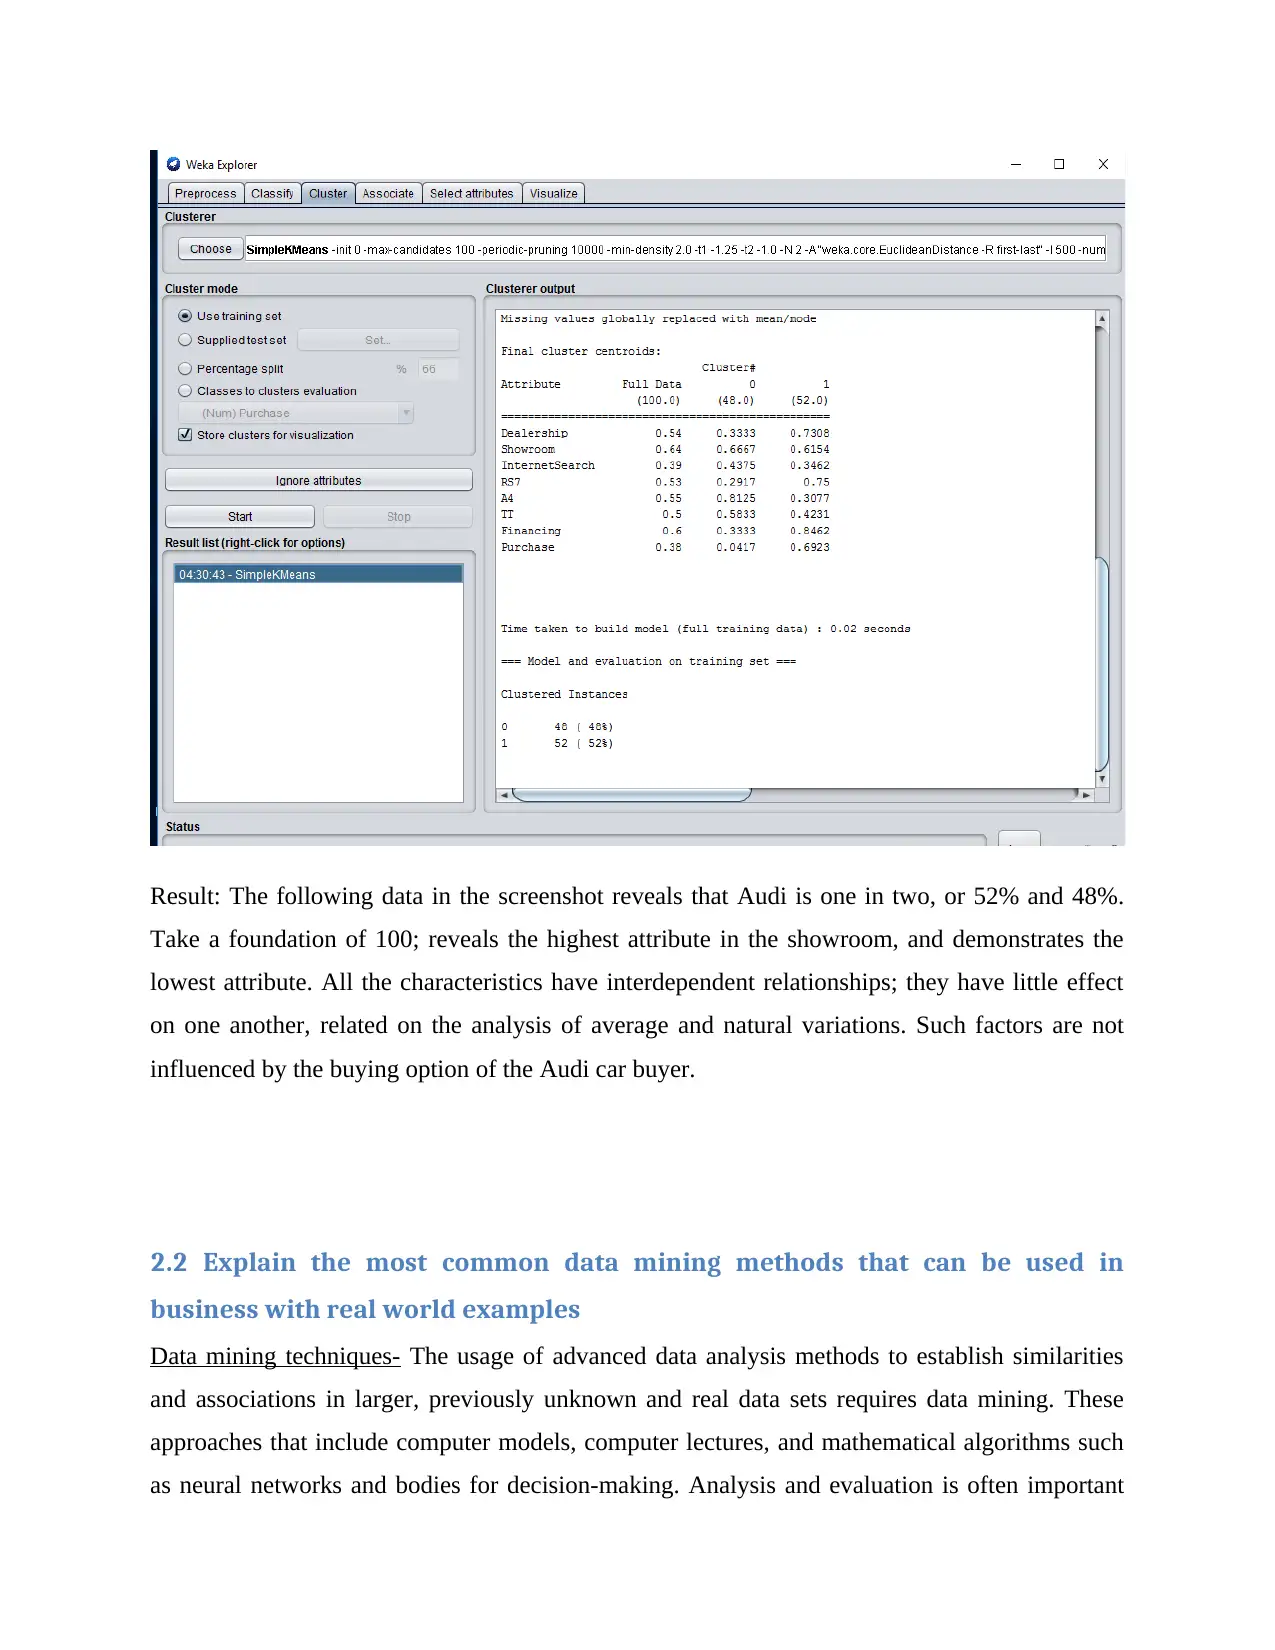
Result: The following data in the screenshot reveals that Audi is one in two, or 52% and 48%.
Take a foundation of 100; reveals the highest attribute in the showroom, and demonstrates the
lowest attribute. All the characteristics have interdependent relationships; they have little effect
on one another, related on the analysis of average and natural variations. Such factors are not
influenced by the buying option of the Audi car buyer.
2.2 Explain the most common data mining methods that can be used in
business with real world examples
Data mining techniques- The usage of advanced data analysis methods to establish similarities
and associations in larger, previously unknown and real data sets requires data mining. These
approaches that include computer models, computer lectures, and mathematical algorithms such
as neural networks and bodies for decision-making. Analysis and evaluation is often important
Paraphrase This Document
Need a fresh take? Get an instant paraphrase of this document with our AI Paraphraser
for data mining. Technology developments have resulted in significant amounts in various areas
and libraries. Therefore, important details which may ultimately be used in the decision-making
phase and market practices must be collected and utilized (Myung, Shim, Yeon and Lee, 2016).
Data mining is the method for extracting details and patterns from large data. Information
processing involves data acquisition, recovery, evaluation and study. Study or work into
experiments / models is often known as knowledge mining. Mining of knowledge. Data mining
is a logical process to find useful data. Once awareness and patterns are detected, decisions about
the development of a company may be made. Data mining tools respond to the company's
specific requirements that are very difficult to answer. Potential patterns are often anticipated to
proactively allow traders to decide. Data mining requires three steps:
Exploration- The data is cleared and transformed during this phase. The essence of the findings
is often calculated.
Pattern Recognition- The next step is to choose the pattern which makes the prediction the best.
Deployment- Known patterns are used to produce the required outcomes.
Data mining technique- One of the most critical activities for the sector is the selection of the
appropriate data mining technology. Data mining technology will be chosen according to the
organization's market and problem type. A standardized approach should be used to improve the
consistency and cost-effectiveness of usage. This article discusses seven main strategies for data
mining. Any other types of data mining are still available, but these 7 are widely used by
companies.
1. Statistical Techniques- for whatever time now, the world of statistics faces the same main
question as data science: how to precisely draw results from inadequate awareness of the earth.
The most important approach to statistics is a succinct and accurate justification for the
interaction between observations and conclusions. This text carries on from the same practice
and discusses a variety of basic problems arising from empirical data: hypothesis management,
trust estimation and unknown number measurement. Data mining is a branch of mathematical
mathematics that gathers data and explains results. Computational techniques are other strategies
which many people do not find as strategies for data extraction. Nevertheless, it also promotes
the analysis of patterns and predictive models. Furthermore, the data scientist wants to be
mindful of specific mathematical approaches. The planet today includes vast amounts of data and
significant gathering patterns. Statistics can allow you to work more easily with data issues.
What's the trend of the data network?
How often could this happen?
What are the company's most important trends?
What is a high level summary that gives you an overview into what is found in the file.
These issues are not only answered by the figures, but also by measures and tests. It also
promotes data collection. Various knowledge is essential, but data collection and counting are
the most relevant and valuable techniques. Intelligent choices should be made by way of facts.
Like other forms of information collection.
2. Clustering Techniques- Clustering is one of the main approaches of data mining. Clustering
classification is the process by which data are equally categorized. It allows clarifying the
variations and correlations between the tests (Jangra, Singh and Lakhina, 2016). This is also called
segmentation that allows users to consider the database's activities. Insurers may classify their
customers by work, sex, insurance system and the type of claims, for example. There are
numerous clustering methods:
I. Division methods
II. Hierarchical agglomerative methods
III. Density based methods
IV. Grid based methods
V. Model based methods
3. View
Visualization is the best way to recognize data patterns. In the outset of the data mining
process, this technique is used. Many university initiatives, recognized as chases, are now
beginning to develop innovative programs. There are many data mining techniques that create
⊘ This is a preview!⊘
Do you want full access?
Subscribe today to unlock all pages.
Trusted by 1+ million students worldwide
1 out of 16
Related Documents


Your All-in-One AI-Powered Toolkit for Academic Success.
+13062052269
info@desklib.com
Available 24*7 on WhatsApp / Email
![[object Object]](/_next/static/media/star-bottom.7253800d.svg)
Unlock your academic potential
Copyright © 2020–2026 A2Z Services. All Rights Reserved. Developed and managed by ZUCOL.